 |
VOOZH | about |
|
VOOZH | about |
There are a number of different libraries in Python that can be used to create visualizations of superhero characters. Some popular libraries include Matplotlib, Seaborn, and Plotly.
In this article, we use Matplotlib to generate visualizations and get insights from the Superheroes Dataset.
Matplotlib is a plotting library for Python that provides an object-oriented API for embedding plots into applications using general-purpose GUI toolkits like Tkinter, wxPython, Qt, or GTK. It has a wide range of capabilities and can create a variety of different types of plots, including line plots, scatter plots, bar plots, pie plots, and more.
CSV (Comma Separated Values) is a file format that stores data in a tabular form, i.e., in the form of rows and columns where each column is separated by a comma.
For generating better conclusions and plotting visualizations from the dataset, first, the data should be reliable and clean. Pre-processing of data is the major step to be performed for any dataset to get insights from it. It means we need to check whether all the values are present in the dataset or not. Find any missing values and fill in or remove them completely if needed.
So, Let's import the required libraries and clean our dataset. Later, we can perform some visualizations accordingly.
Step 1: Importing required libraries.
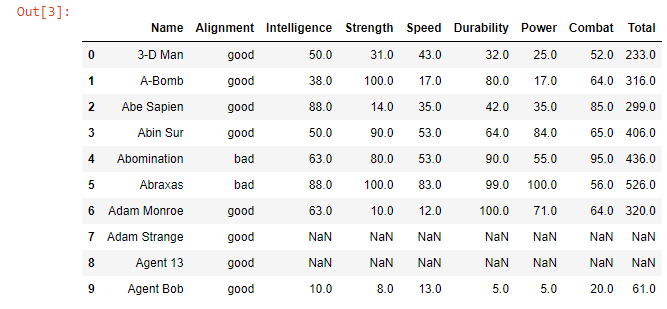
Step 2: Cleaning the dataset and find any missing values.
Output:
We can observe columns 7 and 8 have missing values (NaN). So, they need to be removed.
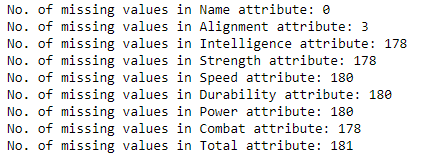
Let's list out how many missing values the dataset contains through the below code.
Output:
From the above python code, we found the dataset contains null values for the entire columns of some specific rows. So, such rows are dropped entirely with dropna( ) method for our effective use of dataset.
Step 3: Getting insights from the Superheroes dataset.
Data Insight 1:
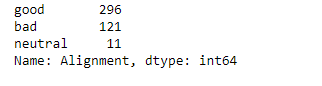
Let's find the nature (good, bad and neutral) of superheroes with the help of the Alignment column from the dataset.
Output:
Plotting pie-plot to know the percentage of superheroes with good, bad and neutral natures.
Output:
Data Insight 2:
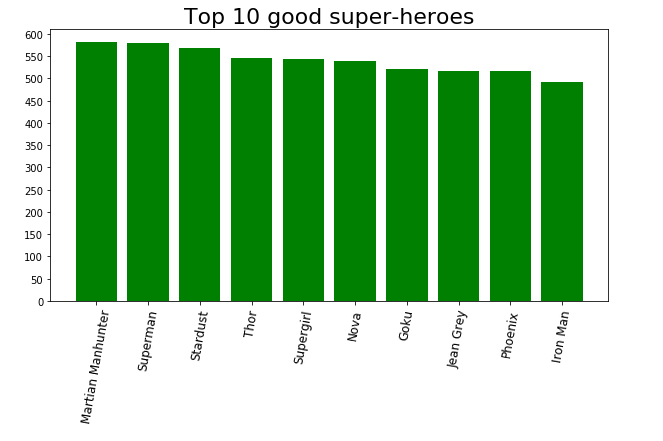
Let's find the top 10 superheroes who are good-natured.
Output:
From the output, we can see that the overall top superheroes are Martian Manhunter, Superman, Stardust, Thor, Supergirl, Nova, Goku, Jean Grey, Phoenix and Iron Man.
Data Insight 3:
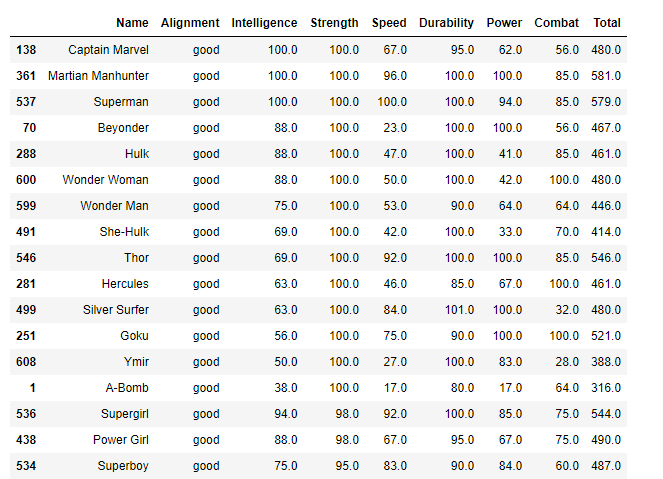
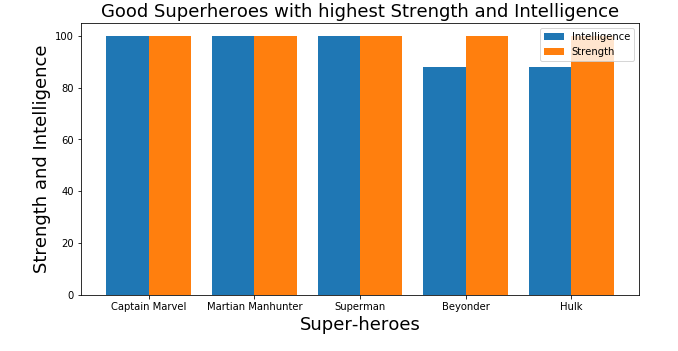
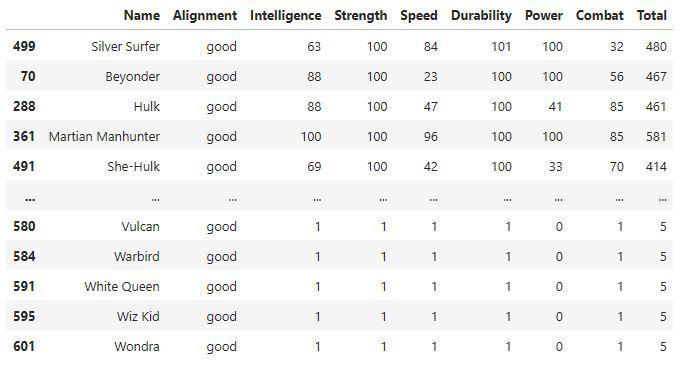
Now, let's find all the good superheroes having the Highest Strength and Intelligence.
Output:
Output:
From this output, we can conclude that Captain Marvel, Martian Manhunter, Superman, Beyonder and Hulk have high Strength and Intelligence compared to other characters.
Data Insight 4:
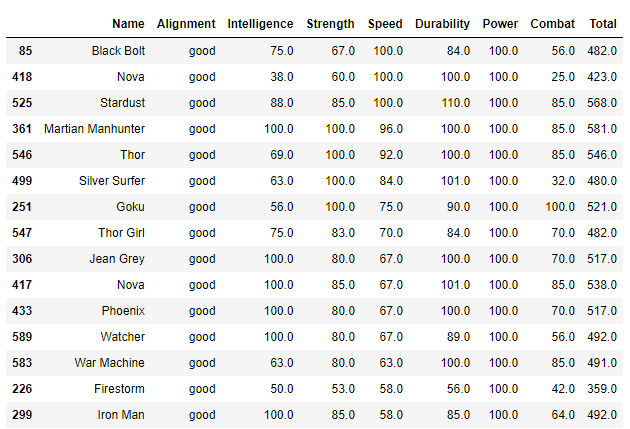
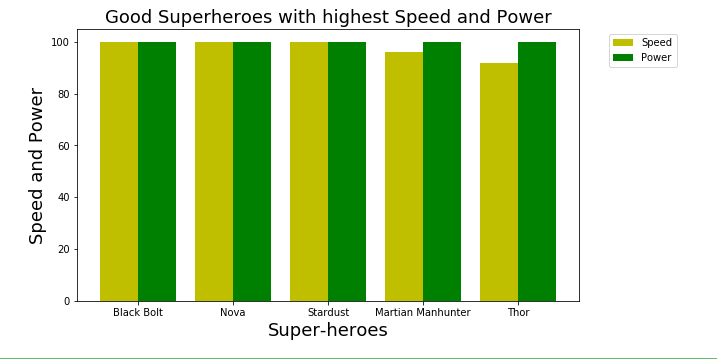
Let's find the Top 5 Highest Power Superheroes along with the highest Speeds.
Output:
Output:
Data Insight 5:
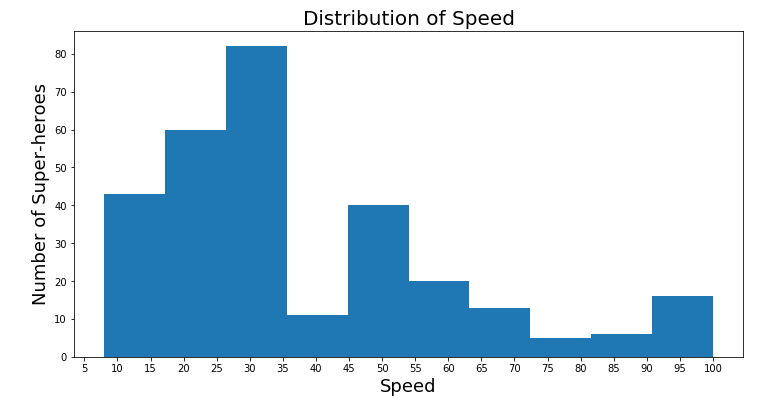
Plotting Histogram to know the distribution of Speeds of Good Super-heroes from the dataset:
Output:
From the Distribution of the Speed histogram, we observe that there are 20 good superheroes with highest speed between 90-100 and there are 80 good superheroes with 25-35 speed range.
Data Insight 6:
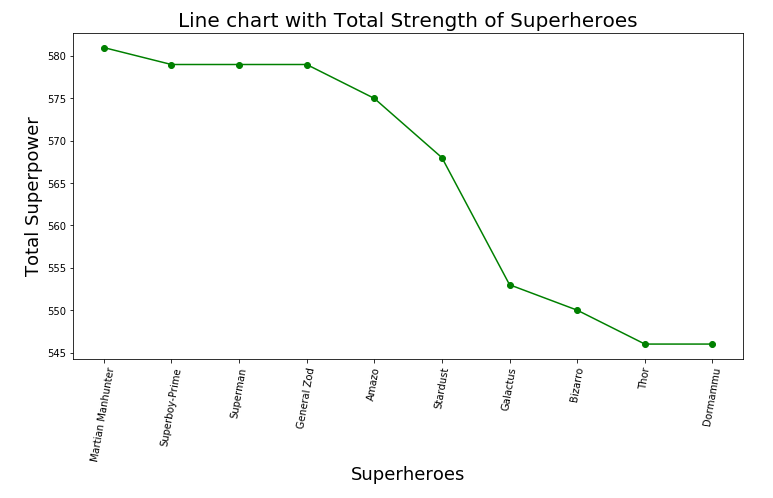
Plotting Line chart to know the superheroes with Total Superpower
The 'Total' column value in the dataset includes the sum of the superhero's Intelligence, Strength, Speed, Durability, Power and Combat values.
Output:
In this way, we can generate many such visualizations, customize them and gather insights from the data.
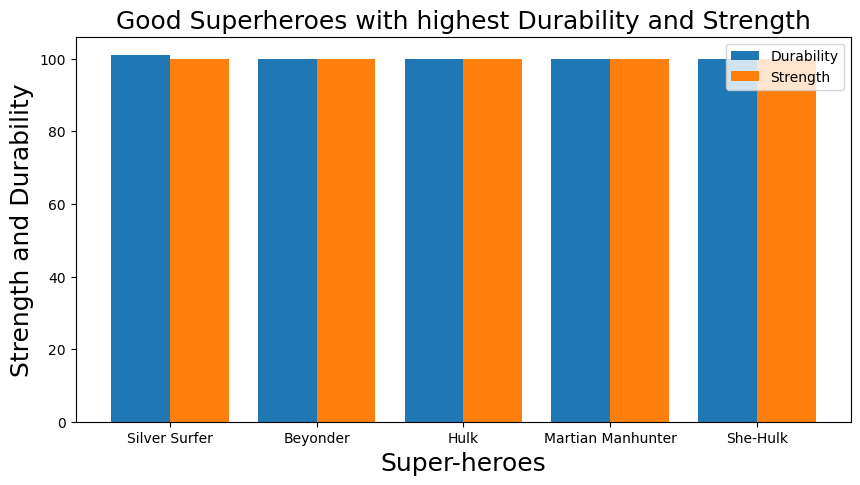
Plotting bar charts of only Good super heroes with highest strength and durability
We all know that to defeat enemy and win fights easily having durability is as much important as having sheer strength. So in this plot we will check which good natured super heroes have the highest strength and durability.
Output -