 |
VOOZH | about |
|
VOOZH | about |
TensorFlow Playground is an interactive web tool that lets users explore neural networks visually. It offers a hands-on interface to adjust neurons, layers, activation functions and training settings, allowing users to instantly observe how these changes impact the model’s performance.
1. No Coding Required: TensorFlow Playground removes the need to write any code, making it apt for those who are new to machine learning. You can intuitively grasp the behavior of neural networks by interacting with graphical elements rather than using programming and mathematical logic.
2. Interactive Learning: The platform offers a dynamic environment where you can modify hyperparameters such as learning rate, number of layers, activation functions. You can observe how these changes affect the model’s decision boundaries and performance.
3. Great for Beginners: By visualizing data flow and weight updates during training, you can better understand core principles such as overfitting, underfitting, and generalization. This makes complex ideas more accessible and less abstract.
4. Quick Experimentation: TensorFlow Playground allows for rapid prototyping of neural network configurations. You can experiment with different setups instantly, making it easy to compare results and gain insights into model behavior.
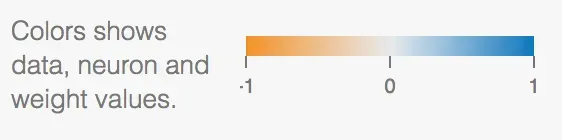
Blue indicates a value of +1, orange represents -1 and white corresponds to 0.
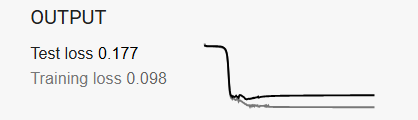
This sample run of TensorFlow Playground demonstrates how the model gradually converges during training. It helps visualize the point at which further learning becomes minimal, allowing you to understand how many epochs are sufficient for effective training.
During training, the graphs at the top of the interface show how well the model is learning. The training and test accuracy curves give insight into how the model is generalizing to unseen data. A consistent gap between training and test accuracy may indicate overfitting. Ideally, both should improve over time and stabilize, signaling that the model has learned meaningful patterns.
A steep decline at the beginning typically indicates fast learning, while a flatter curve later on suggests convergence. If the loss plateaus or oscillates without decreasing, it may indicate that the learning rate is too high or that the model has reached its capacity to learn from the current architecture or data.
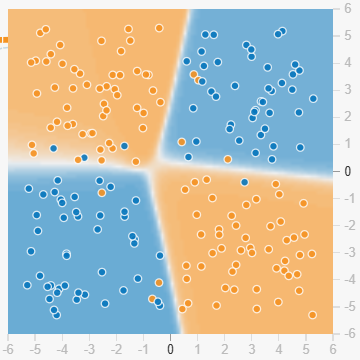
As the network trains, it forms decision boundaries that separate different classes in the input space. These are visualized in the background of the data plot. The color shows which class the model predicts in each region, and the sharpness or complexity of these boundaries reflects how well the model fits the data. Smooth boundaries usually indicate better generalization, while overly complex ones may suggest overfitting.
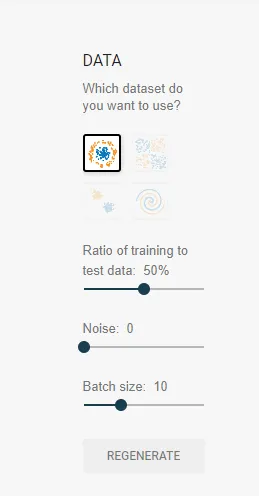
Experimenting with different hyperparameters is key to improving model performance. Adjust settings like learning rate, activation functions, regularization methods, and batch size to see how they impact learning. For instance, a smaller learning rate may lead to more stable convergence, while trying out different activation functions can help the network capture non-linear patterns more effectively.
Too few layers or neurons can lead to underfitting, where the model fails to capture important patterns in the data. On the other hand, too many layers or neurons may result in overfitting, where the model memorizes training data but performs poorly on new data. Use the test accuracy and decision boundaries as visual cues, overly intricate decision regions often suggest the model is too complex. Start simple and gradually increase complexity while monitoring both training and test performance.