Regression is a supervised learning technique used to predict continuous numerical values by learning relationships between input variables (features) and an output variable (target). It helps understand how changes in one or more factors influence a measurable outcome and is widely used in forecasting, risk analysis, decision-making and trend estimation.
Helps to identify strengths and the type of relationships
Supports both simple and complex predictive models.
Used for tasks like price prediction, trend forecasting and risk scoring.
Types of Regression
Regression can be classified into different types based on the number of predictor variables and the nature of the relationship between variables:
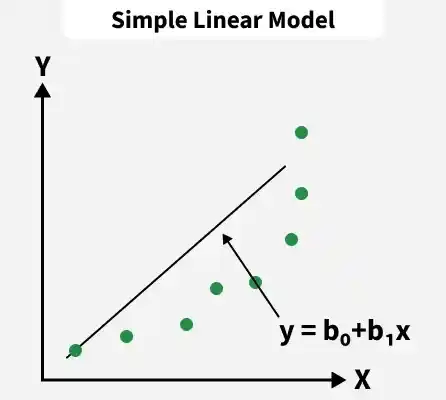
1. Simple Linear Regression
Simple Linear Regression models the relationship between one independent variable and a continuous dependent variable by fitting a straight line that minimizes the sum of squared errors. It assumes a constant rate of change, meaning the output varies proportionally with the input.
Application: Estimating house price from only its size
Advantage: Highly interpretable due to its simple mathematical structure
Disadvantage: Cannot capture curved or complex data patterns
2. Multiple Linear Regression
Multiple Linear Regression extends simple linear regression by incorporating multiple independent variables to predict a continuous outcome. Each predictor is assigned a coefficient that reflects its individual impact while holding other variables constant.
Application: Predicting house prices using multiple factors like size, location, age and number of rooms
Advantage: Captures the combined influence of many factors simultaneously
Disadvantage: Performance drops in the presence of multicollinearity (features highly correlated with each other)
3. Polynomial Regression
Polynomial Regression models non-linear relationships by transforming input features into higher-degree polynomial terms (e.g x², x³). Although it models non-linear relationships in input features, it is linear in coefficients (parameters), which is why it is still considered a linear model.
Application: Modelling curved growth trends like population increase or temperature variation
Advantage: Effectively captures non-linear relationships without switching to non-linear algorithms
Disadvantage: Higher-degree polynomials may lead to overfitting and unstable predictions
4. Ridge and Lasso Regression
Ridge and Lasso are regularized linear regression techniques that add penalty terms to limit large coefficients and reduce overfitting. Ridge (L2) shrinks coefficients smoothly, while Lasso (L1) can reduce some coefficients to zero, enabling feature selection.
Application: Used in high-dimensional datasets like marketing attribution or gene expression data
Advantage: Controls overfitting and improves generalization, especially with many predictors
Disadvantage: Penalty terms make model interpretation less straightforward
5. Support Vector Regression (SVR)
Support Vector Regression applies the principles of Support Vector Machines to regression tasks. It fits a function within a defined margin (epsilon-tube) and penalizes errors only when predictions fall outside this boundary. Kernel functions allow SVR to model non-linear relationships.
Application: Predicting continuous outcomes such as stock values or energy consumption
Advantage: Works well with high-dimensional, complex datasets and non-linear patterns
Disadvantage: Computationally intensive and requires careful tuning of kernels and parameters
6. Decision Tree Regression
Decision Tree Regression splits the data into hierarchical branches based on feature thresholds. Each internal node represents a decision question and leaf nodes represent predicted continuous values. It learns patterns by recursively partitioning the data to minimize prediction errors.
Application: Predicting customer spending behavior based on demographic and financial features
Advantage: Easy to visualize and understand decision logic
Disadvantage: Easily overfits, especially when the tree becomes deep and complex
7. Random Forest Regression
Random Forest Regression is an ensemble method that builds multiple decision trees using different data samples and averages their predictions. This reduces the overfitting tendency of single trees and improves accuracy through diversity (bagging). Each tree captures a slightly different aspect of the data.
Huber Loss: A hybrid loss function that transitions from MAE to MSE for larger errors, providing balance between robustness and MSE’s sensitivity to outliers.
R2 – Score: Higher values indicate better fit ranging from 0 to 1.
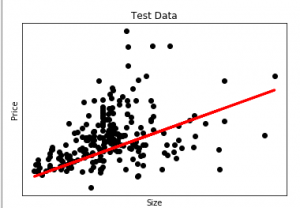
Implementing Linear Regression in Python
Here we apply linear regression to a housing dataset to predict house prices. The following Python code demonstrates how this model is implemented.
