Sometimes we want to save charts and graphs as images or even images as a file on disk for use in presentations to present reports. And in some cases, we need to prevent the plot and images for future use. In this article, we'll see a way to save a plot as an image by converting it to an image, and we'll also see how to use the save file feature in some of the most popular data visualizations and plotting Python libraries to save plots as an image.
Saving a plot as an image by converting it to a PIL Image in Python
Below are some approaches which we followed to Save a Plot as an Image.
Importing necessary library for plotting.
Creating a list or loading data for plotting a line graph
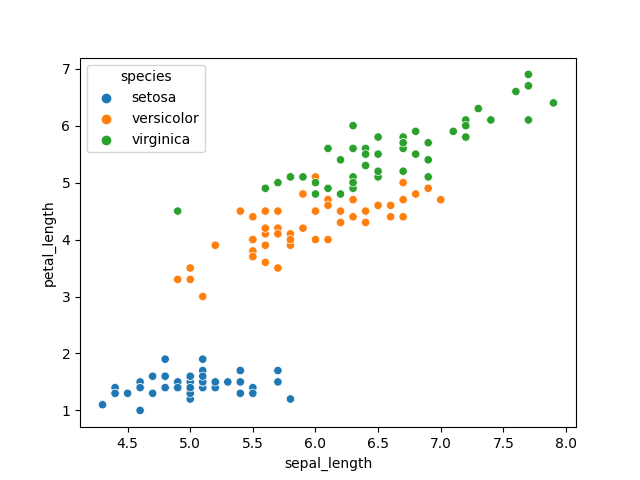
Plotting line Graph with the created list or load data.
Create a Function for Converting a passed figure to a PIL Image.
Save the return image in a variable by passing a plot in the created function for Converting a plot to a PIL Image.
Save the image with the help of the save() Function.
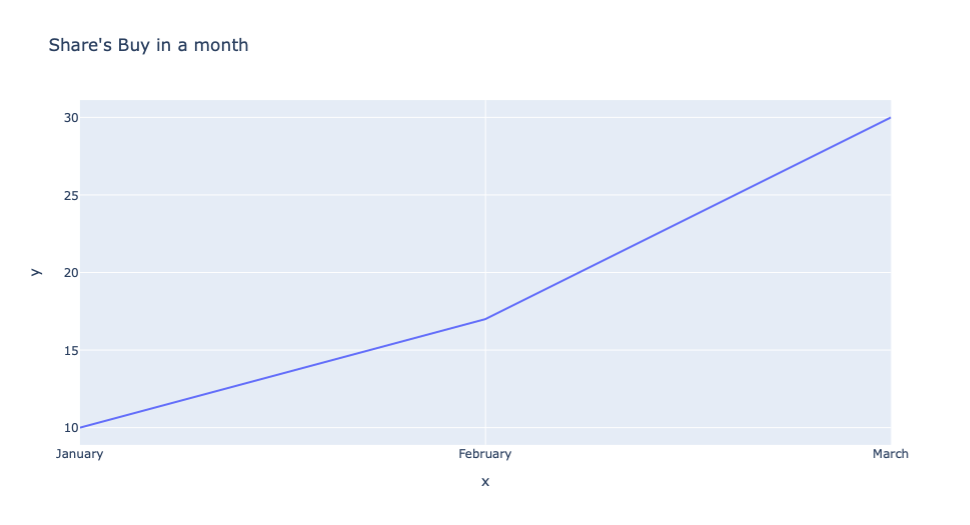
There are times when we create 3D visualizations then it requires interactive features to carefully analyze the graph. To enable these features in the Matplotlib library then we will have to add inline magic in the python code that is %matplotlib notebook after adding this the graph which is created have different options to save, zoom and focus on a selected rectangular area.
In the above interactive plot, there is an option there to download the image, and hence using this we can download or save an interactive plot in Python. Instead of using plt.show() if we will use plt.close() then this interactive feature of the plot will disappear automatically.
