 |
VOOZH | about |
|
VOOZH | about |
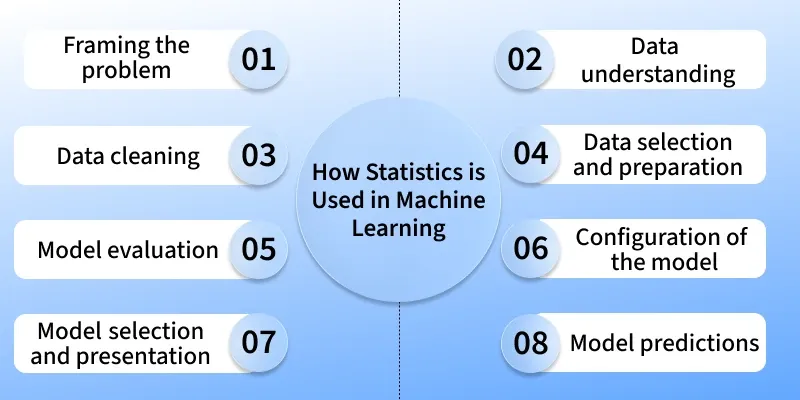
Statistics for Machine Learning is the study of collecting, analyzing and interpreting data to help build better machine learning models. It provides the mathematical foundation to understand data patterns, make predictions and evaluate model performance.
Statistics is a key component of machine learning, with broad applicability in various fields.
There are commonly two types of statistics, which are discussed below:
Descriptive statistics summarize and describe the features of a dataset, providing a foundation for further statistical analysis.
Mean | Median | Mode |
|---|---|---|
| Mean is the sum of all values divided by the total number of values. Mean μ = Sum of Values \ Number of Values | Median is the middle value of sorted data For odd number of data points: Median For even number of data points: Median = Average of value and its next value | Mode is the most frequently occurring value in the dataset. |
Inferential statistics involve making predictions or inferences about a population based on a sample of data.
Hypothesis testing is a method that compares two opposite assumptions about a population and uses data from a sample to determine which assumption is more likely to be true.
Covariance | Correlation |
|---|---|
| Covariance measures the degree to which two variables change together. | Correlation shows how strongly and in which direction two variables are related. Its coefficient ranges from -1 to 1, where positive means they move together and negative means they move oppositely. Pearson's correlation coefficient is given by: |
Understanding relationships between variables is important in machine learning.
Probability theory forms the backbone of statistical inference, aiding in quantifying uncertainty and making predictions based on data.
Basic Concepts
Common Probability Distributions
Bayesian statistics combine prior knowledge (what we already believe) with new data (current evidence) to update our understanding.
Bayes' Theorem is a fundamental concept in probability theory that relates conditional probabilities. It is named after the Reverend Thomas Bayes, who first introduced the theorem. Bayes' Theorem is a mathematical formula that provides a way to update probabilities based on new evidence.
Formula:
Where