 |
VOOZH | about |
|
VOOZH | about |
Data manipulation in Python mainly involves creating, modifying and analyzing datasets using Pandas. It helps clean and prepare data for further tasks like analysis or machine learning.
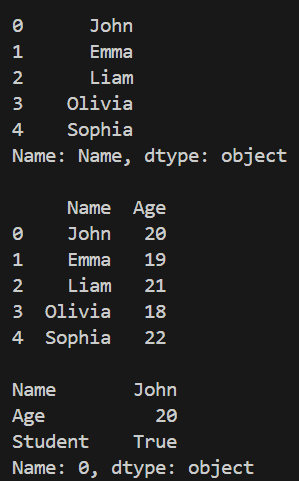
A DataFrame is the core data structure in pandas, used to store data in a tabular form. In this section, we create a DataFrame manually by assigning values to columns, which is useful for small datasets or testing.
 Name Age Student
0 John 20 True
1 Emma 19 True
2 Liam 21 False
3 Olivia 18 True
Explanation:
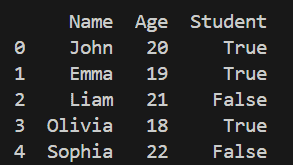
To add new records to an existing DataFrame, Pandas provides the pd.concat() function. It combines two DataFrames together, making it the correct and recommended way to add rows in modern Pandas versions.
Output
Explanation:
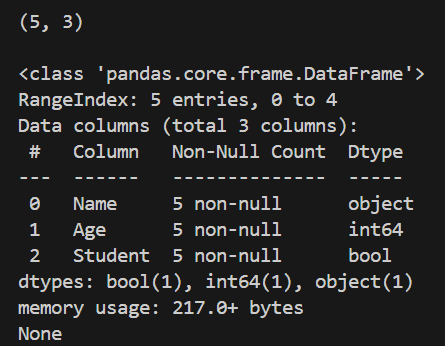
To quickly understand the structure of a dataset, Pandas provides .shape and .info() methods. These methods help identify the number of rows, columns, data types and presence of missing values.
Output
Explanation:
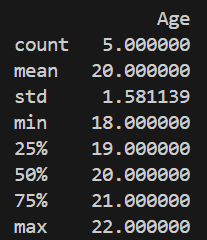
For numerical analysis, Pandas provides the .describe() method. It generates key statistical measures like mean, standard deviation, minimum, maximum and quartiles, helping in understanding data distribution.
Output
Explanation: df.describe() gives count, mean, std, min, max, quartiles
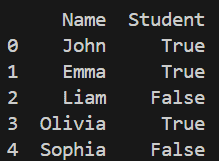
The .drop() method with axis=1 is used to remove unwanted columns from a DataFrame. This is useful when certain features are not required for analysis or modeling.
Output
Explanation:
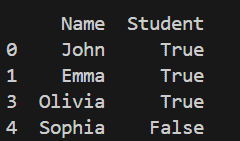
The .drop() method with axis=0 allows removal of specific rows based on their index. This is commonly used to eliminate incorrect or irrelevant records from the dataset.
Output
Explanation:
Pandas provides multiple ways to access data using column names and indexing methods like .loc[]. These methods help retrieve specific columns, multiple columns, or individual rows for analysis.
Output
Explanation:
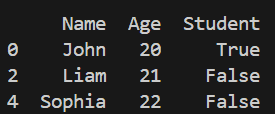
Filtering in Pandas is done using conditional expressions inside the DataFrame. It allows selecting rows that satisfy a given condition, making it useful for focused data analysis.
Output
Explanation:
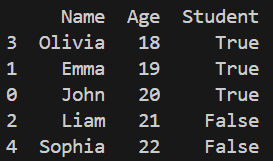
The .sort_values() method is used to arrange data based on column values. It helps in organizing the dataset in ascending or descending order for better readability and analysis.
Output
Explanation: sort_values(by='Age') sorts data based on Age column