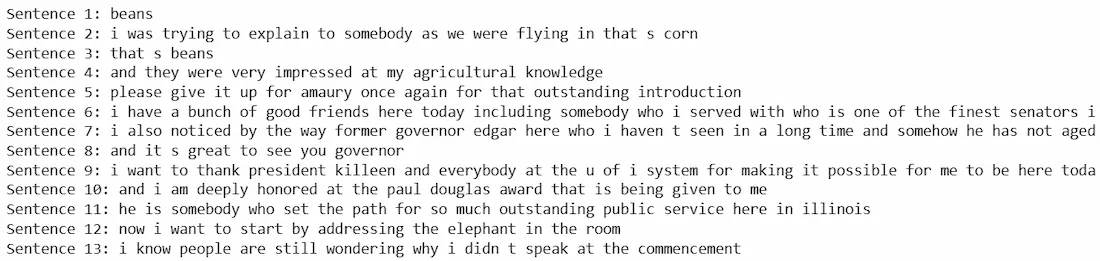
In Natural Language Processing (NLP), text data must be converted into numerical form so that machine learning algorithms can process it. The Bag of Words (BoW) model is a simple and commonly used method for this purpose.
Converts text (sentence, paragraph, or document) into a collection of words
Counts how often each word appears in the text
Ignores word order and grammar, focusing only on frequency
Key Components of BoW
Vocabulary: It is a list of all unique words from the entire dataset. Each word in the vocabulary corresponds to a feature in the model.
Document Representation: Each document is represented as a vector where each element shows the frequency of the words from the vocabulary in that document. The frequency of each word is used as a feature for the model.
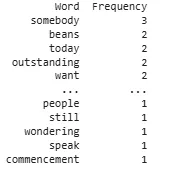
In this step, we count the frequency of each word in the preprocessed text. We will store these counts in a pandas DataFrame to view them easily in a tabular format.
We initialize a dictionary to hold our word counts.
For each word, we check if it exists in our dictionary. If it does, we increment its count. If it doesn’t, we add it to the dictionary with a count of 1.
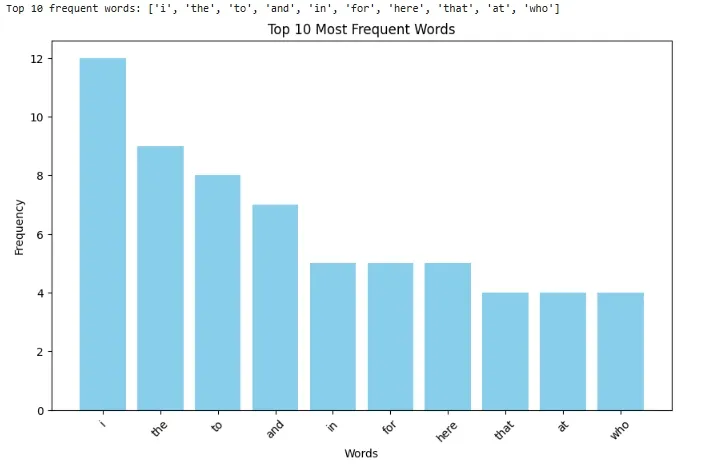
Now that we have counted the word frequencies, we will select the top N most frequent words (e.g top 10) to be used in the BoW model. We can visualize these frequent words using a bar chart to understand the distribution of words in our dataset.
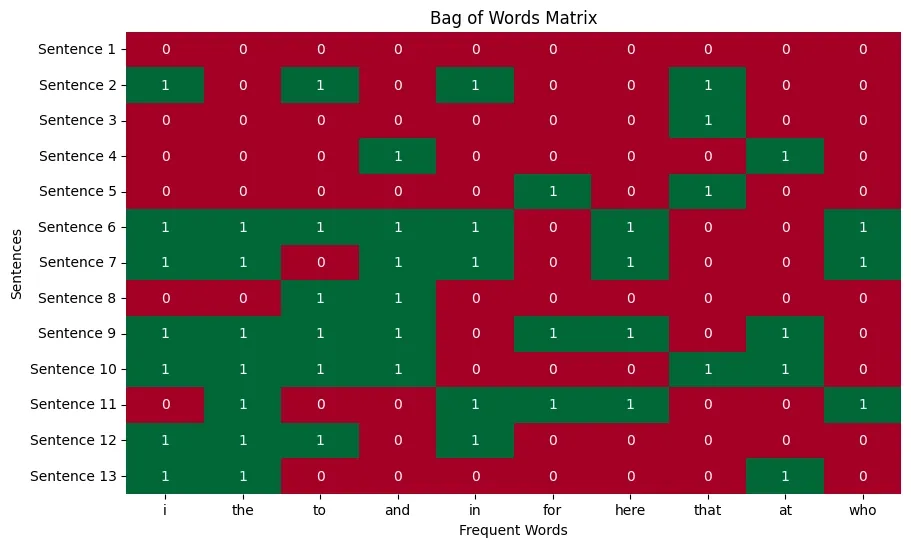
Now we will build the Bag of Words (BoW) model. This model is represented as a binary matrix where each row corresponds to a sentence and each column represents one of the top N frequent words. A 1 in the matrix shows that the word is present in the sentence and a 0 shows its absence.
We will use a heatmap to visualize this binary matrix where green shows the presence of a word (1) and red shows its absence (0).
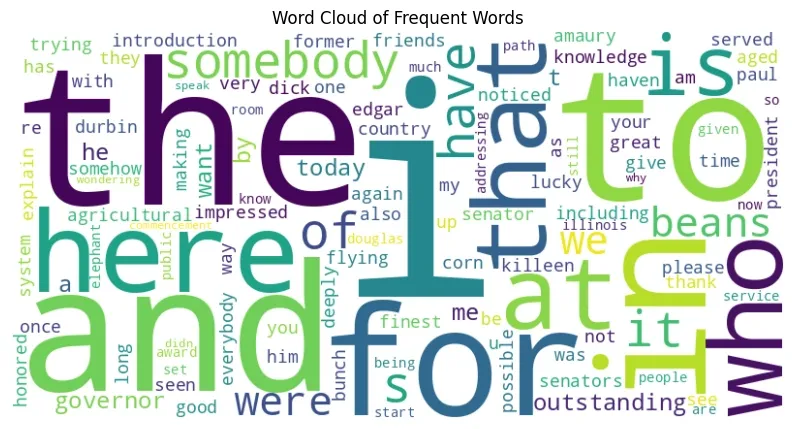
Step 5: Visualizing Word Frequencies with a Word Cloud
Finally, we can create a Word Cloud to visually represent the word frequencies. In a word cloud, the size of each word is proportional to its frequency which makes it easy to identify the most common words at a glance.
Output:
👁 bow5- Visualizing Word Frequencies with a Word Cloud
Advantages
Simplicity: It is easy to implement and computationally efficient.
Versatility: It can be used for various NLP tasks such as text classification, sentiment analysis and document clustering.
Interpretability: The resulting vectors are interpretable which makes it easy to understand which words are most important in a document.
Limitations
Loss of Context: It ignores word order and context which means it might miss important relationships between words.
Sparsity: When working with large datasets, most word vectors will be sparse (containing mostly zeros) which can lead to inefficiency.
Limited Semantic Understanding: The model doesn’t capture the meaning of words which can be important for some NLP tasks.
