 |
VOOZH | about |
|
VOOZH | about |
Working with numbers is central to data analysis. It involves collecting, organizing and calculating data to reveal patterns, trends and insights. From finance to research, numbers form the foundation for understanding information and making informed decisions. In this article, we will work with Numbers in Power BI.
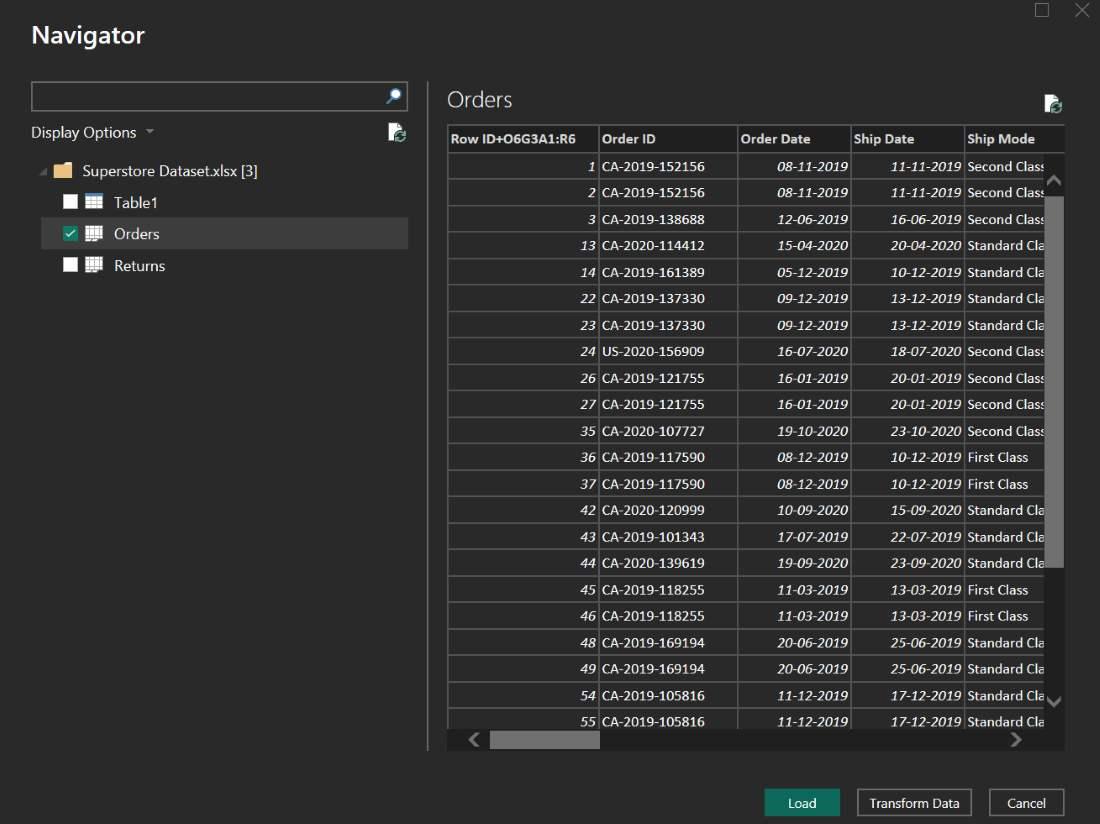
We are using Superstore dataset for this tutorial. To download the dataset click here.
Before you can work with numbers in Power BI, you need to import your numerical data. This can come from a variety of sources including databases, Excel spreadsheets, web services and more. Power BI allows you to connect to these sources and load data into your project.
Once the data is imported, Power BI will automatically recognize numerical fields and format them accordingly. This data can then be used in visualizations, calculations and aggregations.
For example, here’s the loaded Superstore dataset (13 columns):
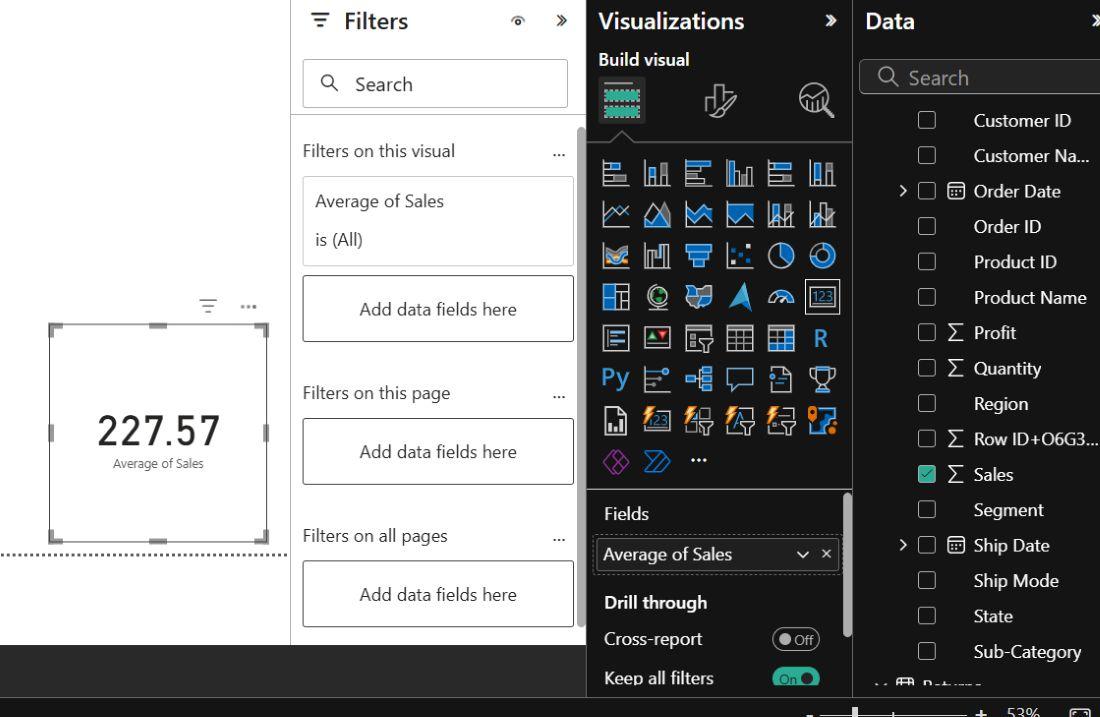
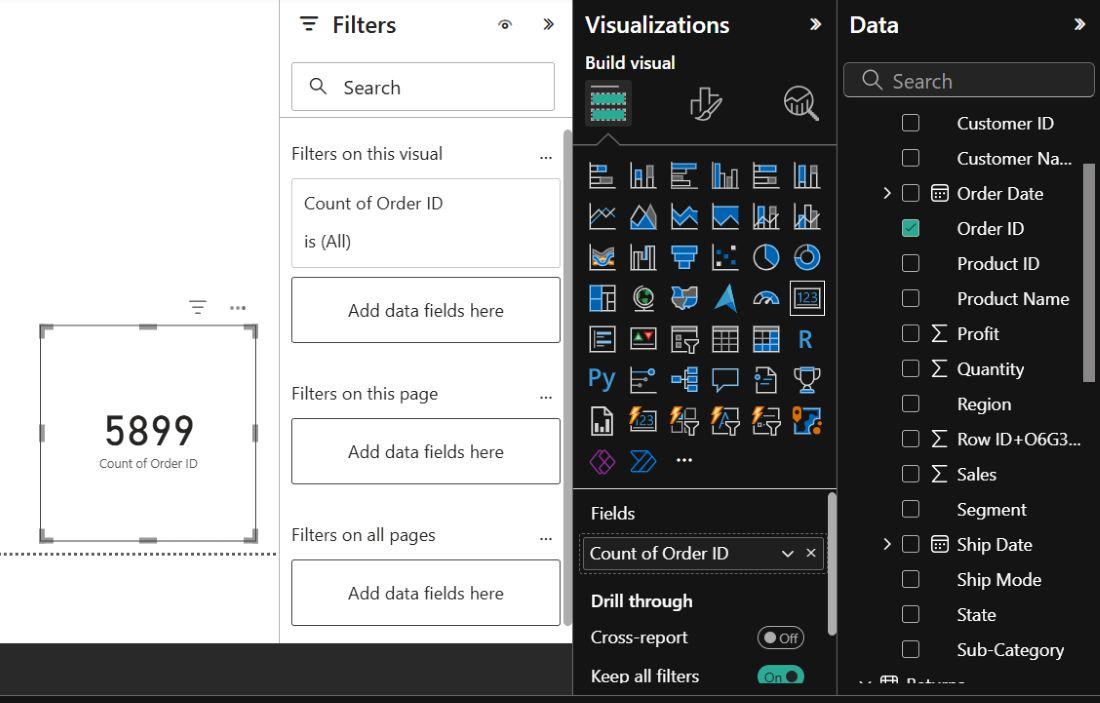
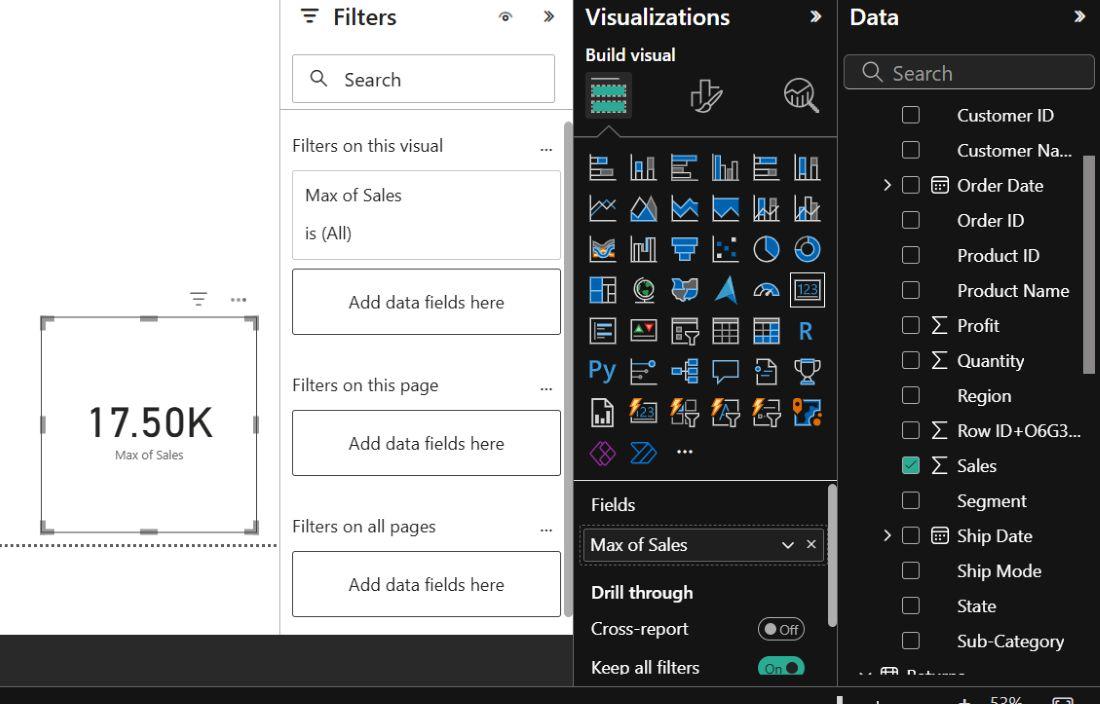
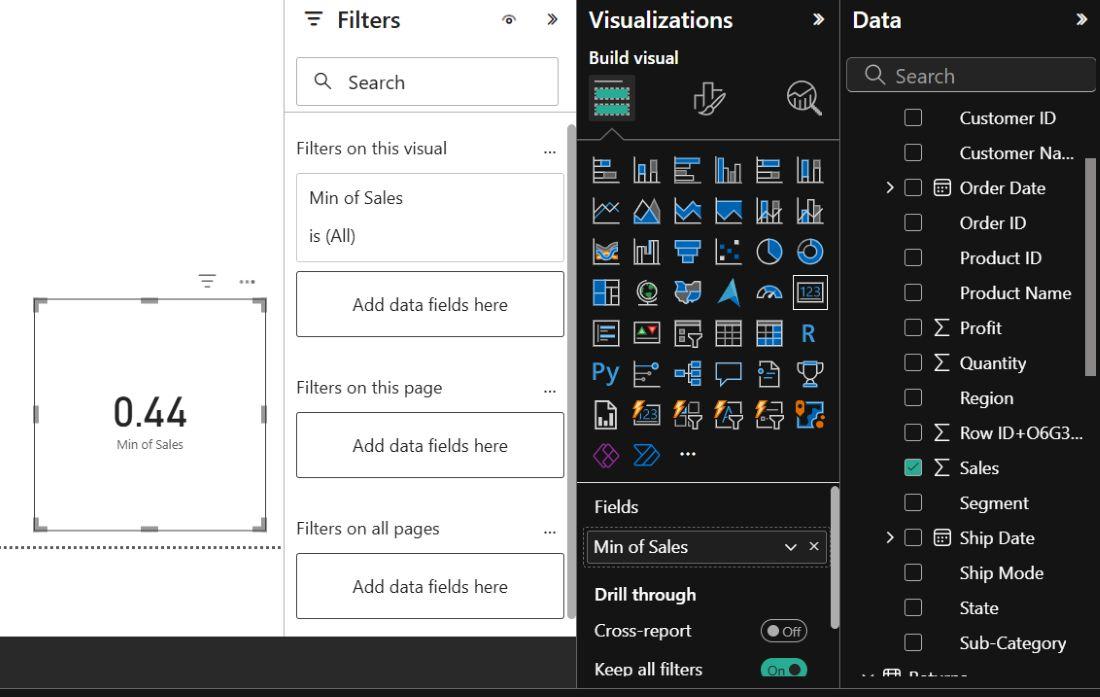
One of the primary ways you work with numerical data in Power BI is by aggregating it. Aggregation involves summarizing large datasets into more manageable and meaningful values. Here are some common aggregation functions used in Power BI:
This function adds up all the values in a numerical column, useful for calculating total sales, revenue or quantities.
Calculates the mean or average value of a numerical column which can help you understand typical values in your data.
Counts the number of records in a column which can be useful for understanding the volume of data or the number of occurrences of a specific item.
These functions find the smallest and largest values in a column, helping identify extremes in your data.
Useful for finding the middle value and dividing data into quartiles which can provide insights into the data's distribution.
Power BI offers the ability to create calculated columns using Data Analysis Expressions (DAX). This feature allows you to generate new numerical columns based on existing data. Common use cases for calculated columns include:
For Calculated Columns or Customized Columns:
Click on transform data,
It will take you to Power Query Editor.
Here we calculated the custom column of Delivery Days by subtracting Ship Data and Order Date
Calculated columns are a crucial feature in Power BI for working with numbers. You can create new columns based on calculations using DAX (Data Analysis Expressions).
Now we'll change the data type of column .
Lastly the column with changed datatype :
Numerical data becomes more meaningful when visualized. Power BI offers various charts to represent aggregated numbers.
Formatting numeric data in Power BI is essential for presenting data in a clear and meaningful way to users. Power BI offers various formatting options, data types and custom number formats to help you achieve this. Below are some examples of how to format numeric data in Power BI:
Power BI provides several formatting options for numeric data. To apply these formats:
Power BI allows you to create custom number formats using the following symbols:
For example, you can create a custom number format like "$#,##0.00" to format a currency value with a thousand separator and two decimal places.
-(3).jpg)
.jpg)
.jpg)