 |
VOOZH | about |
|
VOOZH | about |
Creating insightful reports often requires data to be organized and categorized based on specific conditions. Conditional columns helps change or add values in a column based on logic you define. In this article, we’ll learn how to create conditional columns using Power Query Editor.
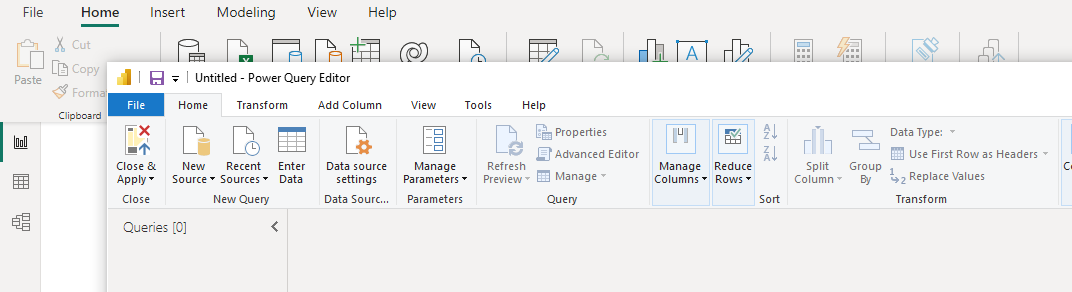
To create conditional column, you first need to open the Power Query Editor. Steps include:
If you haven’t uploaded your data yet you can do it here by clicking on New Source and selecting your dataset.
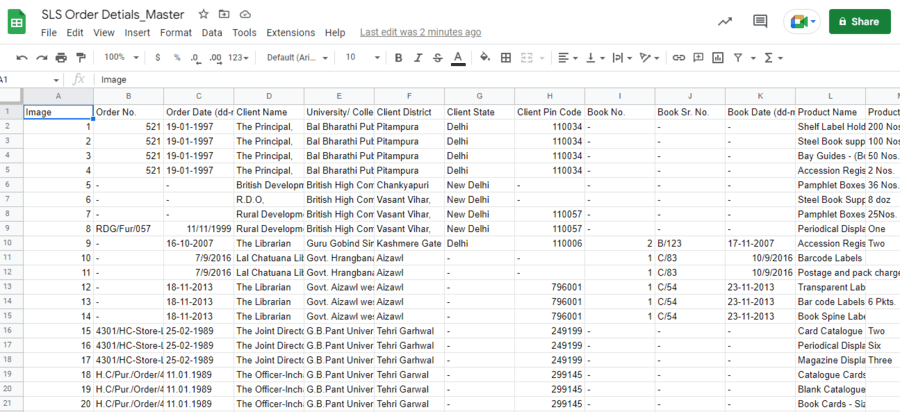
Below is the screenshot of the dataset as well. In this example we are using a dataset which you can download from here, from a Library Supplies company which looks like this:
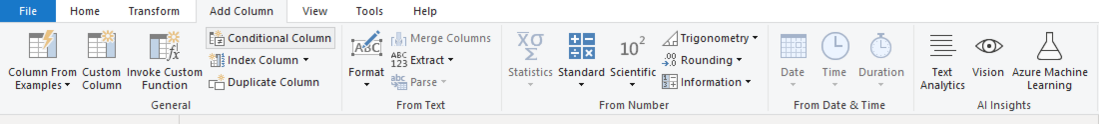
Now that you are inside the Power Query Editor let's add a Conditional Column. Follow the below steps:
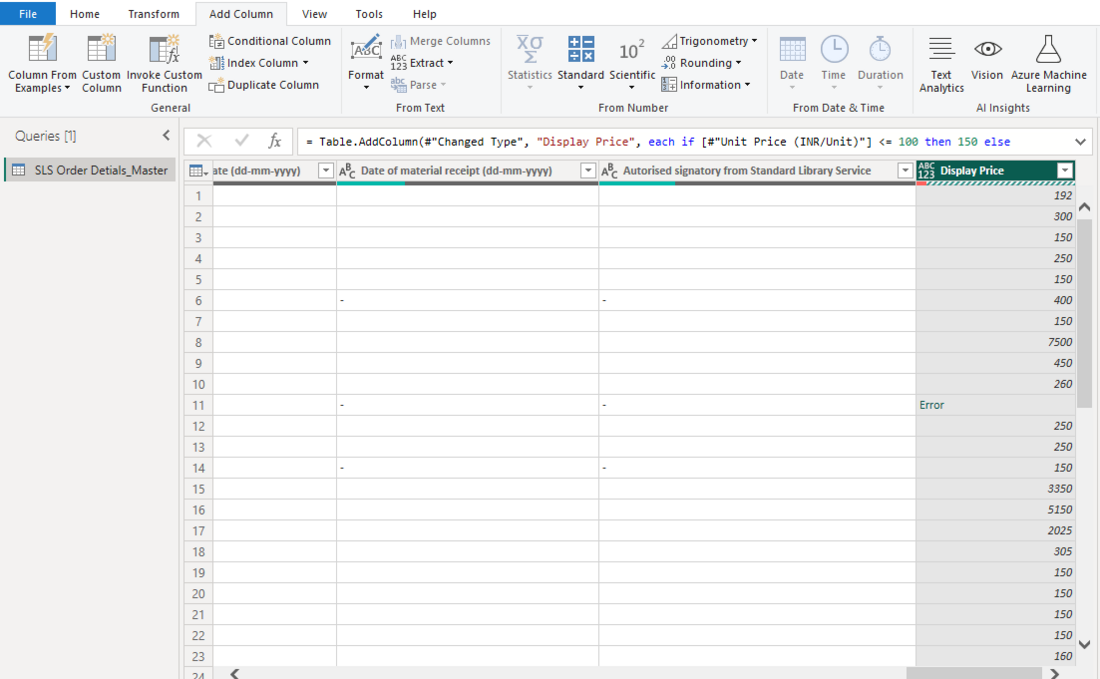
A dialog box will appear where you can set your conditions. Here we are targeting the "Unit Price (INR/Unit)" column from the Data Table to create a conditional column "Display Price". The condition is if the "Unit Price is less than or equal to 100" we will set the Unit Price as 150 else the original price would be unchanged and all the changed or unchanged values would be inserted into the "Display Price" column respectively.
The output of the query will add the conditional column.
Now let's add another conditional column named "Final Price" that will contain the "Unit Price (INR/Unit)" column value if it is less than or equal to 200 set it to 500. Else if it is greater than or equal to 500 Store the Unit Price. However the figure from the "Total Price (INR)" column will be the Output if none of the earlier tests returned a positive result.
The output of the query will add the conditional column.
Creating conditional columns in Power BI is very easy once you understand the steps. It helps you control how your data looks without writing complex formulas. This makes your reports more dynamic and meaningful.
.png)