 |
VOOZH | about |
|
VOOZH | about |
Time series analysis using the ARIMA (AutoRegressive Integrated Moving Average) model in R is a method to analyze and forecast data that changes over time. R provides functions like arima() and auto.arima() from the forecast package to model time series data. These functions help fit the model to historical data and predict future values based on patterns in the series.
Time series analysis is the process of examining data points collected in time order to understand trends, seasonal patterns or behaviors. It helps predict future values based on past observations. Common examples include analyzing stock prices, weather data and monthly sales.
The ARIMA (AutoRegressive Integrated Moving Average) model is a widely used statistical technique for forecasting time series data. It combines three components to model patterns in the data and generate accurate predictions. It is represented as ARIMA(p, d, q), where:
We forecast the next 10 values from the BJsales dataset using the ARIMA model in R.
We install the forecast package to access functions for time series forecasting.
We load the forecast library to apply ARIMA and forecast-related functions.
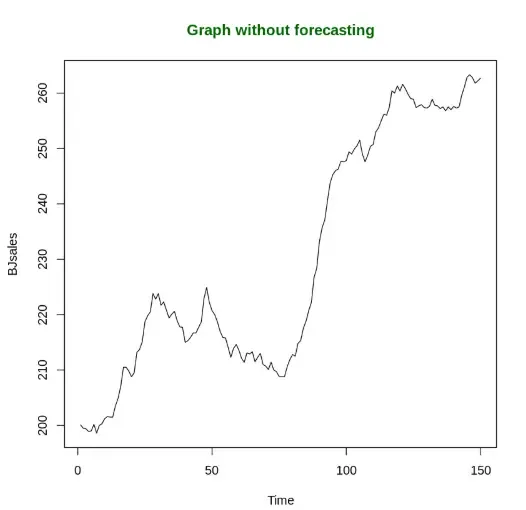
We plot the original BJsales time series data without any forecasting.
Output:
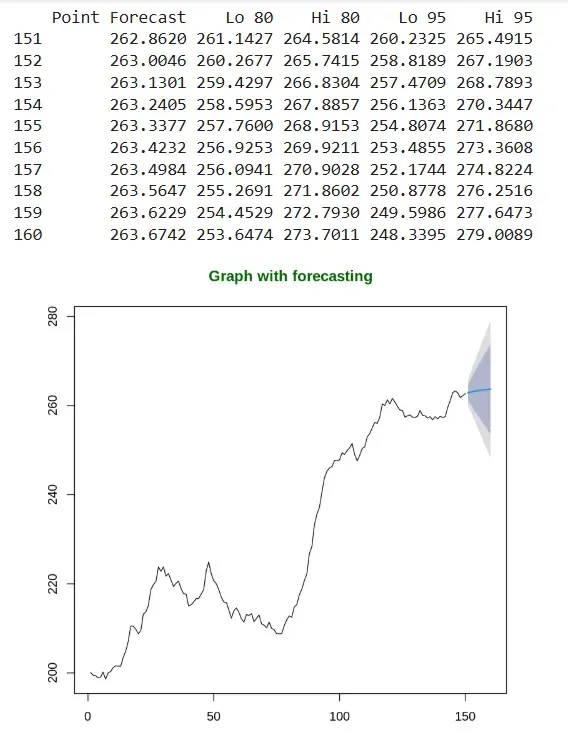
We apply auto.arima() to the BJsales data and forecast the next 10 values.
Output:
The output displays the next 10 forecasted sales values from the ARIMA model along with 80% and 95% confidence intervals. The plot visualizes these forecasts, showing the projected trend and uncertainty bands over time.
You can download the source code from here.