 |
VOOZH | about |
|
VOOZH | about |
Local regression is also known as LOESS (locally estimated scatterplot smoothing) regression. It is a flexible non-parametric method for fitting regression models to data. Local regression models adapt to the local structure of the data and make them particularly useful for analyzing complex relationships and non-linear patterns.
We implement the LOESS (Locally Estimated Scatterplot Smoothing) technique in R to model non-linear relationships through a step-by-step approach.
We install the essential packages for visualization and data manipulation using install.packages() and load them with library().
We import the dataset, remove missing values, and handle outliers to ensure clean and structured input for the regression.
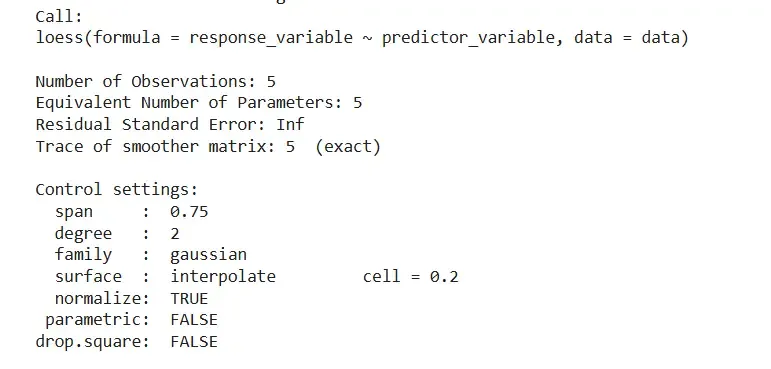
We fit the LOESS model using the loess() function with specified formula and dataset.
Output:
We visualize the original data points and the fitted LOESS curve using ggplot2.
Output:
The plot shows a smooth, non-linear LOESS curve fitted to a small dataset, closely following the five data points using a quadratic polynomial. Despite the limited data, the model effectively captures the underlying trend through localized interpolation.