 |
VOOZH | about |
|
VOOZH | about |
The goal of a typical network traffic analysis project is to monitor, analyze, and visualize data flow across a network. This helps in identifying patterns and trends, detecting security threats, and making informed decisions about network infrastructure.
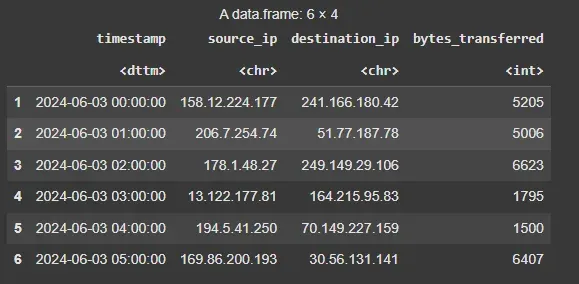
We begin by generating a synthetic dataset that will allow us to explore network traffic patterns. Here’s how we can generate the synthetic data. We are generating synthetic data including timestamps, random IPv4 addresses and bytes transferred. This data is stored in a dataframe for easy analysis. Here,
Output:
We will plot various visualization for analyzing our data.
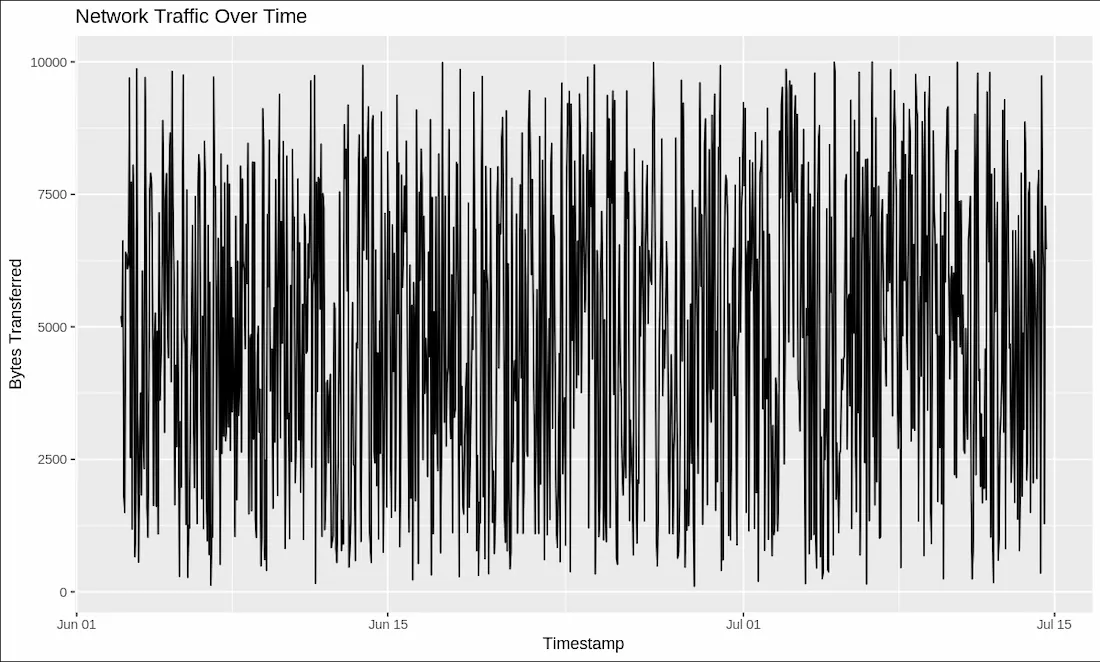
We are plotting the total bytes transferred over time to understand how network traffic changes at different intervals.
Output:
From the time series plot, we can analyze traffic patterns, peak hours and anomalies that might indicate unusual activity or congestion.
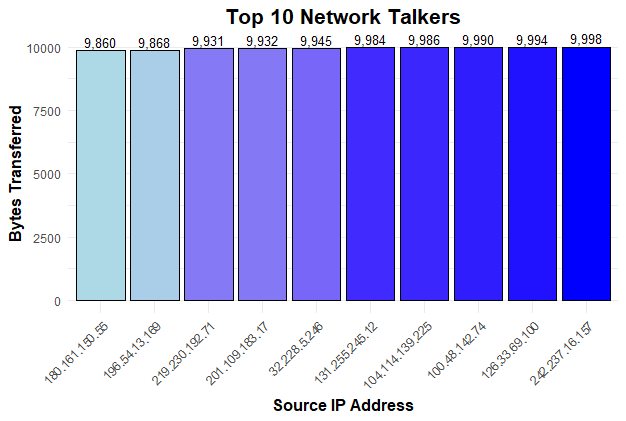
Next, we identify the "top talkers" by aggregating the data based on source IPs to find which devices are responsible for the most traffic.
Output:
The bar plot of top talkers helps us pinpoint which devices are using the most bandwidth. This information is important for identifying potential network congestion or suspicious activity from specific devices.
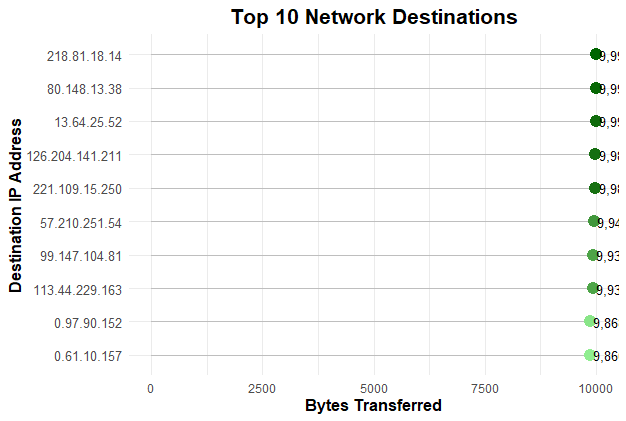
We analyze the distribution of bytes transferred based on destination IP addresses to identify which resources are most accessed.
Output:
The lollipop chart highlights which destinations are receiving the most traffic. This insight is useful for identifying heavily accessed resources, potential bottlenecks or areas requiring optimization.
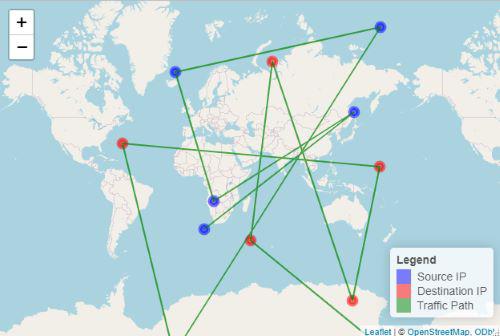
Visualizing network traffic geographically can provide insights into the regions generating or receiving traffic. This can be particularly useful for detecting unusual traffic patterns from specific locations.
Output:
The map allows us to visually explore the geographical distribution of network traffic. By observing the locations of source and destination IP addresses, we can identify traffic sources and destinations from specific regions, potentially highlighting abnormal activity.
Through the visualizations discussed in this article, we identified the following insights into network traffic patterns:
These insights contribute to better network management, enhanced security, and more effective decision-making.