 |
VOOZH | about |
|
VOOZH | about |
Stock price prediction is a challenging task in the field of finance with applications ranging from personal investment strategies to algorithmic trading. In this article we will explore how to build a stock price prediction model using TensorFlow and Long Short-Term Memory (LSTM) networks a type of recurrent neural network (RNN) which is well-suited for Timeseries data like stock prices.
Below is the step by step implementation:
In this article we will import Pandas, Numpy, Matplotlib, Seaborn and TensorFlow.
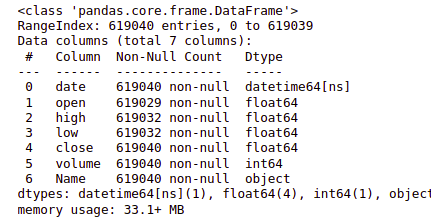
We will load the dataset containing stock prices over a 5-year period. The read_csv function loads the dataset into a pandas DataFrame for further analysis. You can download dataset from here.
delimiter=',': Specifies that commas separate values in the CSV file.on_bad_lines='skip': Skips any malformed lines in the CSV file.Output:
Since the given data consists of a date feature, this is more likely to be an 'object' data type.
Output:
Whenever we deal with the date or time feature, it should always be in the DateTime data type. Pandas library helps us convert the object date feature to the DateTime data type.
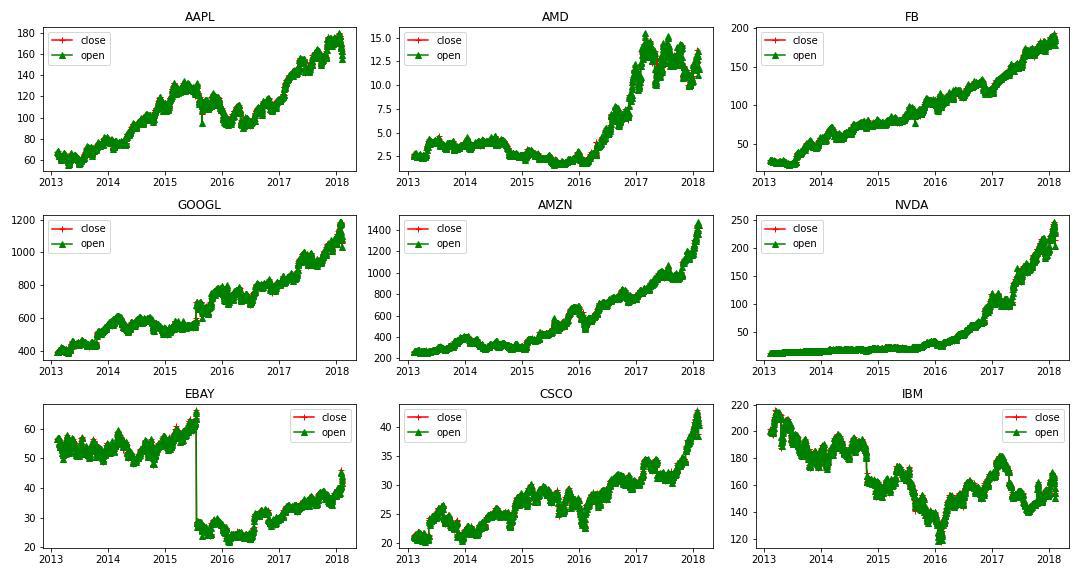
Exploratory Data Analysis is a technique that is used to analyze the data through visualization and manipulation. For this project let us visualize the data of famous companies such as Nvidia, Google, Apple, Facebook and so on. First let us consider a few companies and visualize the distribution of open and closed Stock prices through 5 years.
Output:
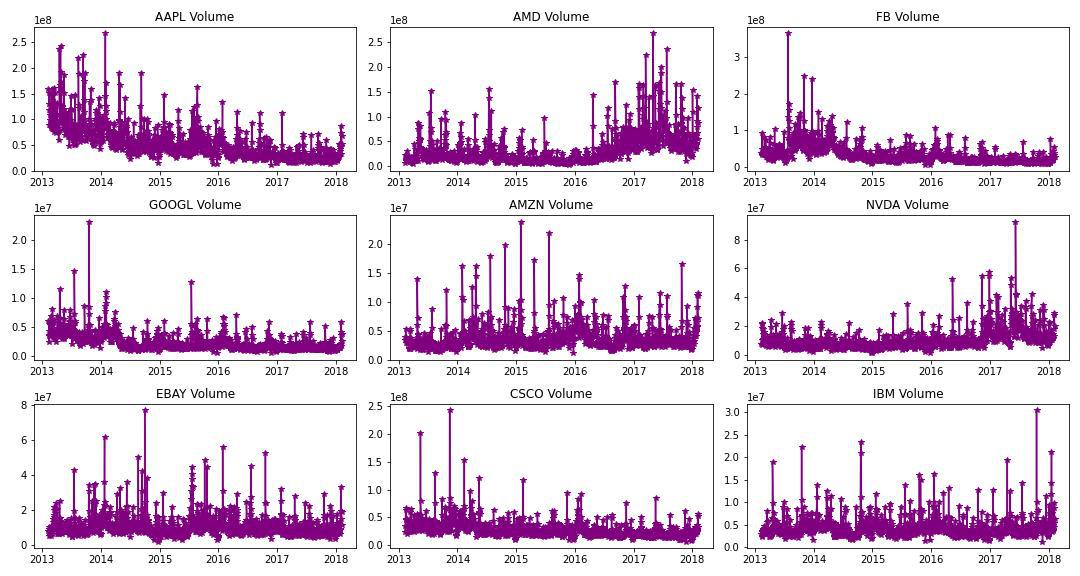
Now let's plot the volume of trade for these 9 stocks as well as a function of time.
Output:
Now let's analyze the data for Apple Stocks from 2013 to 2018.
Output:
Now let's select a subset of the whole data as the training data so that we will be left with a subset of the data for the validation part as well.
Output:
1197
Now we have the training data length, next applying scaling and preparing features and labels that are x_train and y_train.
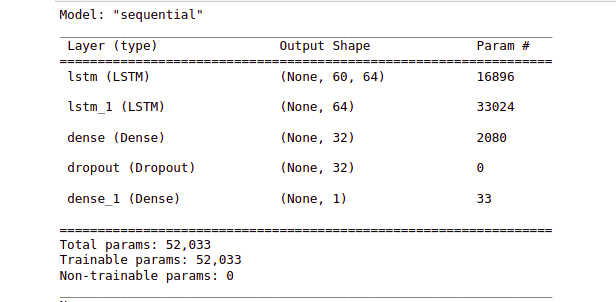
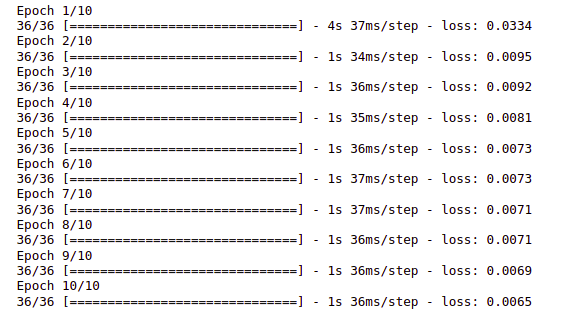
Using TensorFlow, we can easily create LSTM models. It is used in Recurrent Neural Networks for sequence models and time series data. It is used to avoid the vanishing gradient issue which is widely occurred in training RNN. To stack multiple LSTM in TensorFlow it is mandatory to use return_sequences = True. Since our data is time series varying we apply no activation to the output layer and it remains as 1 node.
Output:
While compiling a model we provide these three essential parameters:
Output:
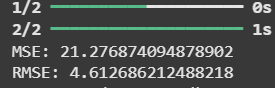
For predicting we require testing data, so we first create the testing data and then proceed with the model prediction.
Output:
Now that we have predicted the testing data, let us visualize the final results.
Output:
The chart shows Apple’s stock closing price over time with the "Train" data representing historical prices used for model training, "Test" data for evaluation and "Predictions" showing the model’s forecasted values. It visually demonstrates how well the model’s predictions align with actual stock prices highlighting areas of accurate forecasting and divergence.
You can download the source code from here: click here.