 |
VOOZH | about |
|
VOOZH | about |
Tableau is a data visualization tool that can be used by data analysts, scientists, statisticians, etc. to visualize the data and get a clear opinion based on the data analysis. Tableau is very famous as it can take in data and produce the required data visualization output in a very short time.
An area chart represents the change in one or more quantities over time. It is made by plotting a series of data points over time, connecting those data points with line segments and then filling in the area between the line and the x-axis with color or shading.
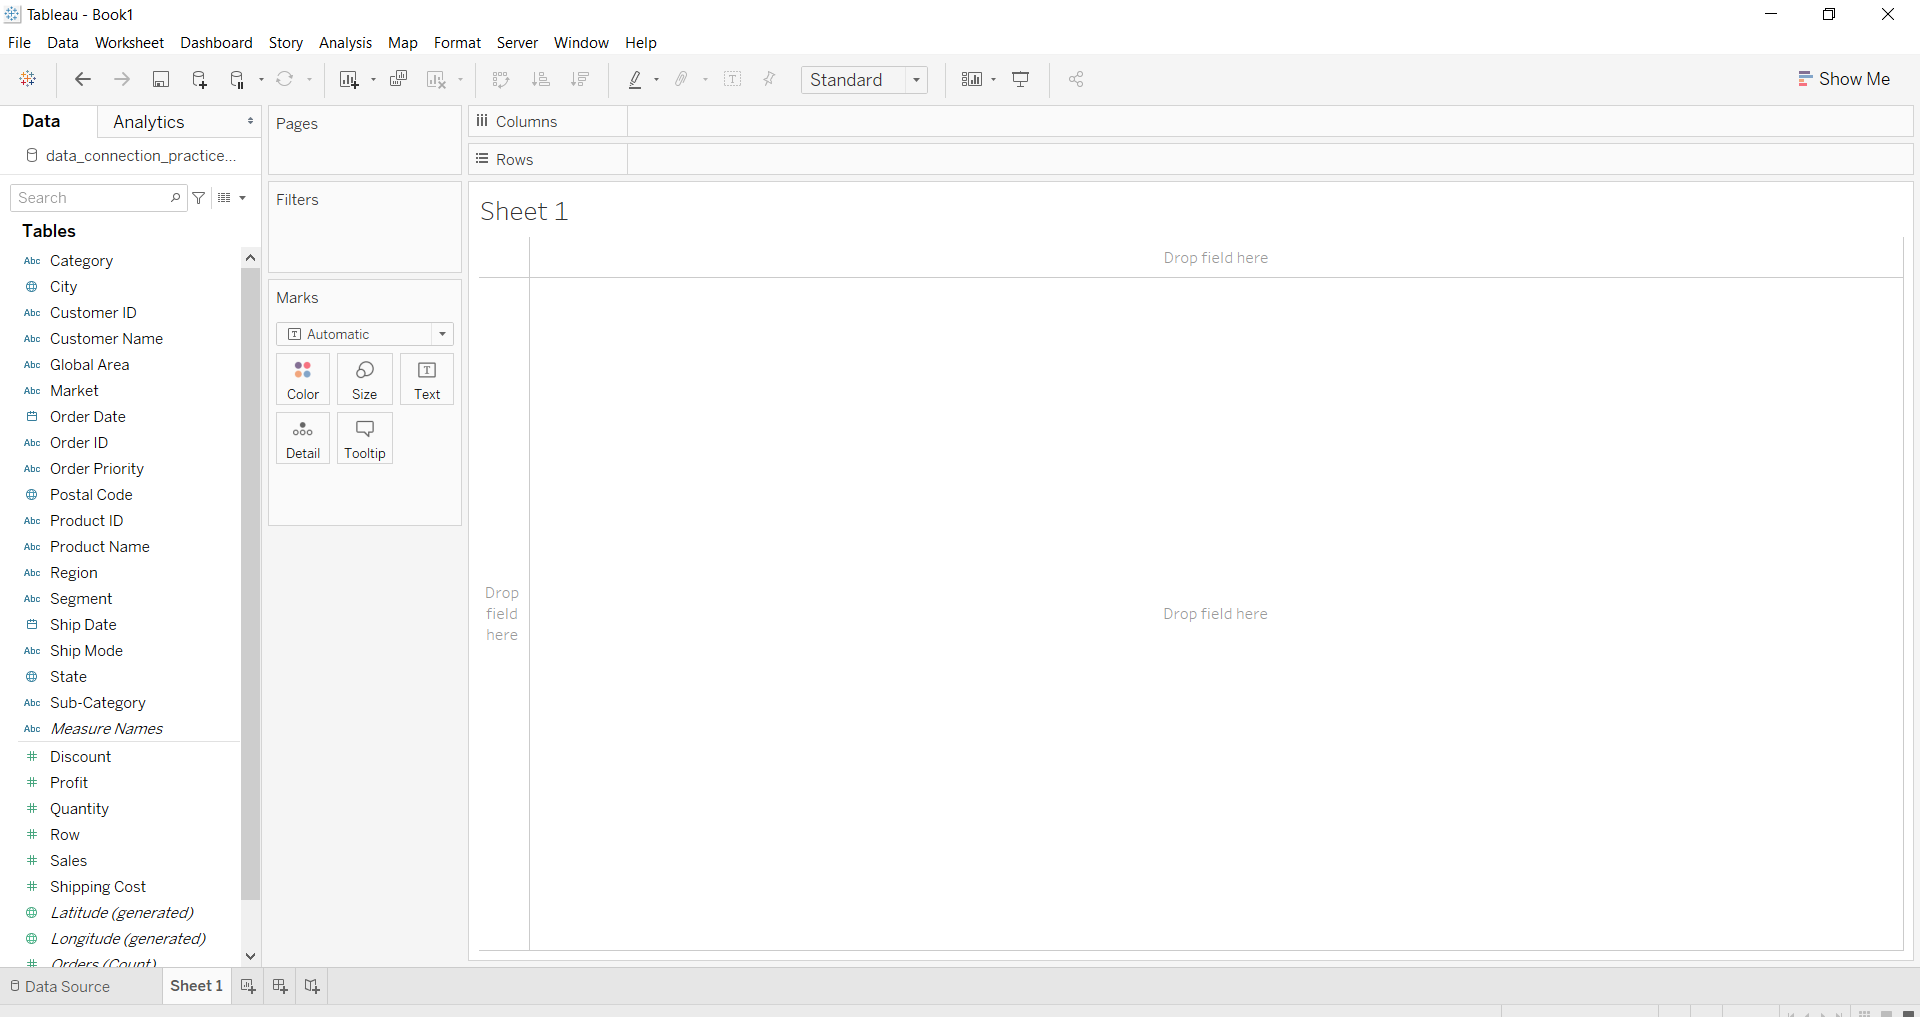
For this, we have to open the worksheet first. Follow the steps below and open the worksheet :
To draw an area chart you have to select minimum two attributes( one in row and one in column) by dragging and dropping. Then select the chart option as Area.
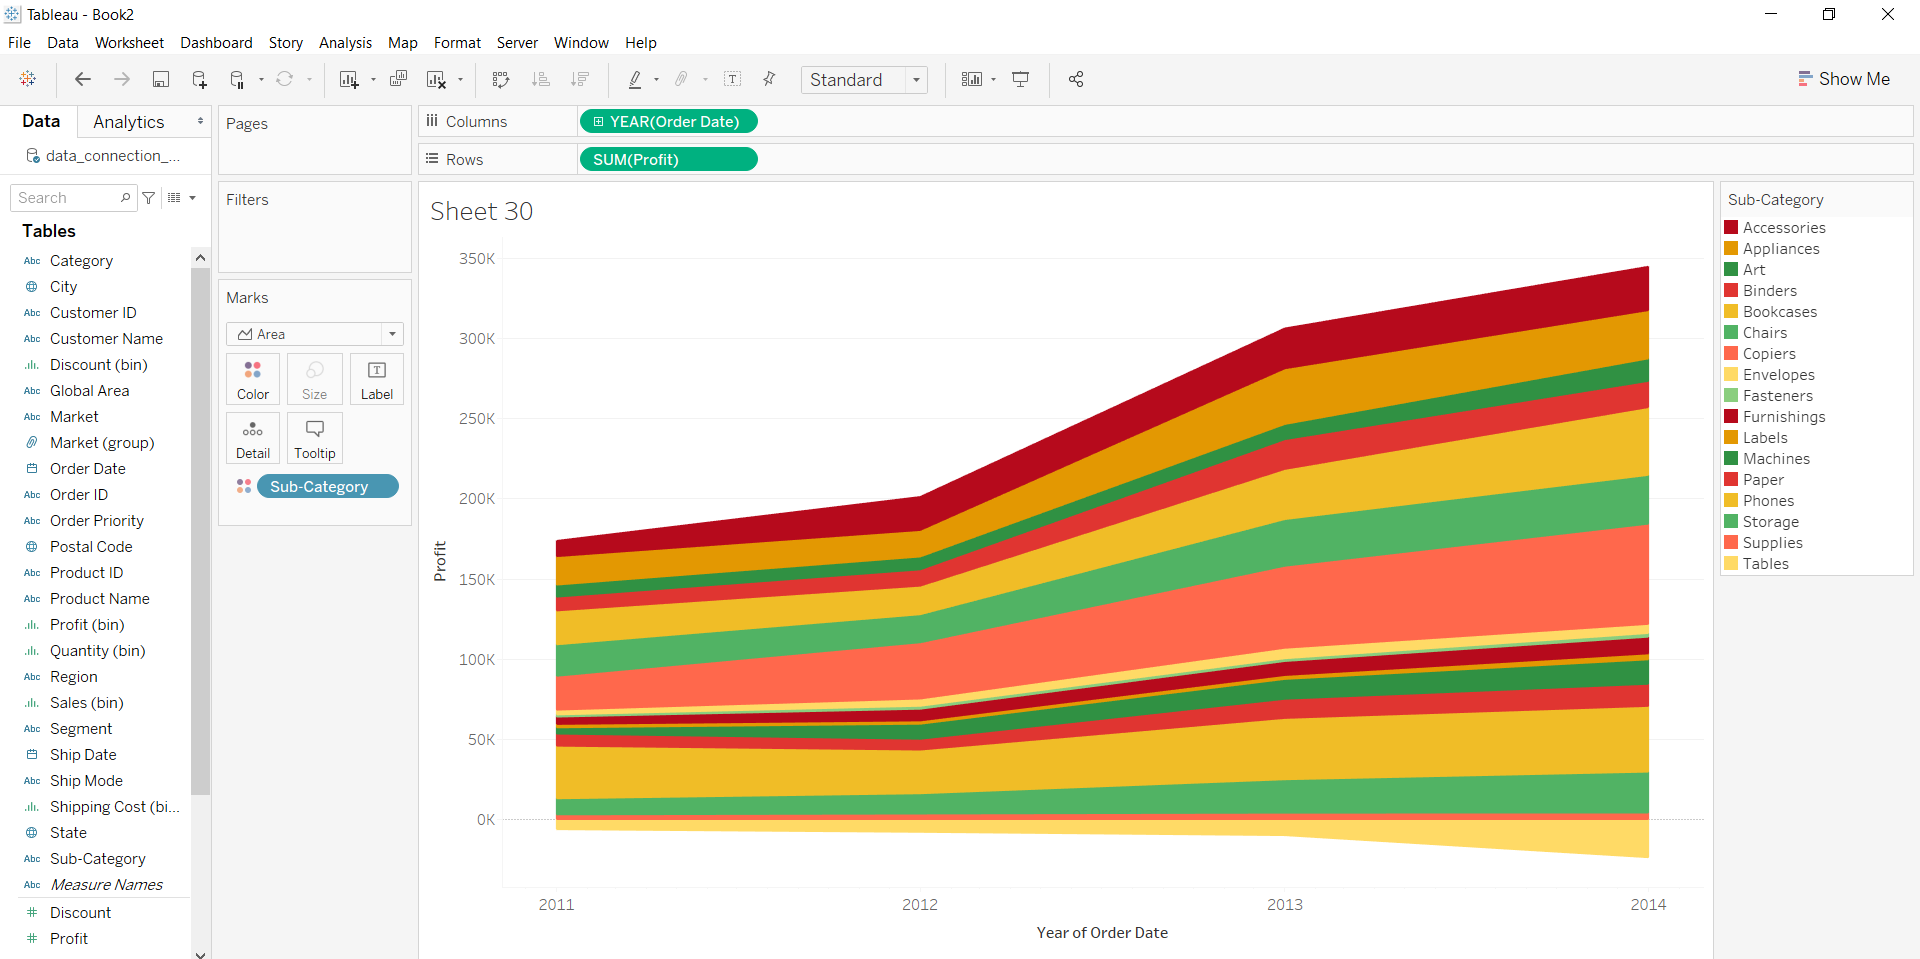
Example 1:
👁 ImageExample 2:
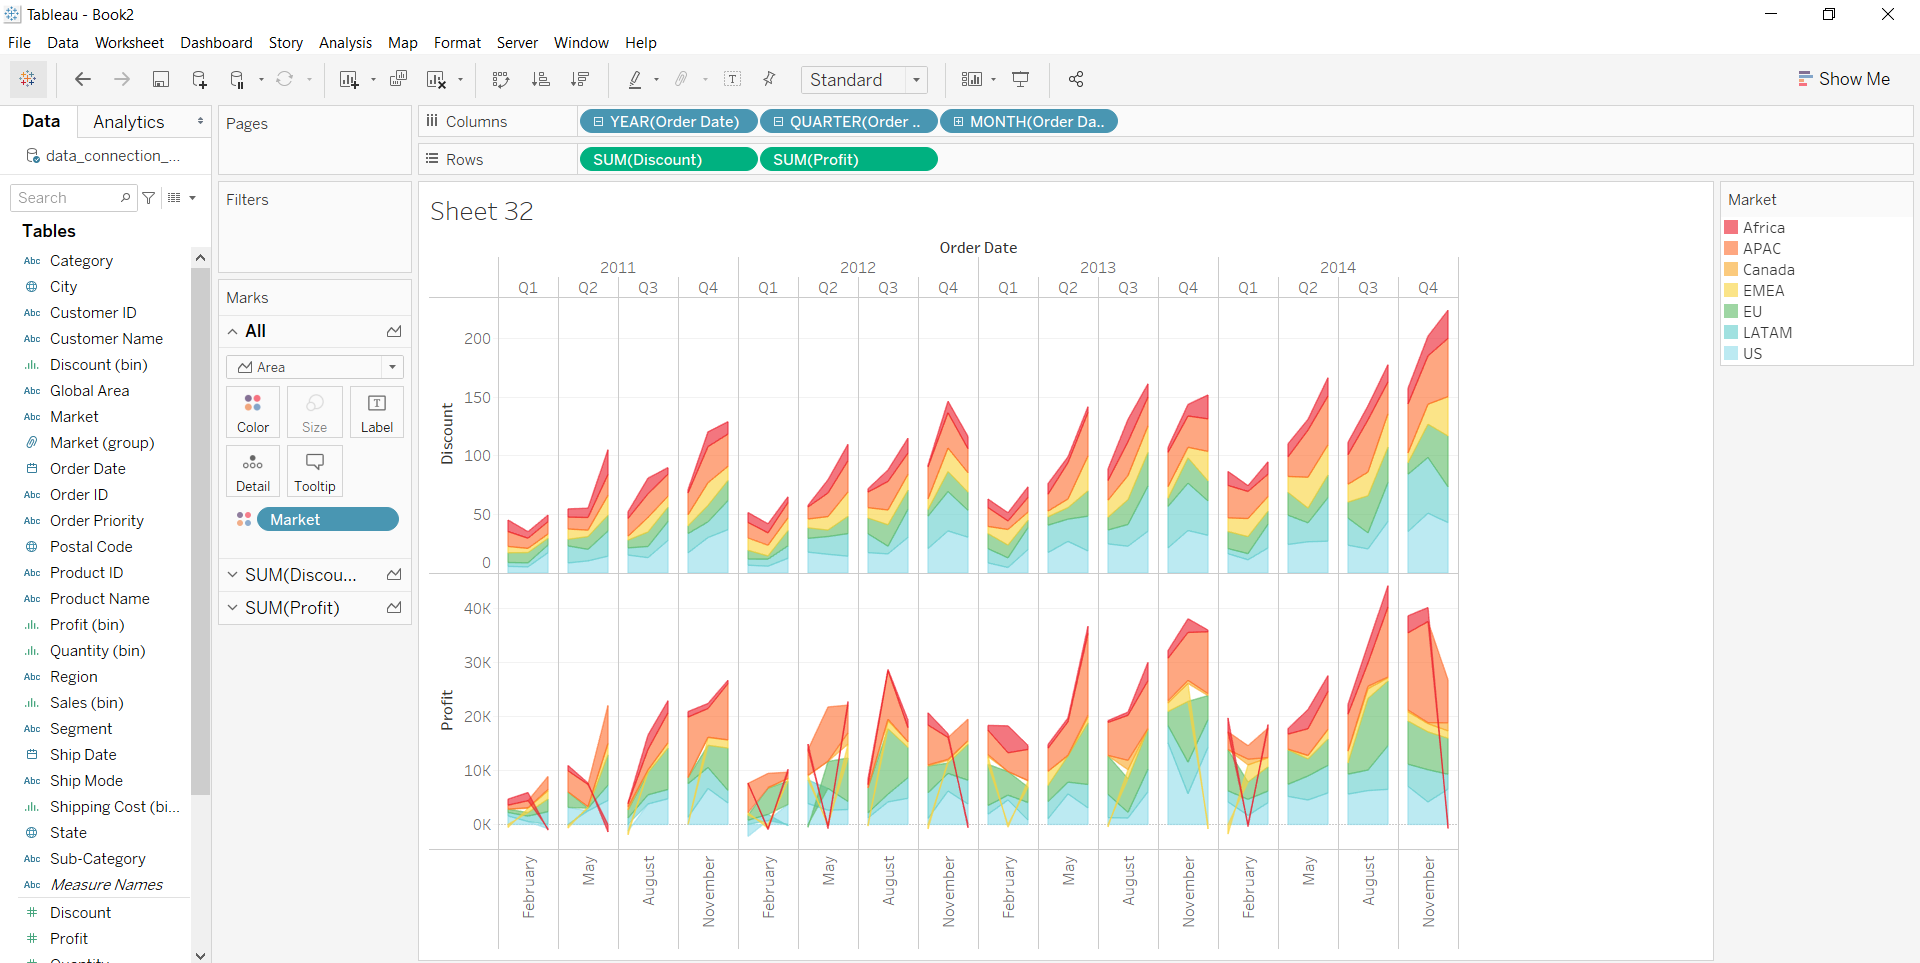
Example 3: