 |
VOOZH | about |
|
VOOZH | about |
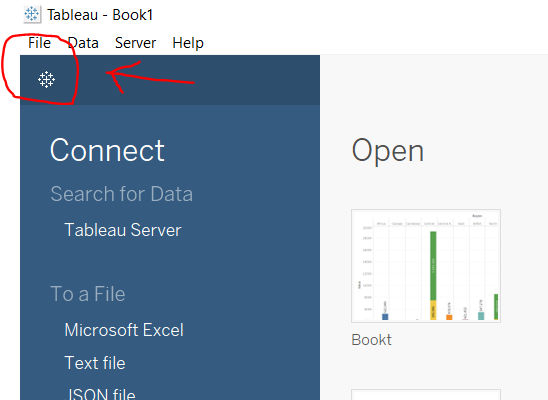
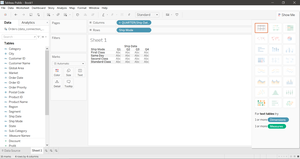
In this article, we will see Show Me option and features associated with it in Tableau.
Steps to generate various illustrations from Show Me window in Tableau:
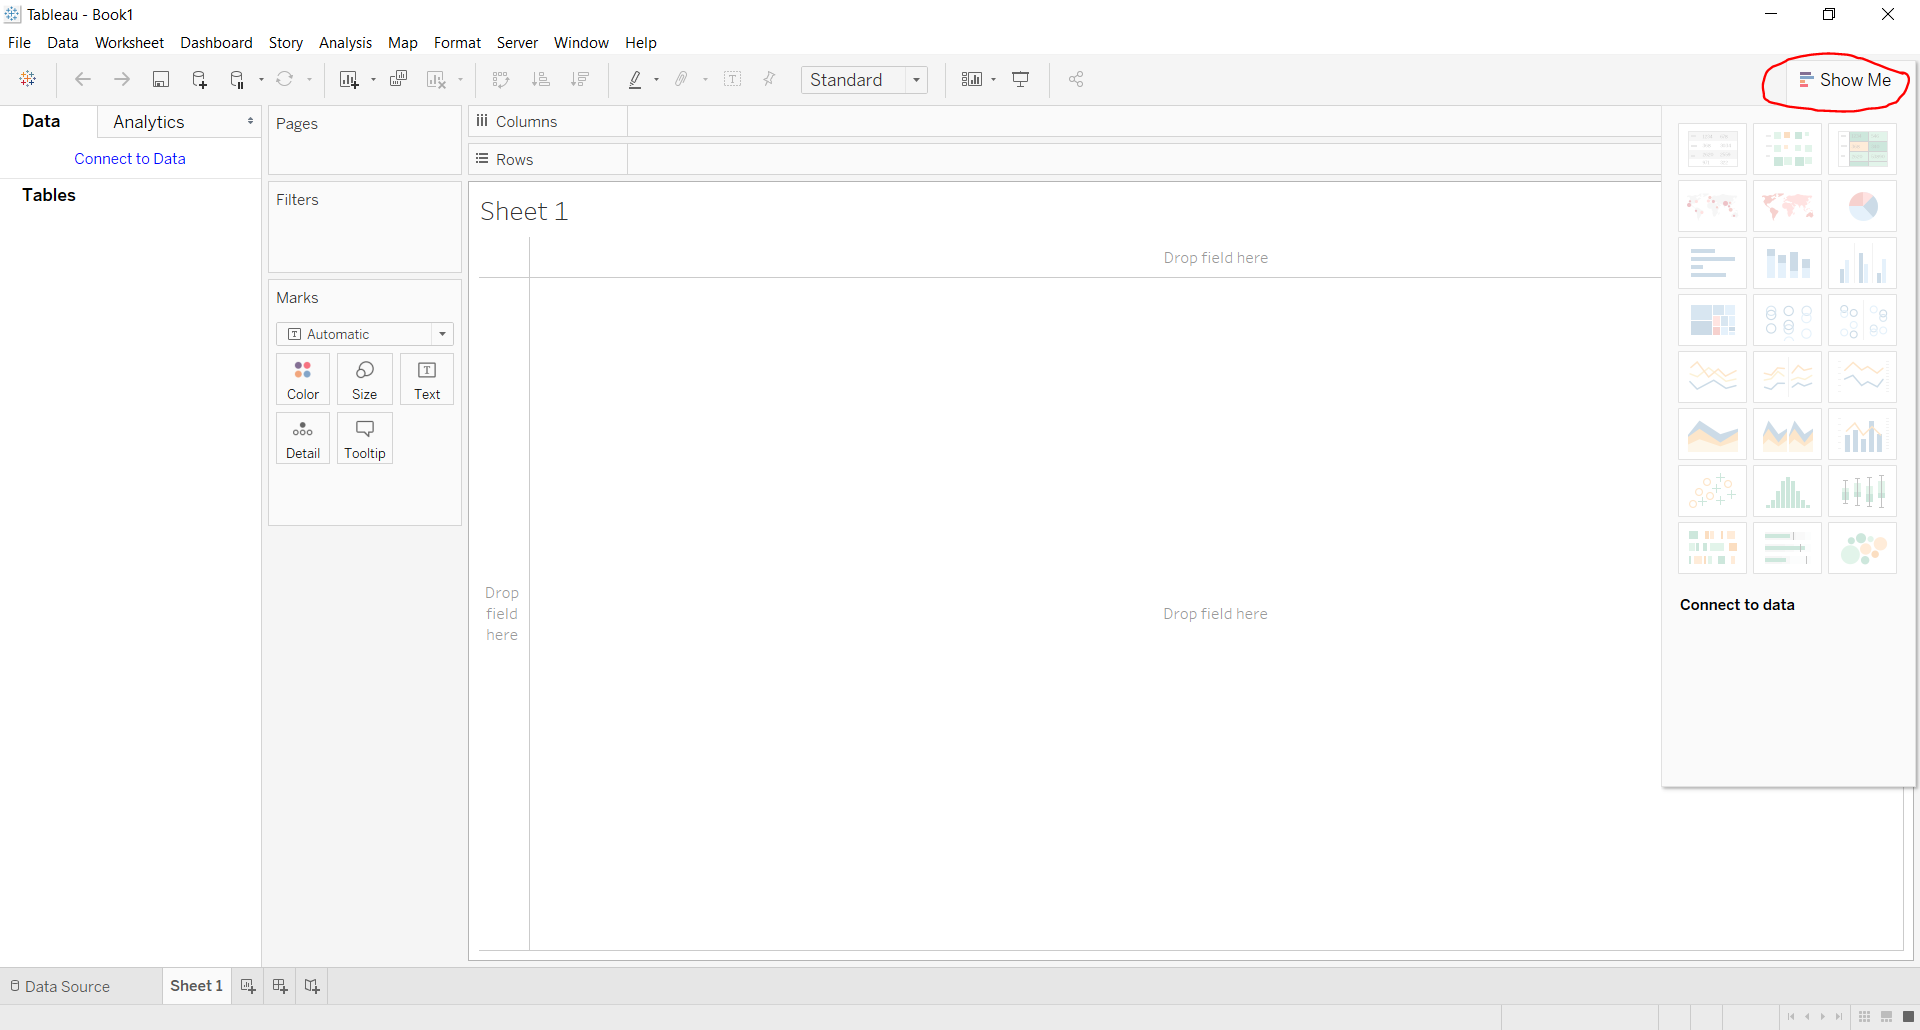
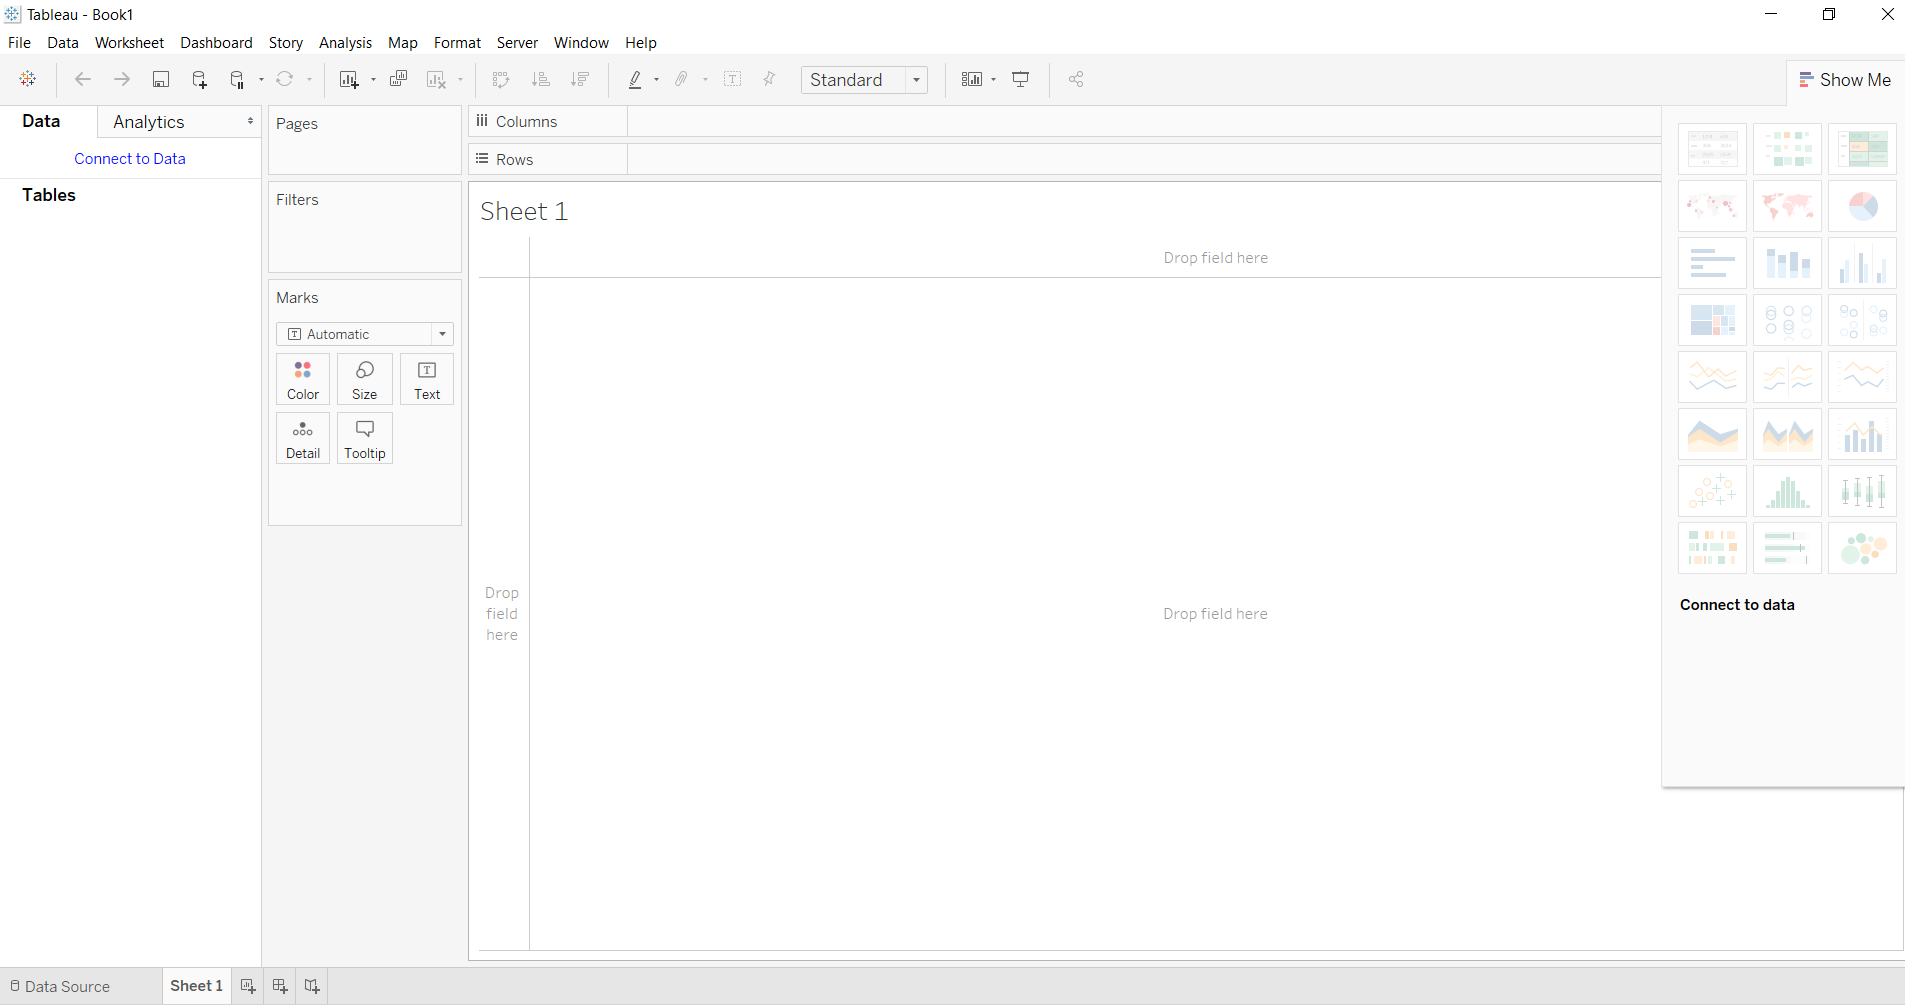
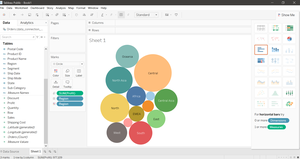
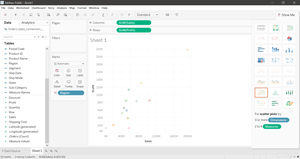
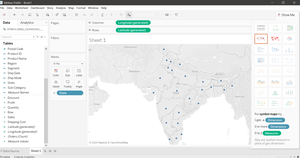
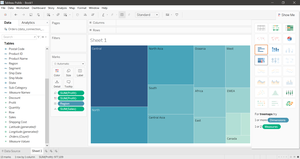
Here you will get different types of charts and graphs listed below:
| Text Label | Symbol Maps | Horizontal Bars | Tree Map |
| Heat Map | Maps | Stacked Bars | Circle Views |
| Highlight Table | Pie Charts | Side-by-Side Bars | Side-by-Side Circle Views |
| Line Chart | Discrete Lines | Dual Lines | Area Chart |
| Discrete Area Chart | Dual Combination Chart | Scatter Plot | Histograms |
| Box and Whisker Plots | Gantt Chart | Bullet Graph | Packed Bubbles Chart |
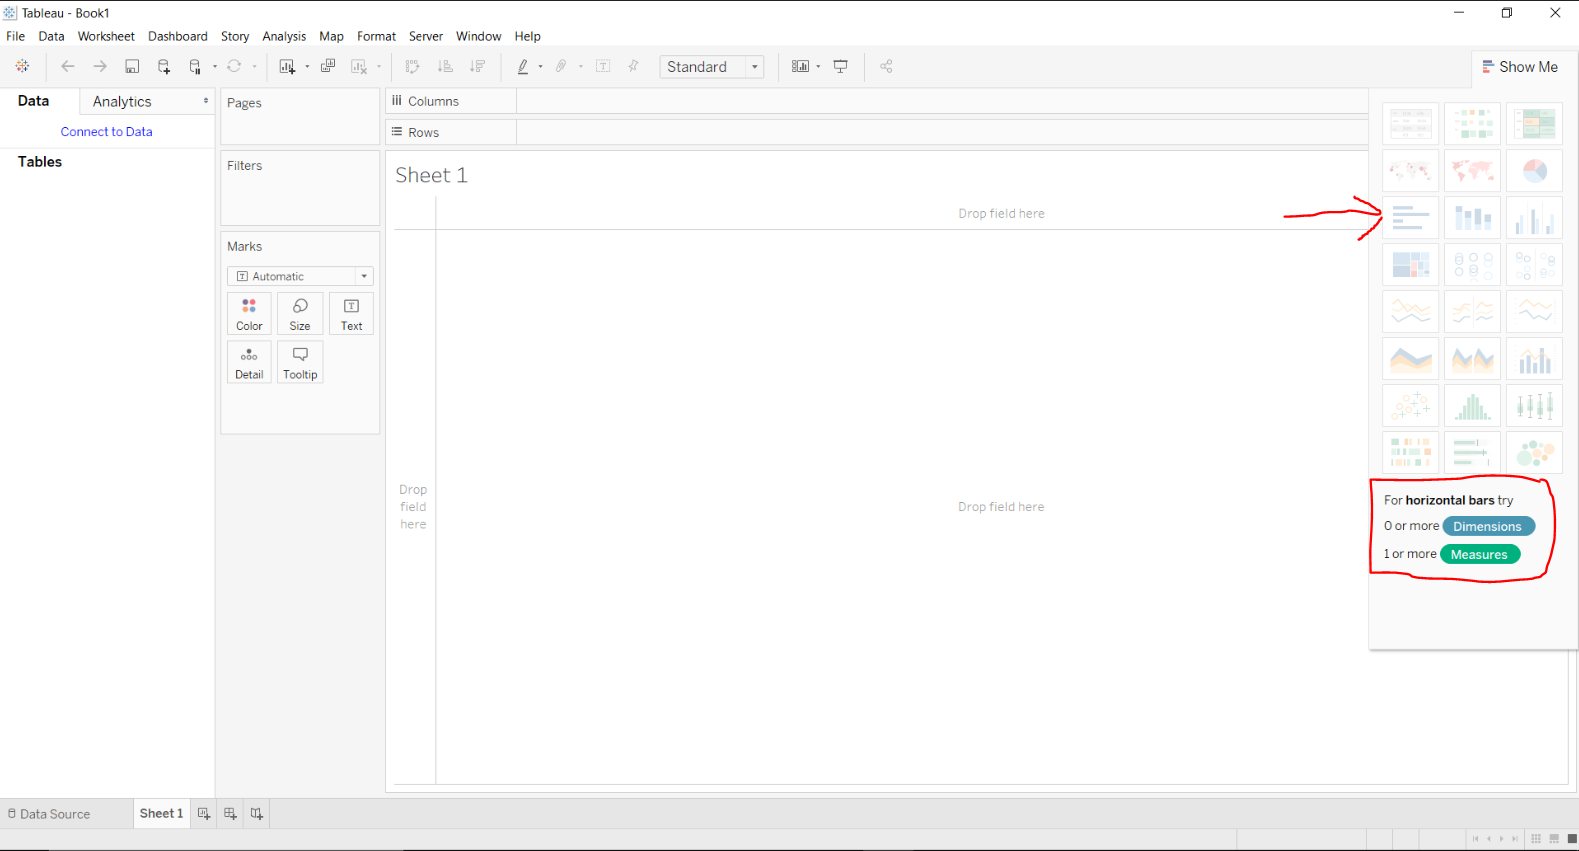
To use different graphs and charts one should follow some steps:
In this way, one can use any feature of Show Me option in Tableau.
Below are some illustrations which can be generated from the Show Me window: