Tableau is highly versatile and can connect to a variety of data sources including flat files like Excel and CSV, databases such as SQL Server, Oracle and MySQL and cloud platforms like Google BigQuery, Snowflake and AWS. To understand its flexibility:
Multiple Sources: Supports files, databases and cloud platforms
Local and Cloud Access: Works with data stored on computers, servers or cloud systems
Easy Integration Allows users to bring data from different environments seamlessly
Steps to Connect a Data Source
Let's see the steps that need to be followed to connect a data source.
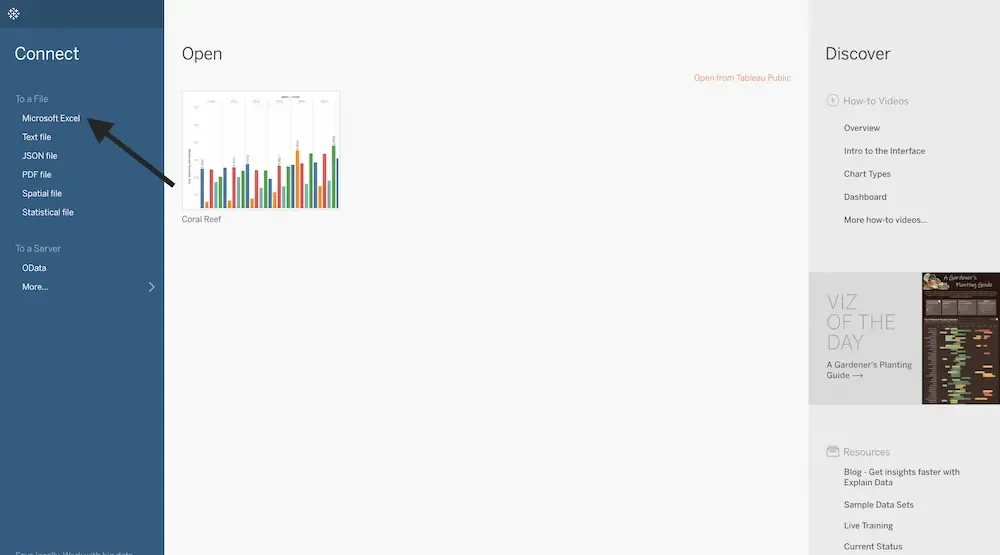
Step 1: Open Tableau
Launch Tableau Desktop. On the left hand side of the start screen, we will see the Connect Panel.
Step 2: Select a Data Source
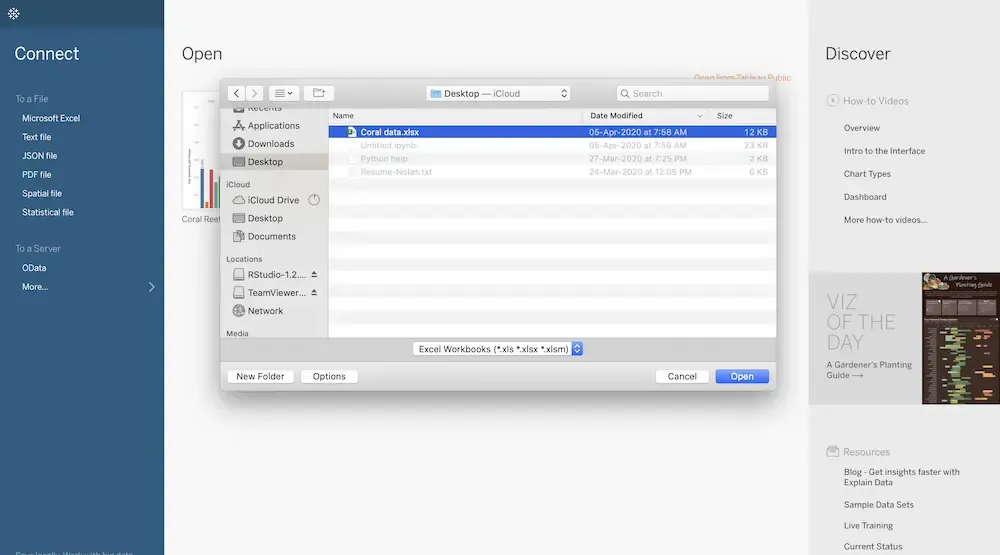
Under the File section in the Connect Panel, choose the type of data file we want to connect with. For example, to connect to an Excel file, click on Microsoft Excel.
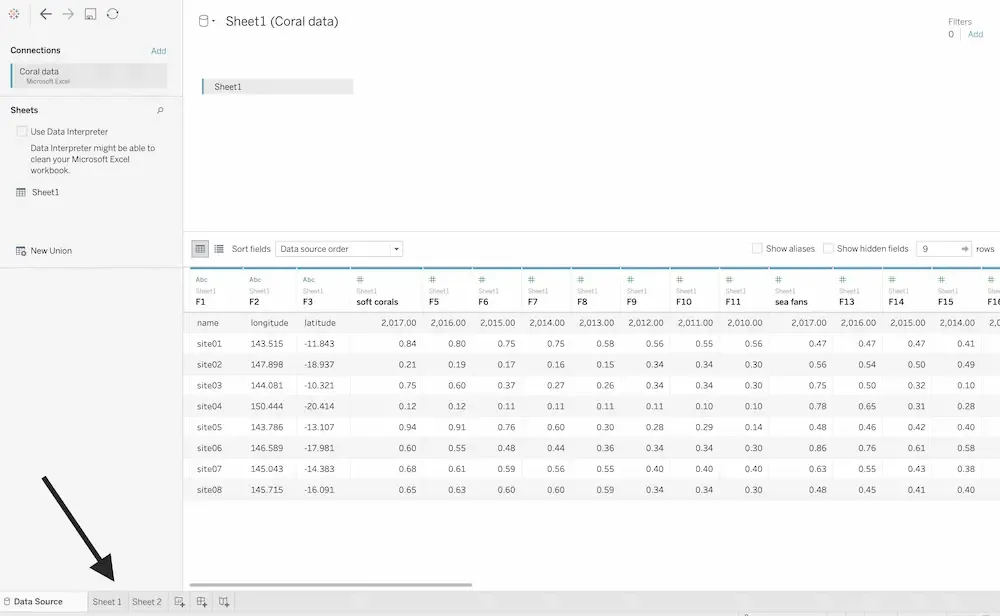
After selecting, Tableau creates a connection with the file and displays our dataset at the bottom of the screen. We can preview the tables, fields and structure of our data.
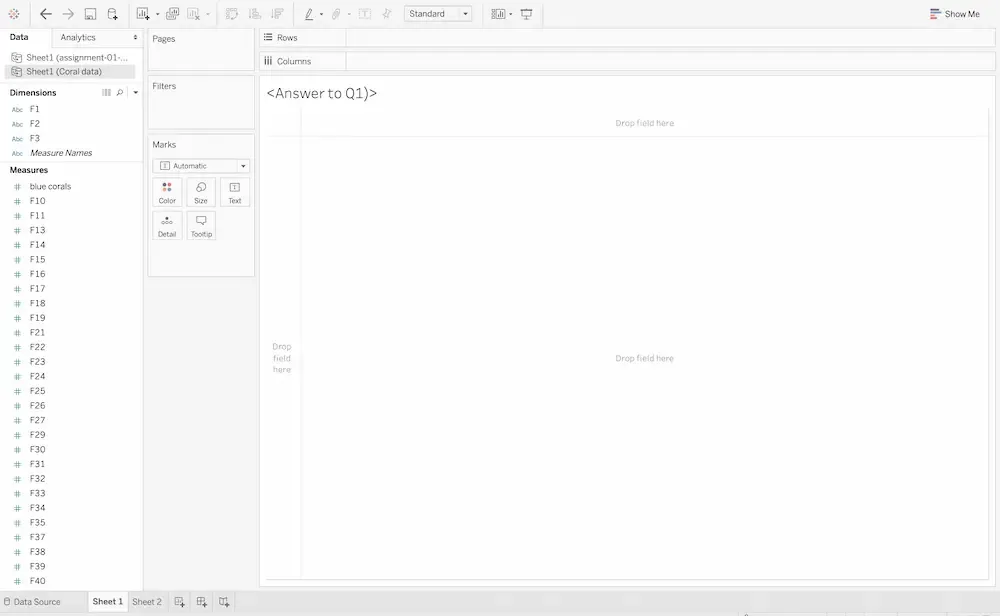
Once the data connection is set up, click on Worksheet to begin analysis. This is where we can start preparing, cleaning (wrangling) and exploring our data.
