 |
VOOZH | about |
|
VOOZH | about |
In this article we will learn how to form a crosstab in tableau worksheet to do further operations. For this first look into two terms :
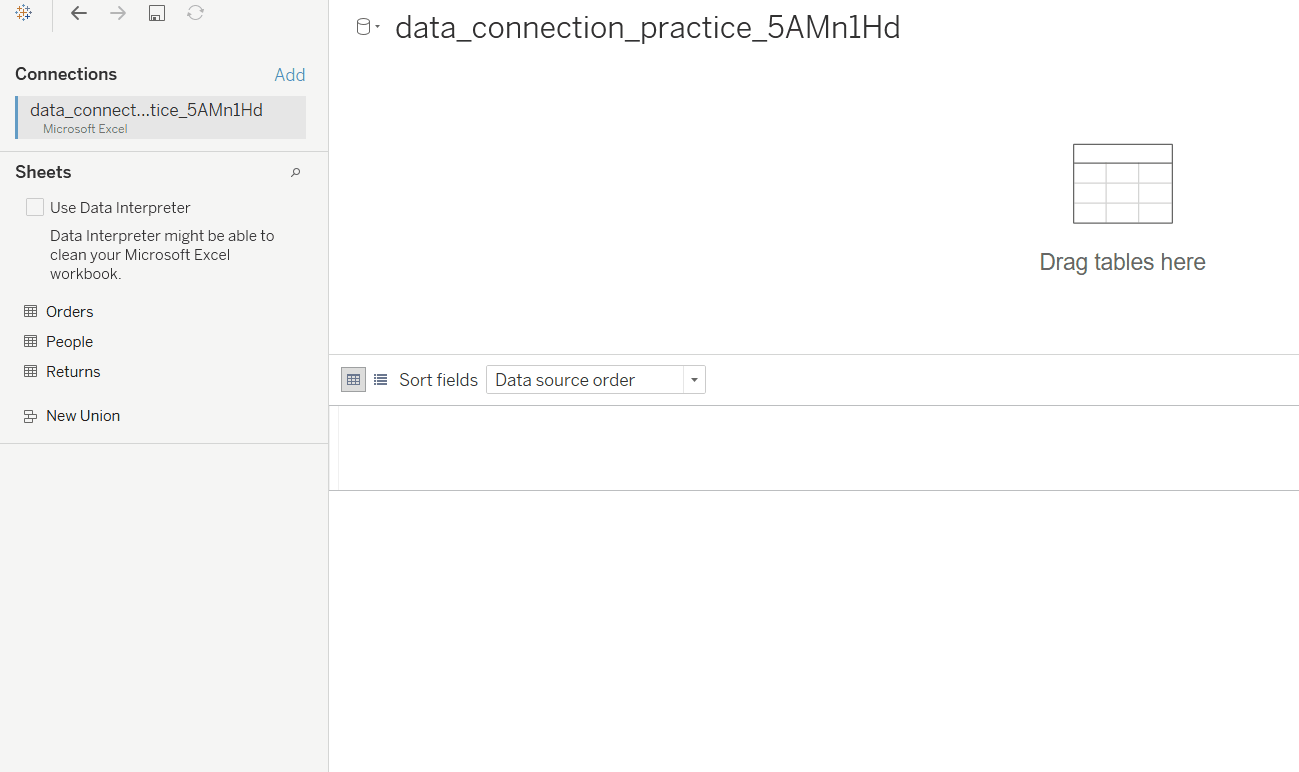
1) Open Tableau tool and connect a dataset into it.
👁 Image2) Drag and drop the one sheet of connected dataset.
👁 Image3) Click on sheet1 to open the tableau worksheet.
👁 Image4) On clicking Sheet1 you will get whole dataset attributes on left side and a worksheet for work.
👁 Image5) To draw a crosstab you have to select minimum two attributes( one in row and one in column) by drag and drop then select another attribute for mark option.
👁 ImageExample 1:
This example is drawn similar to the above steps with some extra marks and which is explained in steps given below :
Example 2:
This example is also drawn similar to above example 1 with some extra marks and which is explained in steps given below :