A dashboard in Tableau is a collection of multiple visualizations in a single view. It allows users to compare and analyze different aspects of data without switching between worksheets. To understand its use more clearly:
Multiple Visuals : Combines different charts in one place Interactive : Filters and parameters update all visuals together Better Analysis : Helps compare data easily Business Use : Used to track KPIs, performance and trends Steps to Create a Dashboard Let's see the steps to create a dashboard:
Step 1: Open Tableau Desktop / Public Launch Tableau and we will land on the Start Page.
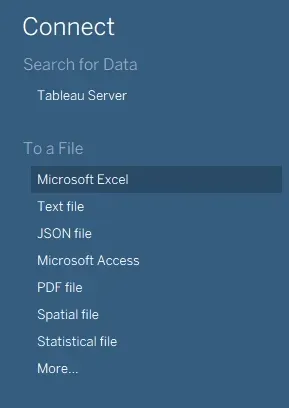
👁 Screenshot-2025-07-23-131229 Data Sources Step 2: Locate the Connect Menu On the left-hand panel, we can see various data sources to connect. We can see options and Sample Workbooks too which can be used to access the inbuilt data sources. Tableau comes with preloaded datasets that can be directly used. Step 3: Choose Database Here we will be using inbuilt data source for illustration,
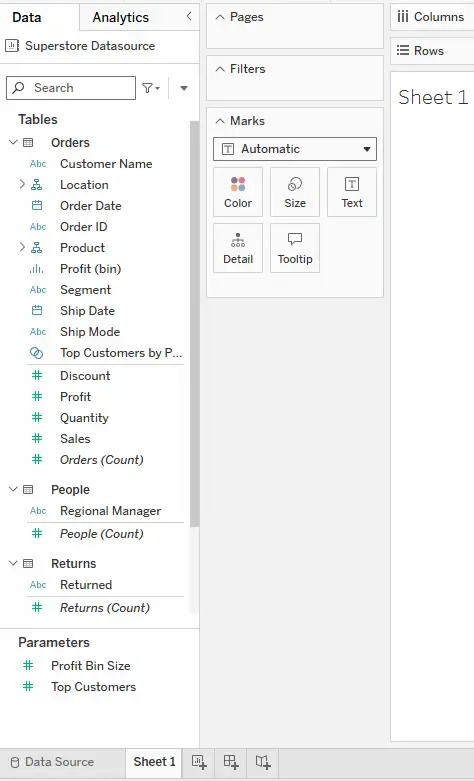
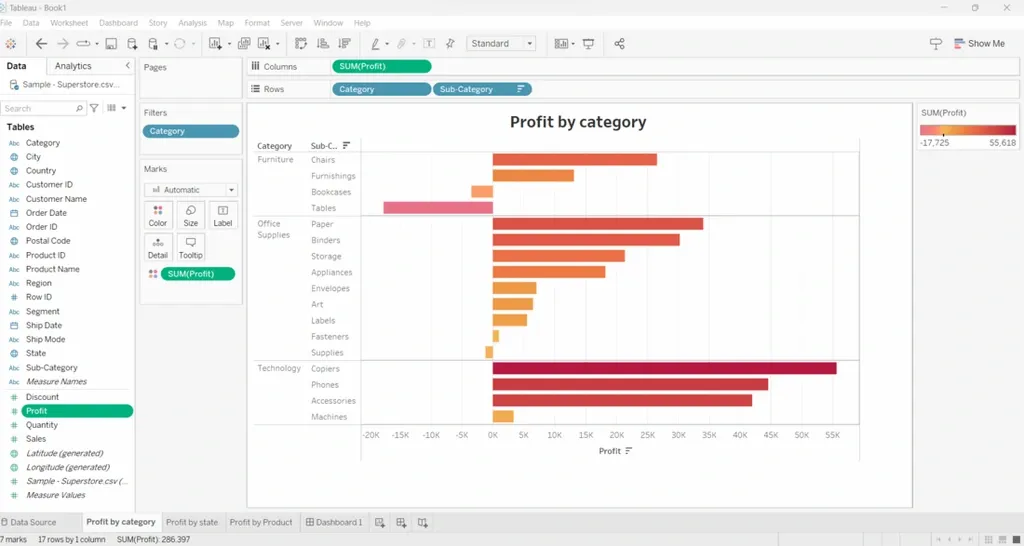
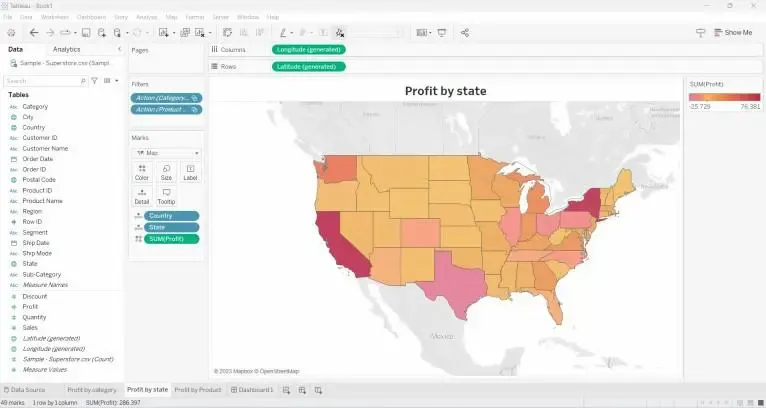
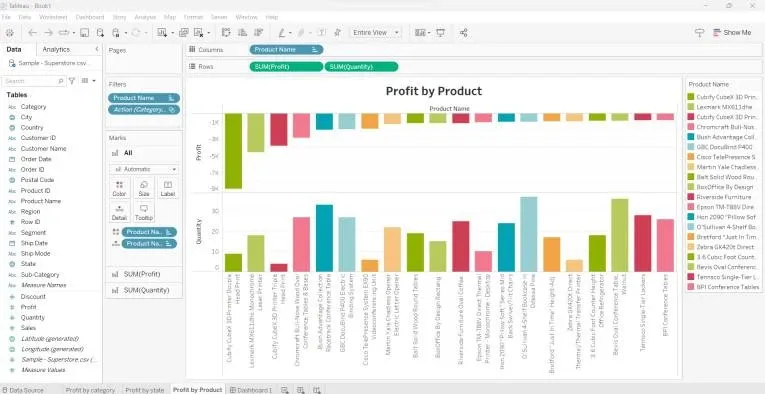
Select a dataset like Sample: Superstore, World Indicators or others (depending on our Tableau version). Click to open → Tableau will automatically load the data into the workbook. Step 4: Open a Worksheet Click Sheet 1 to start building a visualization. 👁 Screenshot-2025-09-10-113825 Sheet On the left side, we’ll see dataset attributes (dimensions & measures) that we can use to create views. 👁 Screenshot-2025-09-10-114043 Attributes Step 5: Create Sheet 1 of Profit by Category Drag Category and Sub-Category to Rows and Profit to Columns. From the Show Me panel, choose a suitable visualization (e.g., bar chart). Drag Profit to Color for better representation. 👁 sheet-1-1024 Sheet 1 Step 6: Create Sheet 2 of Profit by State Drag State and Country to the view. Place Longitude on Columns and Latitude on Rows to create a map. Add Profit to Color. Tableau will generate a map visualization. 👁 sheet-II Sheet 2 Step 7: Create Sheet 3 of Profit by Product Name Drag Product Name to Rows and Profit & Quantity to Columns. From Show Me, pick a visualization (e.g., bar chart or tree map). Use Color for additional insights. 👁 sheetIII Sheet 3 Step 8: Build the Dashboard Click the Dashboard tab at the bottom or "New Dashboard" from the dashboard menu.
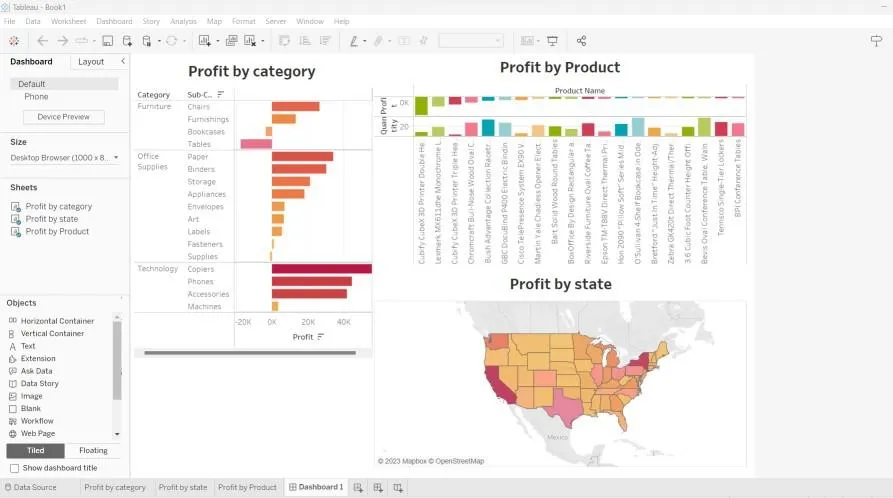
Drag and drop all three sheets into the dashboard area. Adjust the layout according to our needs. Add filters to make the dashboard interactive (e.g., filter by category or region). We can also add text objects, images and highlight actions to make it more user-friendly. 👁 dash1 Dashboard 