 |
VOOZH | about |
|
VOOZH | about |
Conditional Formatting in Tableau is used to highlight specific data values based on defined conditions. It helps users quickly identify top-performing, bottom-performing or exceptional values by applying different colours or visual cues. It is useful for:
Tableau does not have a one-click conditional formatting option like spreadsheets, but the same effect can be achieved using calculated fields, table calculations and colour encoding.
Note: For this article, a sample dataset "vgsales.csv" is used, to download click here.
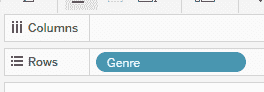
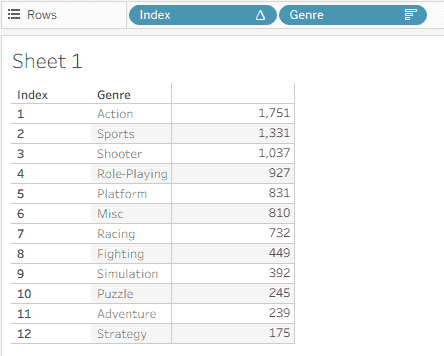
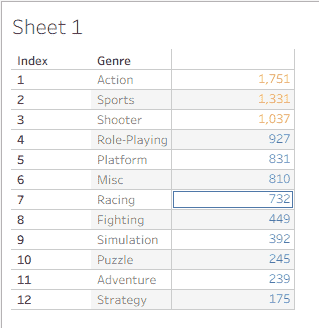
1. Drag and drop the Genre field to the Rows shelf.
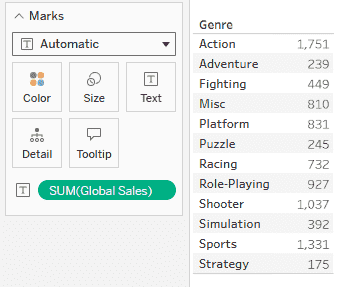
2. Drag and drop Global_Sales to the view so that it appears as the second column in the sheet (Text/Table view).
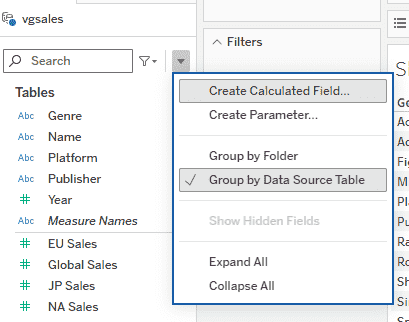
1. In the Data pane, click the drop-down arrow and select Create Calculated Field.
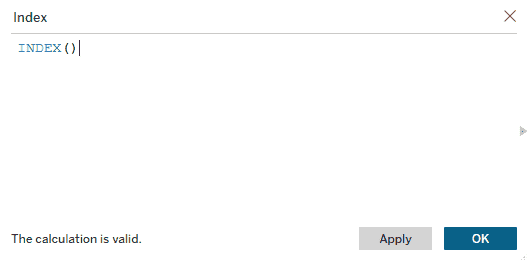
2. Keep the name the field as Index and enter the following formula - INDEX() and Click OK.
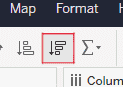
Select the Genre field in the view and click the Sort Descending button from the top toolbar.
This ensures genres are ordered based on Global Sales.
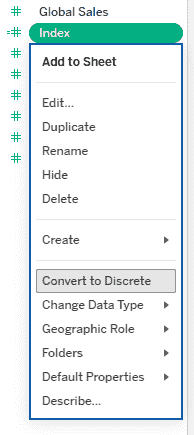
1. Right-click on the Index field and select Convert to Discrete.
2. Drag and drop the Index field to the sheet before the Genre field.
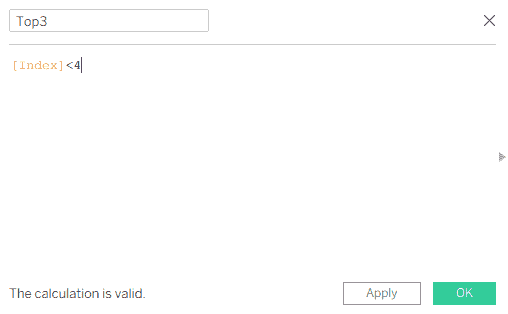
1. Create a new calculated field and name it Top 3. Enter the formula - [Index] < 4 and click OK.
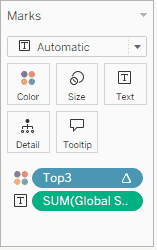
2. Drag and drop the Top 3 field to Color in the Marks card.
3. This highlights the top 3 genres with a different color.
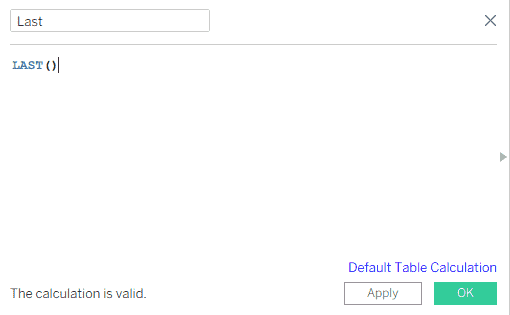
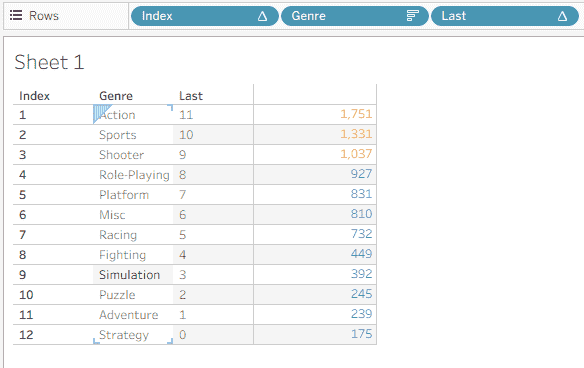
1. Create another calculated field and name it Last. Enter the formula - LAST() and click OK.
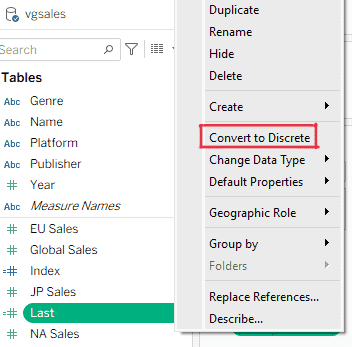
2. Right-click on the Last field and select Convert to Discrete.
3. Drag and drop the Last field to the sheet next to the Genre field.
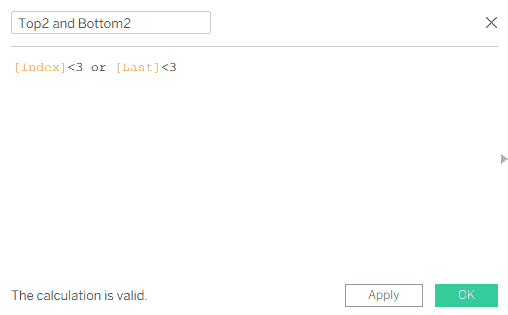
1. Create a new calculated field named Top2 and Bottom2. Enter the following formula - [Index] < 3 OR [Last] < 3 and click OK.
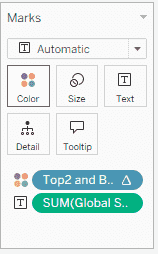
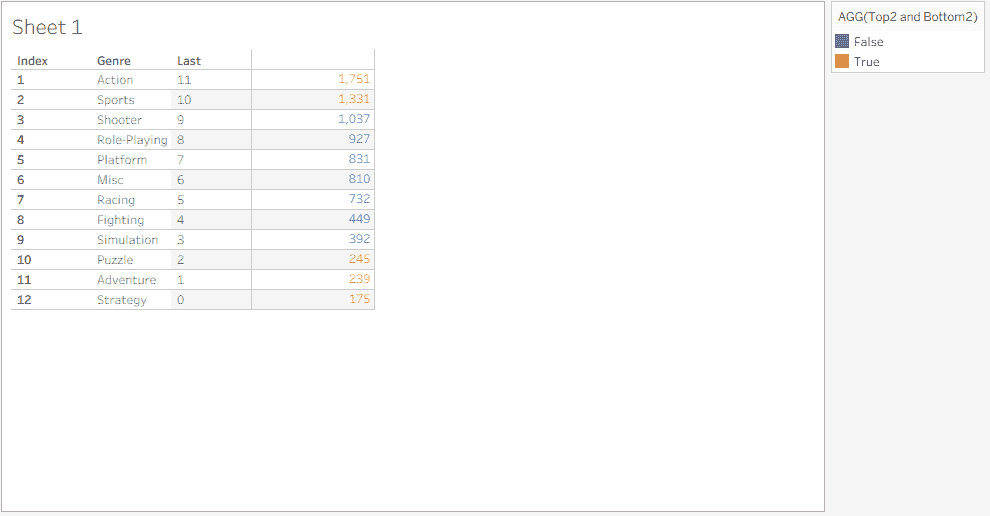
2. Drag and drop Top2 and Bottom2 to the Color shelf in the Marks card.
This applies conditional formatting to highlight both the top 2 and bottom 2 genres using different colors.
After completing all the steps, you will have a conditionally formatted table where:
This conditional formatting technique helps in quick comparison, ranking analysis and creating clean, insight-driven Tableau dashboards.