 |
VOOZH | about |
|
VOOZH | about |
Data Science is not a field where theoretical understanding helps you to start a carrier. It totally depends on the projects you do and the practice you have done that determines your probability of success. Feature engineering is a very important aspect of machine learning and data science and should never be ignored. The main goal of Feature engineering is to get the best results from the algorithms.
In Data Science, the performance of the model is depending on data preprocessing and data handling. Suppose if we build a model without Handling data, we got an accuracy of around 70%. By applying the Feature engineering on the same model there is a chance to increase the performance from 70% to more.
Simply, by using Feature Engineering we improve the performance of the model.
Feature selection is nothing but a selection of required independent features. Selecting the important independent features which have more relation with the dependent feature will help to build a good model. There are some methods for feature selection:
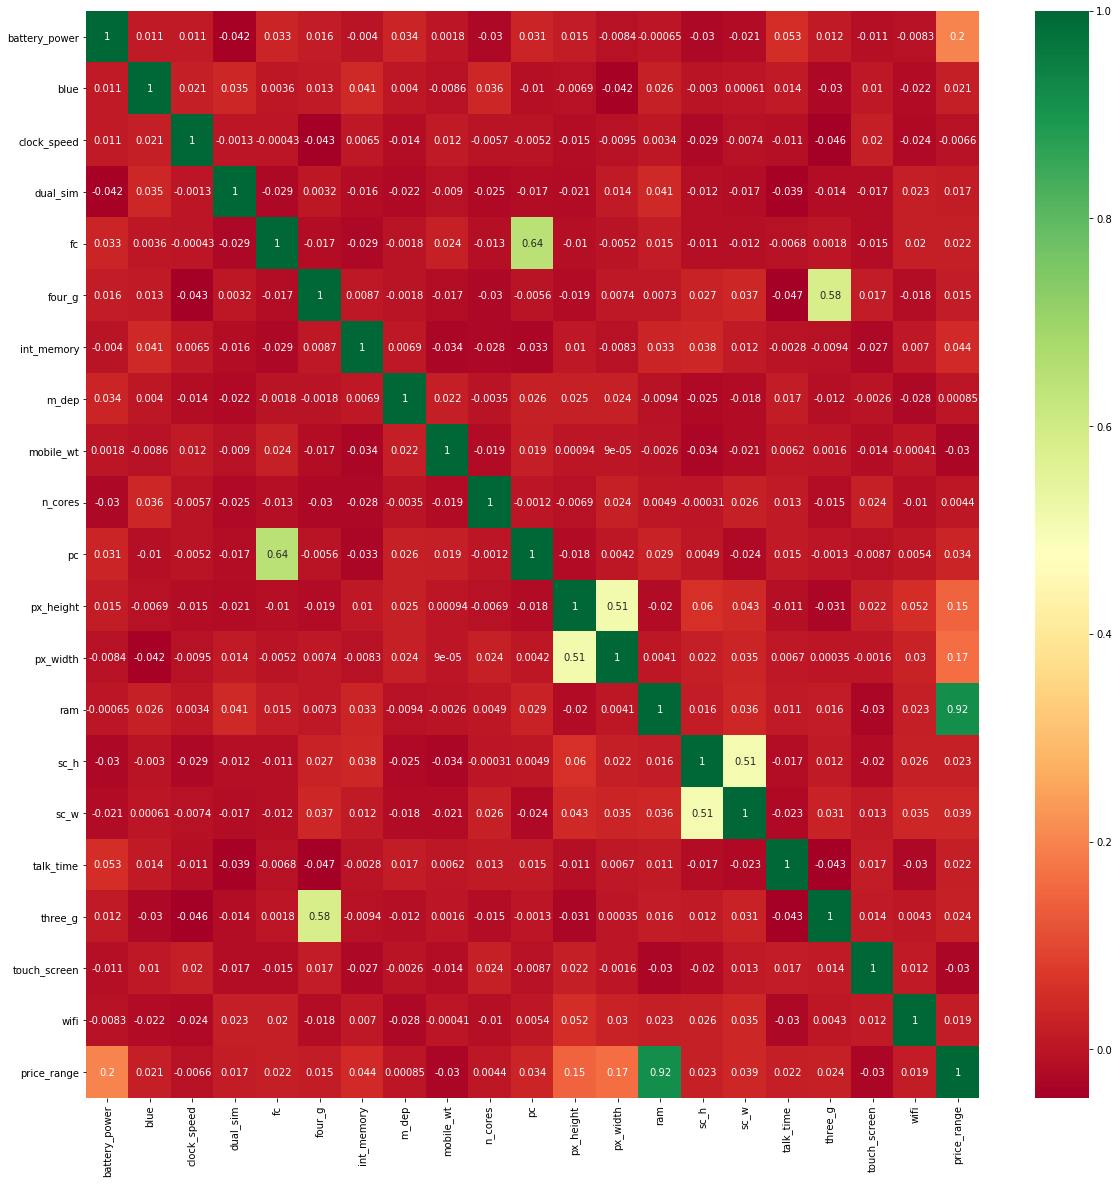
Heatmap is a graphical representation of 2D (two-dimensional) data. Each data value represents in a matrix.
Firstly, plot the pair plot between all independent features and dependent features. It will give the relation between dependent and independent features. The relation between the independent feature and the dependent feature is less than 0.2 then choose that independent feature for building a model.
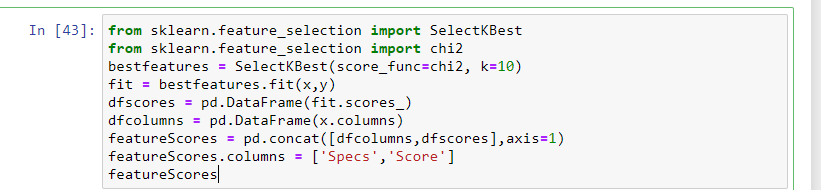
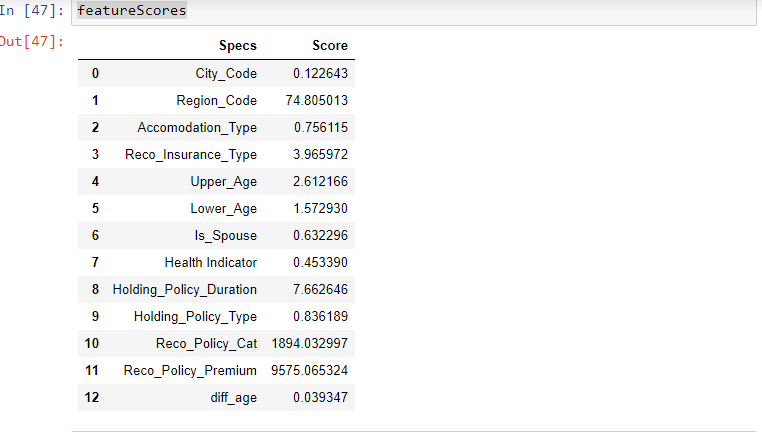
In this, Statistical tests can be used to select the independent features which have the strongest relationship with the dependent feature. SelectKBest method can be used with a suite of different statistical tests to select a specific number of features.
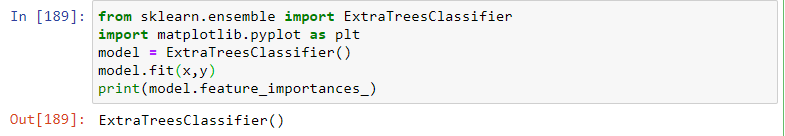
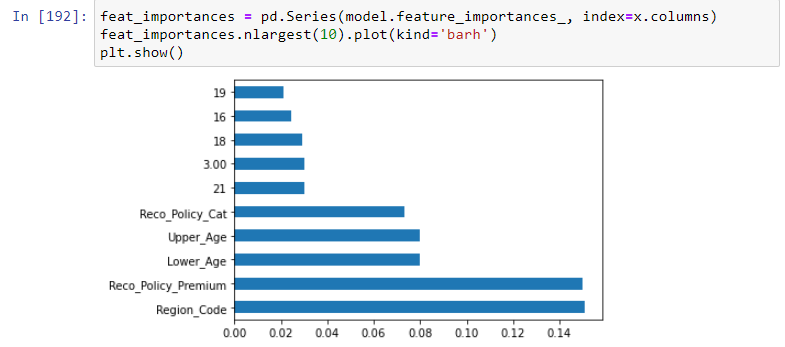
In this method, the ExtraTreesClassifier method will help to give the importance of each independent feature with a dependent feature. Feature importance will give you a score for each feature of your data, the higher the score more important or relevant to the feature towards your output variable.
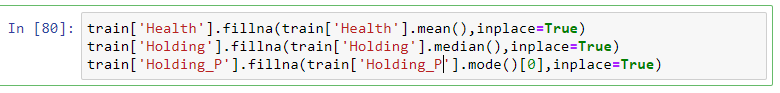
In some datasets, we got the NA values in features. It is nothing but missing data. By handling this type of data there are many ways:
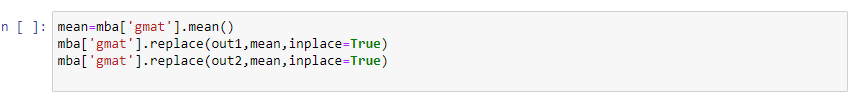
If you choose to drop options, there is a chance to lose important information from them. So better to choose to replace options.
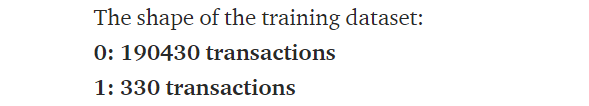
Why need to handle imbalanced data? Because of to reduce overfitting and underfitting problem.
suppose a feature has a factor level2(0 and 1). it consists of 1’s is 5% and 0’s is 95%. It is called imbalanced data.
Example:-
By preventing this problem there are some methods:
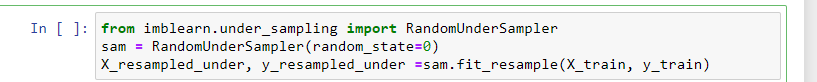
Under-sampling the majority class will resample the majority class points in the data to make them equal to the minority class.
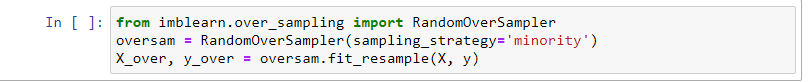
Oversampling minority class will resample the minority class points in the data to make them equal to the majority class.
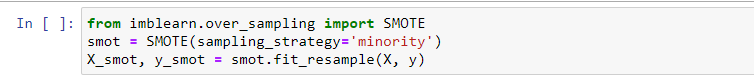
In this method, synthetic samples are generated for the minority class and equal to the majority class.
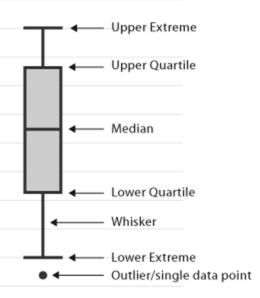
firstly, calculate the skewness of the features and check whether they are positively skewed, negatively skewed, or normally skewed. Another method is to plot the boxplot to features and check if any values are out of bounds or not. if there, they are called outliers.
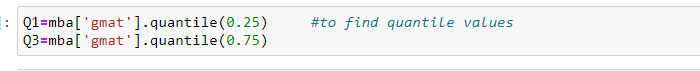
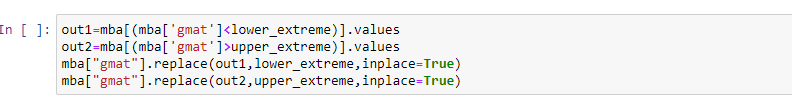
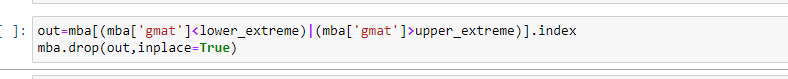
first, calculate quantile values at 25% and 75%.
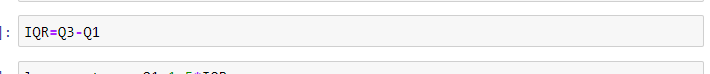
IQR = Q3 – Q1
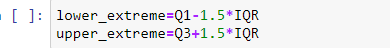
lower extreme=Q1 – 1.5 * IQR
upper extreme=Q3– 1.5 * IQRe
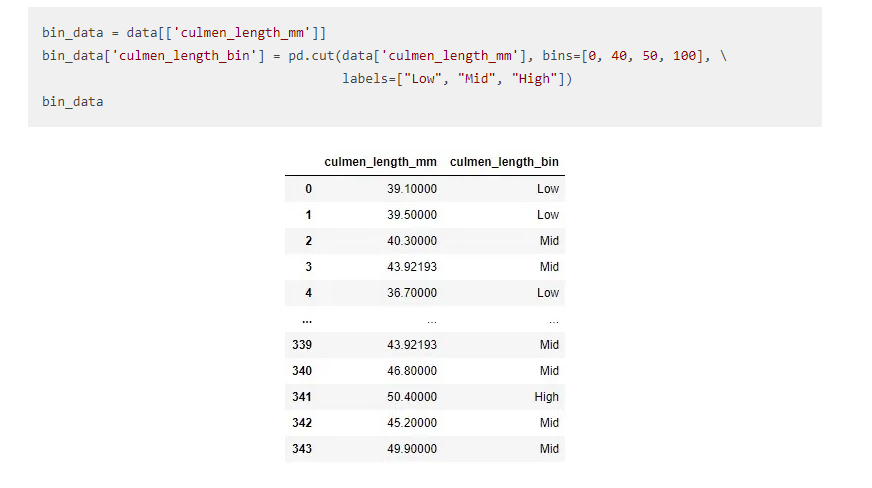
Binning is nothing but any data value within the range is made to fit into the bin. It is important in your data exploration activity. We typically use it to transform continuous variables into discrete ones.
Suppose if we have AGE feature in continuous and we need to divide the age into groups as a feature then it will be useful.
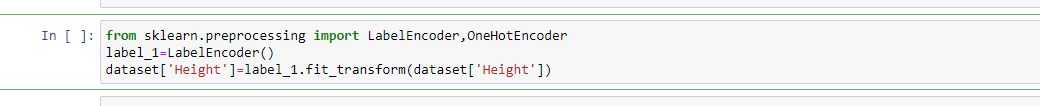
Why this will apply? because in datasets we may contain object datatypes. for building a model we need to have all features are in integer datatypes. so, Label Encoder and OneHotEncoder are used to convert object datatype to integer datatype.
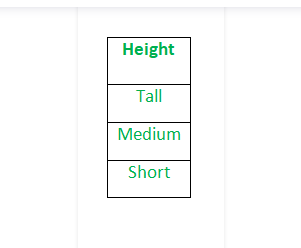
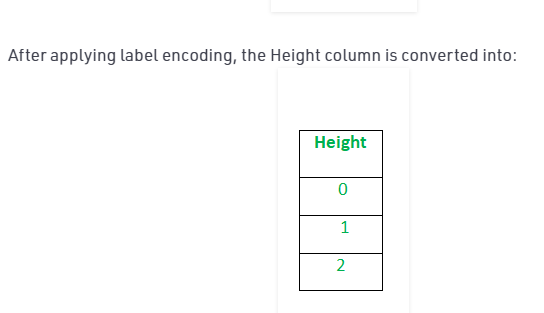
Before applying Label Encoding
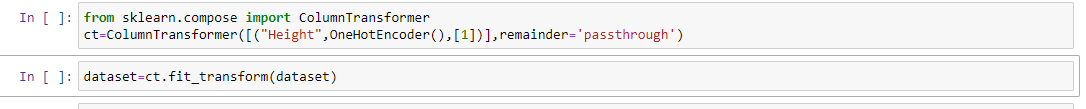
After applying label encoding then apply the column transformer method to convert labels to 0 and 1
By applying get_dummies we convert directly categorical to numerical
Why this scaling is applying? because to reduce the variance effect and to overcome the fitting problem. there are two types of scaling methods:
When this method is used?. when all features are having high values, not 0 and 1.
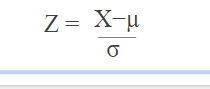
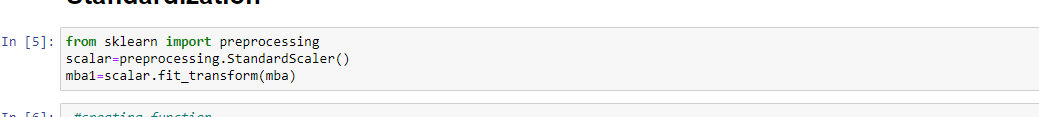
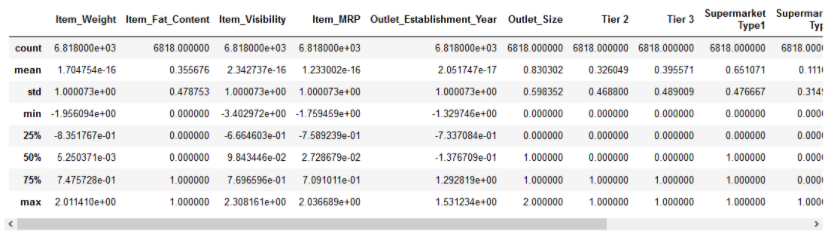
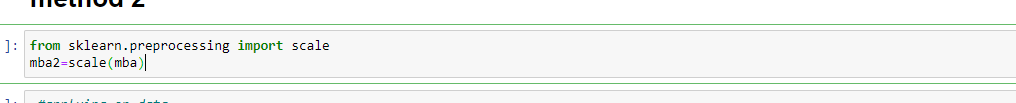
It is a technique to standardize the independent features that present in a fixed range to bring all values to the same magnitudes.
In standardization, the mean of the independent features is 0 and the standard deviation is 1.
After encoding feature labels are in 0 and 1. This may affect standardization. To overcome this, we use Normalization.
Normalization also makes the training process less sensitive by the scale of the features. This results in getting better coefficients after training.
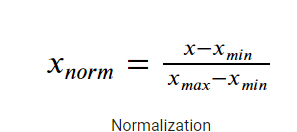
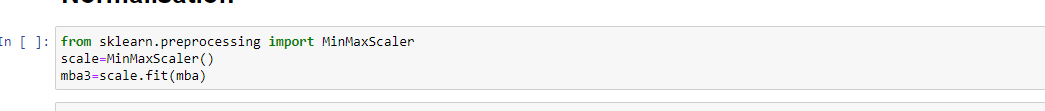
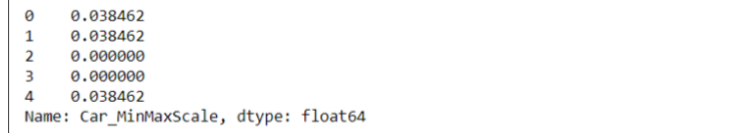
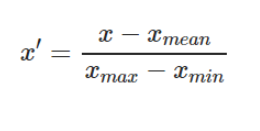
It is a method to rescales the feature to a hard and fast range of [0,1] by subtracting the minimum value of the feature then dividing by the range.
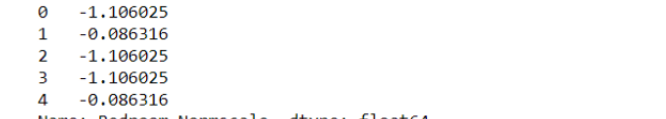
It is a method to rescales the feature to a hard and fast range of [-1,1] with mean=0.
In this article, I covered step by step process of feature engineering. This is more helpful to increase prediction accuracy.
Keep in mind that there are no particular methods to increase your prediction accuracy. It all depends on your data and applies multiple methods.
As a next step, I encourage you to try out different datasets and analyze them. And don’t forget to share your insights in the comments section below!
I am Pavan Kumar Reddy Elluru. I completed my graduation at G.Pullareddy Engineering College in the year 2020. I am a certified data scientist in the year 2021 and passionate about Machine Learning and Deep Learning Projects.
Please ping me in case of any queries or just to say hi!
Email id:- [email protected]
Linkedin id: – www.linkedin.com/in/elluru-pavan-kumar-reddy-a1b183197
Github id: – pawankumarreddy1999 (Pavan Kumar Reddy Elluru) (github.com)
GPT-4 vs. Llama 3.1 – Which Model is Better?
Llama-3.1-Storm-8B: The 8B LLM Powerhouse Surpa...
A Comprehensive Guide to Building Agentic RAG S...
Top 10 Machine Learning Algorithms in 2026
45 Questions to Test a Data Scientist on Basics...
90+ Python Interview Questions and Answers (202...
8 Easy Ways to Access ChatGPT for Free
Prompt Engineering: Definition, Examples, Tips ...
What is LangChain?
What is Retrieval-Augmented Generation (RAG)?
In correlation matrix, if the relation between independent and dependent variable is greater than 0.02 then it gives a good measure in prediction. Why are we doing the exact opposite thing. Please let me know if I might be wrong
It's is very good Example of Feature Engineering But i have a question this all steps are Full ??
Edit
Resend OTP
Resend OTP in 45s
.png)