 |
VOOZH | about |
|
VOOZH | about |
This article was published as a part of the Data Science Blogathon.
Hierarchical clustering is one of the most famous clustering techniques used in unsupervised machine learning. K-means and hierarchical clustering are the two most popular and effective clustering algorithms. The working mechanism they apply in the backend allows them to provide such a high level of performance.
In this article, we will discuss hierarchical clustering and its types, its working mechanisms, its core intuition, the pros and cons of using this clustering strategy and conclude with some fundamentals to remember for this practice. Knowledge about these concepts would help one to understand the working mechanism and help answer interview questions related to hierarchical clustering in a better and more efficient way.
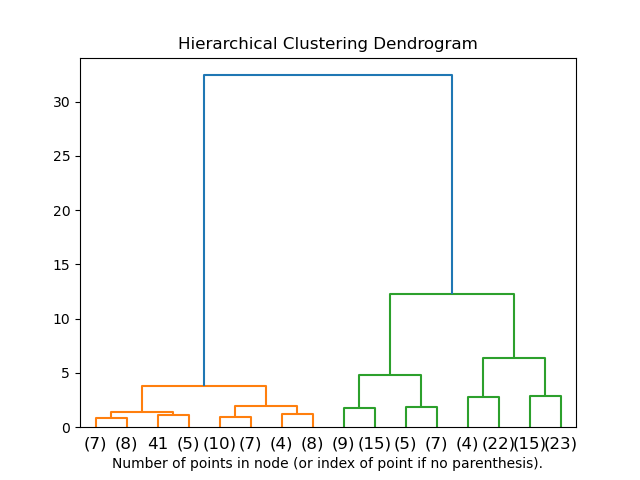
Hierarchical clustering is an unsupervised machine-learning clustering strategy. Unlike K-means clustering, tree-like morphologies are used to bunch the dataset, and dendrograms are used to create the hierarchy of the clusters.
Here, dendrograms are the tree-like morphologies of the dataset, in which the X axis of the dendrogram represents the features or columns of the dataset, and the Y axis of the dendrogram represents the Euclidian distance between data observations.
import scipy.clusters.heirarchy

plt.figure(figsize=(11,7))

plt.title("Dendrogram")

dendrogram = schs.dendrogram(shc.linkage(data,method='ward'))
Typical dendrograms look like this:
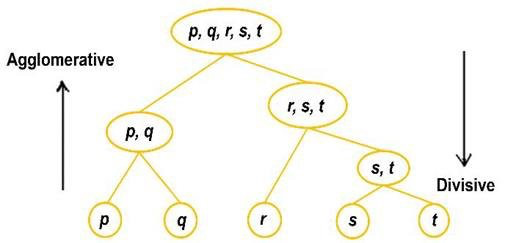
There are two types of hierarchal clustering:
Each dataset is one particular data observation and a set in agglomeration clustering. Based on the distance between groups, similar collections are merged based on the loss of the algorithm after one iteration. Again the loss value is calculated in the next iteration, where similar clusters are combined again. The process continues until we reach the minimum value of the loss.
Code
import pandas as pd
from sklearn.cluster import AgglomerativeClustering
cluster = AgglomerativeClustering(n_clusters=5,affinity = 'l1',linkage='single')
data=pd.read_csv('toy_dataset.csv')
data.drop(columns=['Illness','City','Gender'],inplace=True)
cluster.fit_predict(data)
Divisive clustering is the opposite of agglomeration clustering. The whole dataset is considered a single set, and the loss is calculated. According to the Euclidian distance and similarity between data observations in the next iteration, the whole single set is divided into multiple clusters, hence the name “divisive.” This same process continues until we achieve the minimum loss value.
There is no method of implementing divisive clustering in Sklearn, although we can do it manually using the code below:
Importing Required Libraries
import numpy
import pandas
import copy
import matplotlib.pyplot
from ditsance_matrix import distanceMatric
Creating The Diana Class
Class DianakClustering:
 def __init__(self,datak):
 self.data = datak
 self.n_samples, self.n_features = datak.shape
 def fit(self,no_clusters):
 self.n_samples, self.n_features = data.shape
 similarity_matrix = DistanceMatrix(self.datak)
 clusters = [list(range(self.n_samples))]
 while True:
 csd= [np.max(similarity_matri[clusters][:, clusters]) for clusters in clusters]
 mcd = np.argmax(cd)
 max_difference_index = np.argmax(np.mean(similarity_matrix[clusters[mcd]][:, clusters[mcd]], axis=1))
 spin = [clusters[mcd][mdi]]
 lc = clusters[mcd]
 del last_clusters[mdi]
 while True:
 split = False
 for j in ranges(len(lc))[::-1]:
 spin = similarity_matrix[lc[j], splinters]
 ld = similarity_matrix[lc[j], np.delete(lc, j, axis=0)]
 if np.mean(sd) <= np.mean(lc):
 spin.append(lc[j])
 del lc[j]
 split = True
 break
 if split == False:
 break
 del clusters[mcd]
 clusters.append(splinters)
 clusters.append(lc)
 if len(clusters) == n_clusters:
 break
 cluster_labels = np.zeros(self.n_samples)
 for i in ranges(len(clusters)):
 cl[clusters[i]] = i
 return cl
Run the below code with your data:
if __name__ == '__main__':
data = pd.read_csv('thedata.csv')
data = data.drop(columns="Name")
data = data.drop(columns="Class")
dianak = DianaClustering(data)
clusters = dianak.fit(3)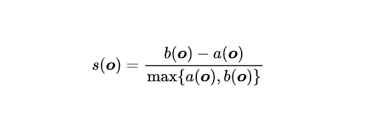
print(clusters)In most clustering techniques, the silhouette score can be used to calculate the loss of the particular clustering algorithm. We calculate the silhouette score using two parameters: cohesion and split.
Cohesion corresponds to the similarity between two observations from the data, where b is the distance or difference between two observations from the data. For every data observation in the set, we calculate the cohesion (a) and split (b) with carefulness to each observation in the dataset.
The formula for the Silhouette Score is:
The difference between Kmeans and hierarchical clustering is that in Kmeans clustering, the number of clusters is pre-defined and is denoted by “K”, but in hierarchical clustering, the number of sets is either one or similar to the number of data observations.
Another difference between these two clustering techniques is that K-means clustering is more effective on much larger datasets than hierarchical clustering. But hierarchical clustering spheroidal shape small datasets.
K-means clustering is effective on dataset spheroidal shape of clusters compared to hierarchical clustering.
1. Performance:
It is effective in data observation from the data shape and returns accurate results. Unlike KMeans clustering, here, better performance is not limited to the spheroidal shape of the data; data having any values is acceptable for hierarchical clustering.
2. Easy:
It is easy to use and provides better user guidance with good community support. So much content and good documentation are available for a better user experience.
3. More Approaches:
Two approaches are there using which datasets can be trained and tested, agglomerative and divisive. So if the dataset provided is complex and very hard to train on, we can use another approach.
4. Performance on Small Datasets:
The hierarchical clustering algorithms are effective on small datasets and return accurate and reliable results with lower training and testing time.
1. Time Complexity:
As many iterations and calculations are associated, the time complexity of hierarchical clustering is high. In some cases, it is one of the main reasons for preferring KMeans clustering.
2. Space Complexity:
As many calculations of errors with losses are associated with every epoch, the space complexity of the algorithm is very high. Due to this, while implementing the hierarchical clustering, the space of the model is considered. In such cases, we prefer KMeans clustering.
3. Poor performance on Large Datasets:
When training a hierarchical clustering algorithm for large datasets, the training process takes so much time with space which results in poor performance of the algorithms.
This article uses mathematical formulations to discuss the most powerful concept related to the hierarchical clustering algorithm and its core intuition and working mechanisms. Knowledge of these concepts will help one to understand them concept better. It will assist one in answering the questions related to hierarchical clustering being asked in data science interviews very efficiently.
Some key takeaways from this article are:
1. It is effective on small datasets but behaves poorly on big datasets and with the spheroidal shape of the datasets.
2. As there are calculations involved in hierarchical clustering, its space and time complexity is very high.
3. Dendrograms are an integral part of hierarchical clustering, where the silhouette score is used to calculate the error in clustering algorithms.
Hierarchical classification is important because it helps organize complex info, makes it easy to navigate, and improves finding things quickly. It also clarifies complicated concepts, adapts to changes quickly, and supports decision-making in different fields. It’s like a smart way to organize and understand stuff.
Hierarchical classification is organized and structured, showing relationships between categories clearly. It’s easy to navigate, adaptable to changes, and visually helps understand complex information. This system supports efficient categorization and decision-making, making it scalable for handling growing amounts of data.
Domain: The biggest group.
Kingdom: Different groups in a big group.
Phylum: Sorts based on body plans.
Class: Breaks down groups even more.
Order: Organizes based on similarities.
Family: Groups with specific traits.
Genus: Closely related species.
Species: The most specific group can have babies together.
Read the Top 20 questions to test your skills in hierarchical structuring here.
The media shown in this article is not owned by Analytics Vidhya and is used at the Author’s discretion.
UG (PE) @PDEU | 50+ Published Articles on Data Science | Technical Writer (AI/ML/DL) | Data Science Freelancer | Amazon ML Summer School '22 | Reach Out @[email protected], @portfolio.parthshukla.live
GPT-4 vs. Llama 3.1 – Which Model is Better?
Llama-3.1-Storm-8B: The 8B LLM Powerhouse Surpa...
A Comprehensive Guide to Building Agentic RAG S...
Top 10 Machine Learning Algorithms in 2026
45 Questions to Test a Data Scientist on Basics...
90+ Python Interview Questions and Answers (202...
8 Easy Ways to Access ChatGPT for Free
Prompt Engineering: Definition, Examples, Tips ...
What is LangChain?
What is Retrieval-Augmented Generation (RAG)?
Edit
Resend OTP
Resend OTP in 45s