 |
VOOZH | about |
|
VOOZH | about |
E-commerce has reshaped how businesses operate and engage with customers. With the rapid growth of online shopping, understanding and analyzing e-commerce sales data is important for businesses aiming to remain competitive. This article will guide you through the process of analyzing e-commerce sales data using R.
In this project, we will analyze e-commerce sales data to extract actionable insights that can help businesses optimize their operations and strategies. We will focus on the following key areas:
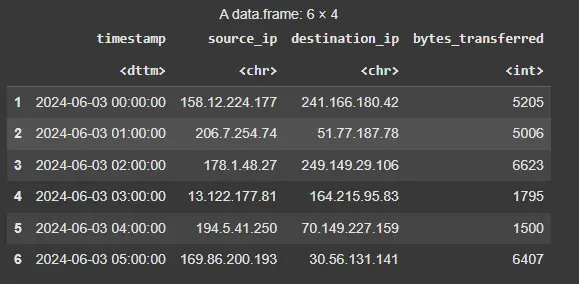
We will need to load the necessary libraries ggplot2 ,dplyr and tidyr for analysis. We will be using the E-commerce Sales Dataset for this project which can be downloaded from here.
Output:
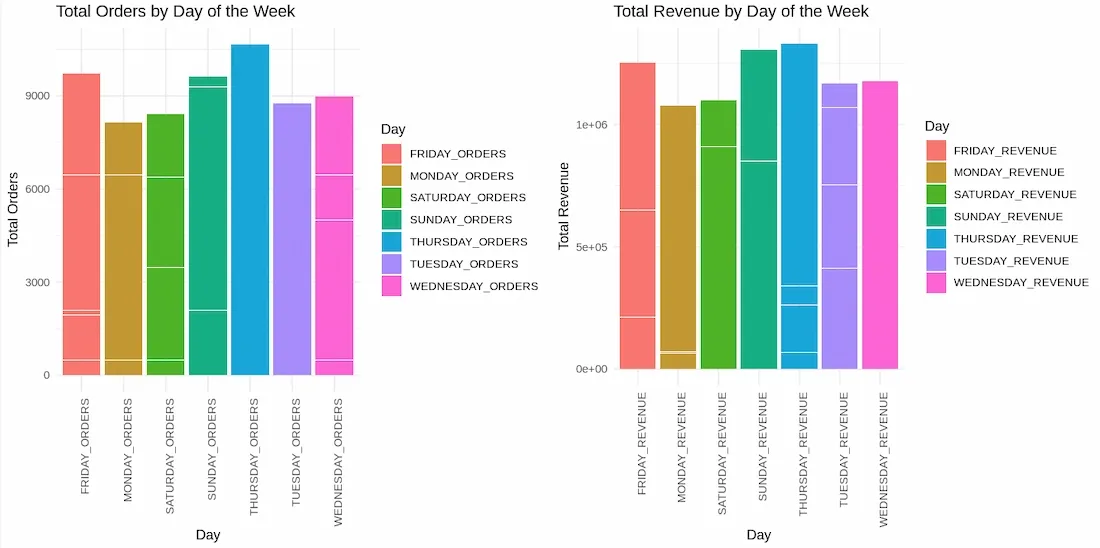
We are aggregating the data by day of the week to visualize the total number of orders and revenue generated on each day. Understanding which days generate the most orders and revenue can help businesses optimize marketing efforts and inventory management.
Output:
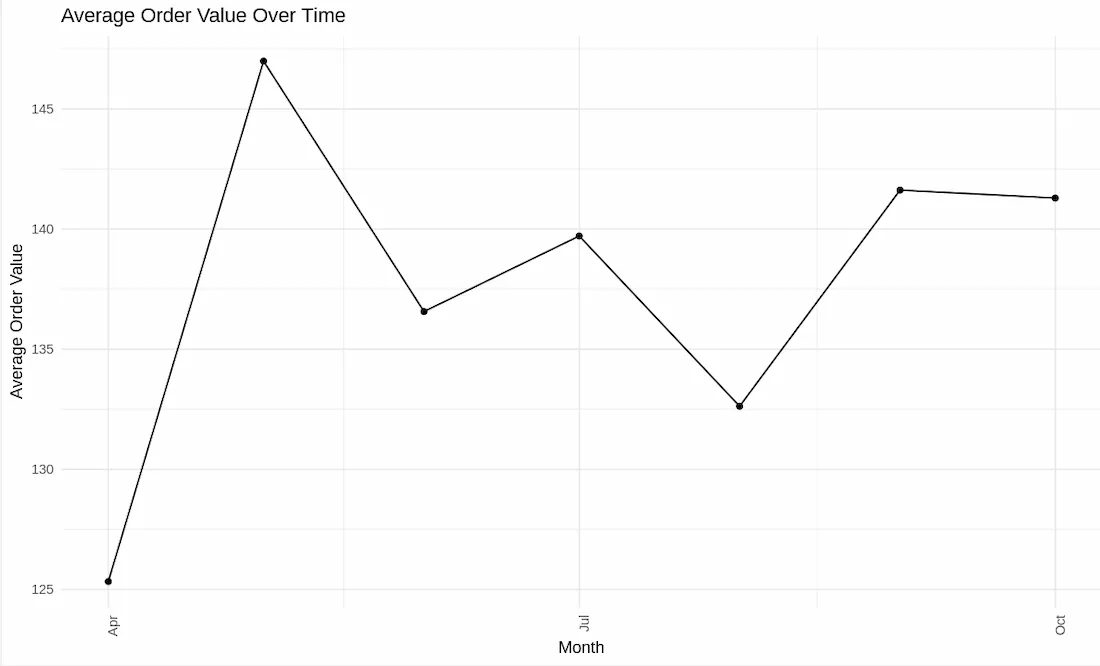
We are calculating the average order value by month and plotting the trend over time to identify any fluctuations in customer spending. Tracking how the average order value changes over time helps businesses identify shifts in customer spending behavior.
Output:
This line chart helps track how the average order value evolves over time. We observed that fluctuations in the average order value can reflect seasonal changes, customer preferences, or the impact of promotions and discounts.
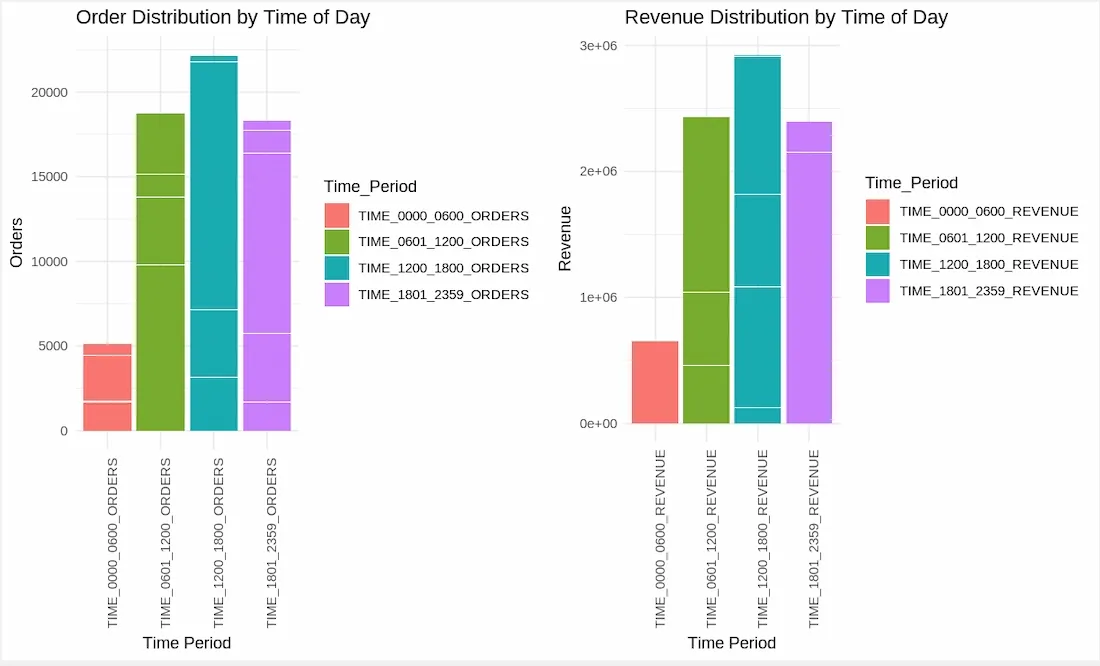
We are aggregating the orders and revenue by time of day (morning, afternoon, evening, night) to visualize the patterns of order placement throughout the day. Analyzing when most orders are placed can assist in optimizing operational efficiency and marketing strategies.
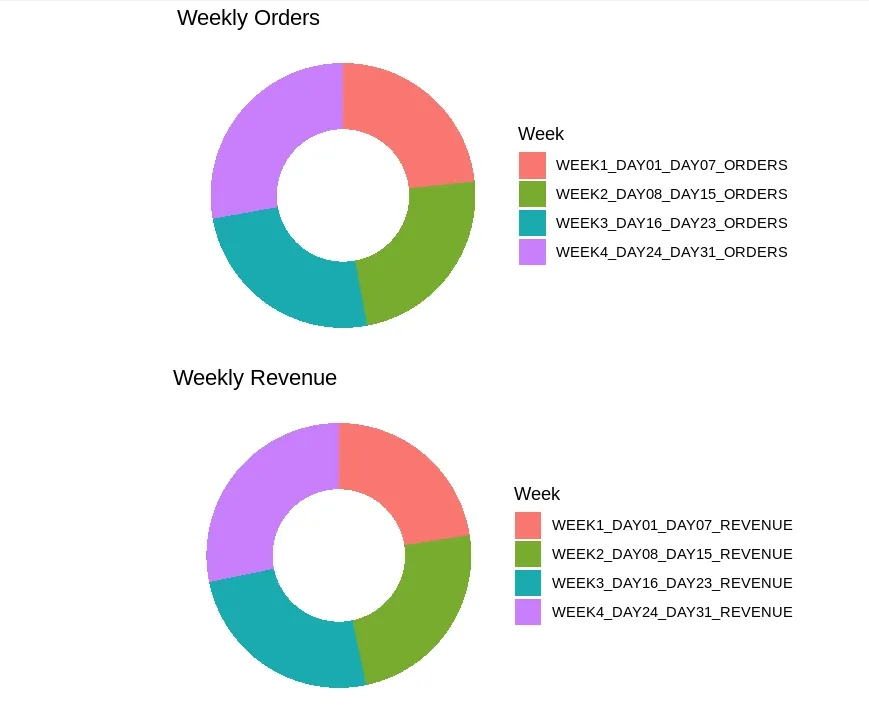
We are aggregating the total orders and revenue by week and visualizing them using donut charts to show the distribution over the weeks. This helps identify patterns and opportunities for targeted marketing campaigns.
Output:
The donut charts visualize the distribution of orders and revenue across weeks. We were able to identify which weeks had the highest sales, allowing businesses to plan for future campaigns or allocate resources accordingly.
By visualizing E-commerce sales data in R, we identified key trends and patterns:
These visualizations help businesses make informed decisions, optimize operations, and drive growth through strategic insights.