 |
VOOZH | about |
|
VOOZH | about |
I was starring at the computer screen for the final clustering result. Finally, I opened the output file and found the first cluster with more than 90% of the data-points. 6 other clusters composed the 10% of the remaining data-points. I packed up my bag and thought over the possible reasons of this dramatic failure of the technique on the way home.
This article will illustrate how to tackle such problems in a systematic manner by exploring the possible reasons of such failure. As this is the second part of the concept (please read basics of clustering here), we assume the reader is comfortable with the two clustering techniques widely used in the industry and their mechanisms.
[stextbox id=”section”]Definition of a good cluster analysis :[/stextbox]
There are two basic requirements of a good cluster analysis :
1. Data-points within same cluster share similar profile : Statistical method to judge this criterion is simply checking the standard deviation for each input variable in each cluster. A perfect separation in case of cluster analysis is rarely achieved. Hence,even one standard deviation distance between two cluster means is considered to be a good separation.
2. Well spread proportion of data-points among clusters : There are no industry standards for this requirement. But a minimum of 5% and maximum of 35% of the total population can be assumed as a safe range for each cluster.
[stextbox id=”section”]A hard nut to crack:[/stextbox]
This illustrative example is very similar to the problem I faced recently while doing a cluster analysis. Following is what I did to build clusters :
1. Identifying all possible variables which can be used for clustering technique
2. Outlier treatment and missing value fixation
3. Identifying most significant variables to be considered for final clustering analysis using VARCLUS, one of the technique to find independent variables
4. Finding final clusters using FASTCLUS, fastest technique to do a k-means clustering
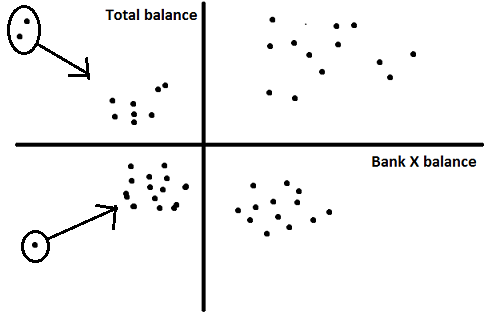
Following is a graphical representation of the clusters I get:
Cluster 1 : 90%
Cluster 2 : 5%
Cluster 3 : 5%
This does not qualify as a good cluster analysis.
[stextbox id=”section”]What could have gone wrong?[/stextbox]
Whenever stuck with bad results for any modelling technique, the best way to solve it is not trying different solution but to explore what could have gone wrong. Let’s try to do the same in this case. Following are some of the hypothesis around what could have gone wrong :
1. Outliers still present : Try making outlier definition stricter. This has been a savior for me in most of the cases. Try capping and flouring instead of removing the outlier.
2. Presence of overshadowing variable : This kind of variable generally become visible in the FASTCLUS output, in the significance table. If the significance index of a particular variable is exceptionally high, try replacing it with the next best variable. This next best variable can be found at the VARCLUS step.
What if the problem still remains? What does this indicate?
It indicates that the population is too homogeneous to be segmented. This problem is the hardest nut to crack. Try incorporating more data points to start with. If the problem still remains we need to do clustering at a finer level. We will now discuss this method in detail.
Possible Clustering Technique and their advantages
1. Hierarchical Clustering : The advantage of this technique is that it becomes very handy to club different data-points. In other words, the output of the model is a tree and we can choose any combination from the tree to build clusters for different number of clusters. The disadvantage of technique is that it can handle only few data-points and takes exponential time for the high number of observations. If this were not a constraint for the technique, no cluster analysis would have failed.
2. k-means Clustering : The advantage of this technique is that it can handle huge number of observations and takes very less time compared to all other available techniques. The disadvantage of the technique is that changing the process in between to club data-points to the second best cluster is not possible. Hence, the method is much more rigid when compared to Hierarchical Clustering.
The two techniques have opposite pros and cons and hence can be used together to compliment each other.
[stextbox id=”section”]What if we combine the two methods?[/stextbox]
Following is the technique I finally used to get reasonable and actionable clusters :
1. Use outlier removal and overshadowing variable removal technique
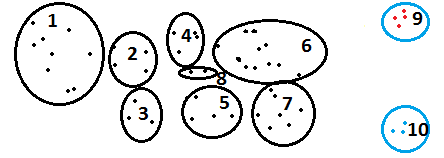
2. Use k-means method to get many granular cluster : Build number of granular clusters. For n number of final cluster required, I put k=3 to 4 times n. Following is an illustrative figure to demonstrate this step :
We get 10 smaller clusters with size ranging from 2-25% of the same population.
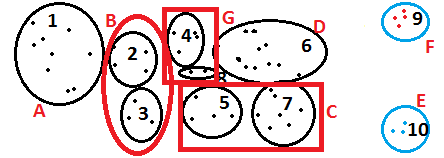
3. Use Hierarchical Clustering to club these granular clusters : Plug the mean values of the granular clusters as individual data-points to hierarchical clustering. This will give a line diagram as output. Choose the combinations which will not lead a cluster to go above 35% and make sure all the clusters come above 5%. Following is an illustrative figure of this step :
The output of this step is a set of clusters complying to both the constraints of a good clustering analysis.
[stextbox id=”section”]End Notes :[/stextbox]
As the method demonstrated above uses finer differences between observation, which were not differentiated by simply using k-means, the technique needs to be verified for the separation test. In such cases, when strong separation is not possible between observations, vastly different actionable should not be taken for each cluster.
What do think of this technique? Do you think this provides a solution to any problem you face? Are there any other techniques you use to improve separation of your clustering models ? Do let us know your thoughts in the comments below.
Tavish Srivastava, co-founder and Chief Strategy Officer of Analytics Vidhya, is an IIT Madras graduate and a passionate data-science professional with 8+ years of diverse experience in markets including the US, India and Singapore, domains including Digital Acquisitions, Customer Servicing and Customer Management, and industry including Retail Banking, Credit Cards and Insurance. He is fascinated by the idea of artificial intelligence inspired by human intelligence and enjoys every discussion, theory or even movie related to this idea.
GPT-4 vs. Llama 3.1 – Which Model is Better?
Llama-3.1-Storm-8B: The 8B LLM Powerhouse Surpa...
A Comprehensive Guide to Building Agentic RAG S...
Top 10 Machine Learning Algorithms in 2026
45 Questions to Test a Data Scientist on Basics...
90+ Python Interview Questions and Answers (202...
8 Easy Ways to Access ChatGPT for Free
Prompt Engineering: Definition, Examples, Tips ...
What is LangChain?
What is Retrieval-Augmented Generation (RAG)?
Hi Tavish, Can you throw some light on the output results that come out of running PROC VARCLUS and FASTCLUS and explain the interpretations and industry standards? For example things like "cubic clustering criterion". If you can take the output and provide some examples that would be great!
Hi Tavish Can you please answer few questions for me : 1. I have a dataset of ~5 lakhs records and a system of high computation. I am able to perform both k means and heirarchical in R successfully. Which method should I prefer? 2. I have a dataset of 5 lakh rows and 50 variables. There are categorical variables with multiple categories (~Eg. State) and there are nominal categories (~Eg. loan issuance year). How do I handle such categorical and nominal categories? I am using R and am not aware of the any procedure which might replicate VARCLUS procedure in R. Any suggestions?
i want to use this article in definition of my thesis. could you plz send me the references of this article?
Edit
Resend OTP
Resend OTP in 45s