 |
VOOZH | about |
|
VOOZH | about |
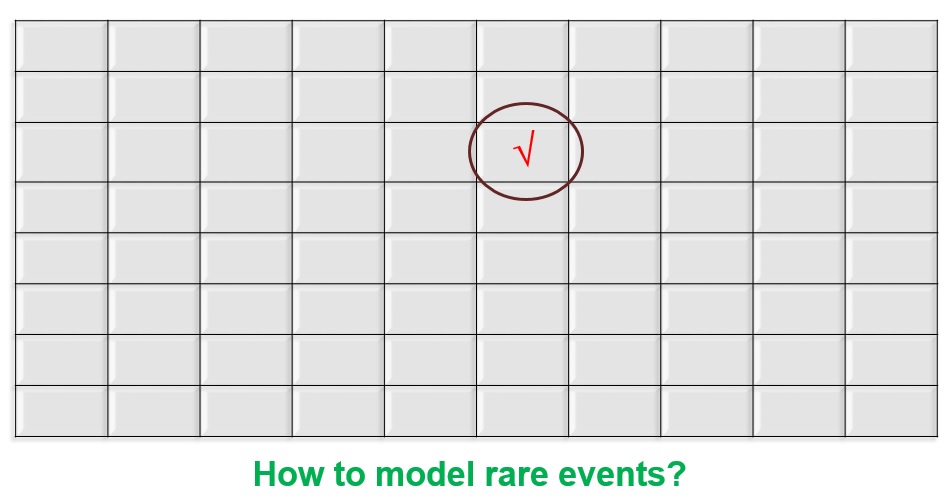
Only 531 out of a population of 50,431 customer closed their saving account in a year, but the dollar value lost because of such closures was more than $ 5 Million.
The best way to arrest these attrition was by predicting the propensity of attrition for individual customer and then pitch retention offers to these identified customers. This was a typical case of modeling in a rare event population. This kind of problems are also very common in Health care analytics.
In such analysis, there are two challenges :
We can find number of statistical papers on this specific problem. This article will collect the best practices and layout the step by step process to make a logistic regression model in a rare event population.
[stextbox id=”section”]Why not simply make a logistic regression model on the population? [/stextbox]
The problem basically is that maximum likelihood estimation of the logistic model is well-known to suffer from small-sample bias. And the degree of bias is strongly dependent on the number of cases in the less frequent of the two categories. Try estimating the degree of bias in each of the following samples:
A. 20 events in a sample size of 1000 (Response rate : 2%)
B. 180 events in a sample size of 10000 (Response rate : 1.8%)
C. 990 events in a sample size of 1000 (Response rate : 99%)
Try not to see the answer below before you have your answer ready.
The correct answer here is C > A > B . C will suffer with the problem of small-sample bias most. Confused? Did we not say this problem exist in cases where events are too low? The problem is not specifically the rarity of events, but rather the possibility of a small number of cases on the rarer of the two outcomes. Why “A>B”? Its simply because of the population size. Even though the response rate in B is lesser than A, A struggles with the problem more than B. Hence, smaller the sample size ,higher is the risk of small sample bias.
[stextbox id=”section”] What is the solution in such problems? [/stextbox]
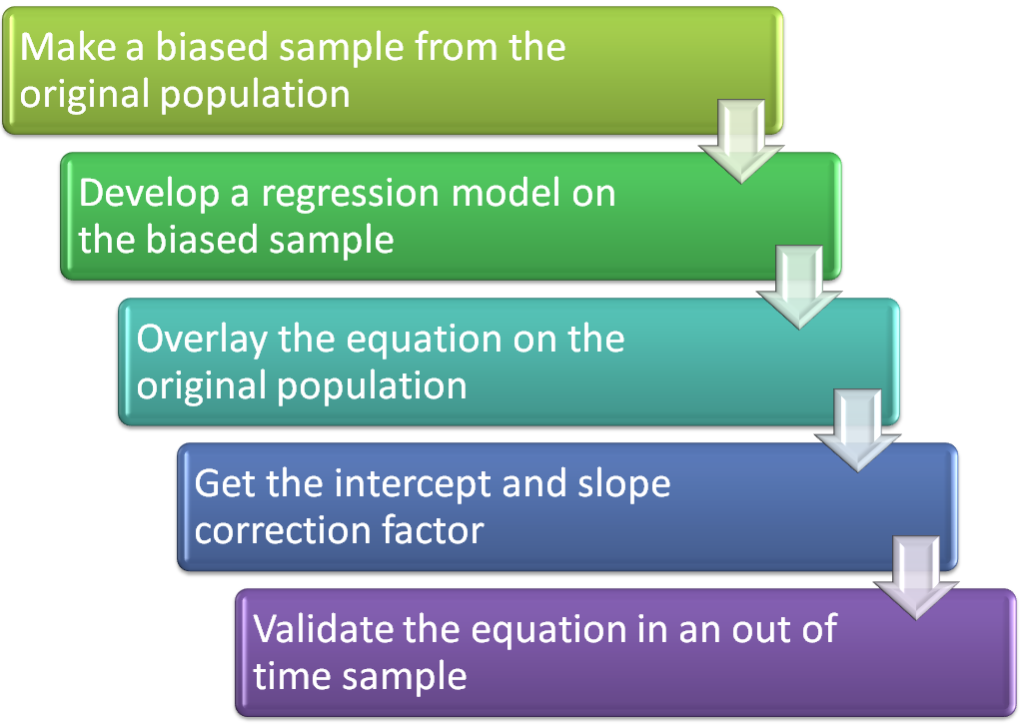
The solution in such problems is slightly longer than a normal logistic regression model. In such cases, we make a biased sample to increase the proportion of events. Now, we run logistic regression on the sample created. Once we have the final Logit equation, we transform the equation to fit the entire population.
[stextbox id=”section”]Case study: [/stextbox]
Let’s consider the case in hand and walk through the step by step process. We have a population of 50,431 customers out of which 531 attrite in 12 months. We need to predict the probability of attrition, minimizing the false positives.
Step 1 :Select a biased sample
Total number of non attritors in the population is 49,900. We plan to take a sample of 1000 customers. As a thumb rule, we select 25% of the sample size as the responders. Hence, we select 250 customers out of the 531 attriting customers. And rest 750 come from the 49,900 base. This sample of 1000 customers is a biased sample we will consider for our analysis.
Step 2 : Develop the regression model
We now build a logistic regression model on the biased sample selected. We make sure that all the assumptions of the logistic regression are met and we get a reasonable lift because the lift tends to decrease after the transformations.
Step 3 : Overlay equation on the population:
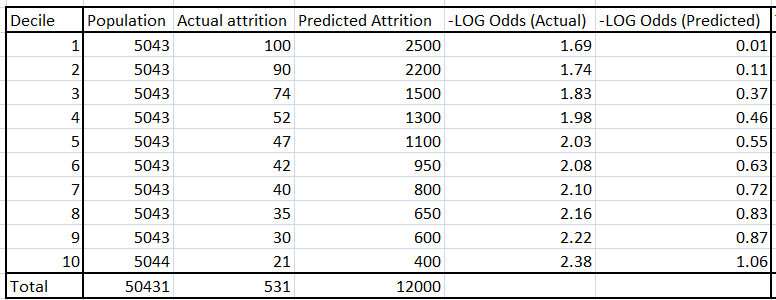
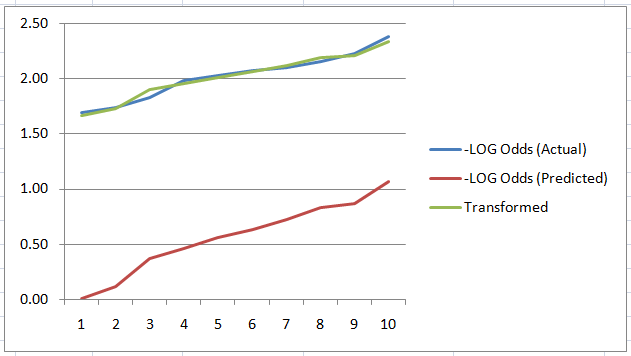
Using the equation found in step 2, get the number of attritors in each decile of the overall population. In the table below, -Log odds (Predicted) directly comes from the regression equation. Using this function, one can find the Predicted attrition for each decile.
Step 4: Solve for intercept and slope transformation
Using the actual and the predicted decile value of the log odds, we find the slope and the intercept required to transform the equation of the sample to the equation of the population. This equation is given by,
{- Log odds (actual)} = slope * {-Log odds(predicted)} + Intercept
Find the slope and intercept using the 10 data-points, each corresponding to each decile.
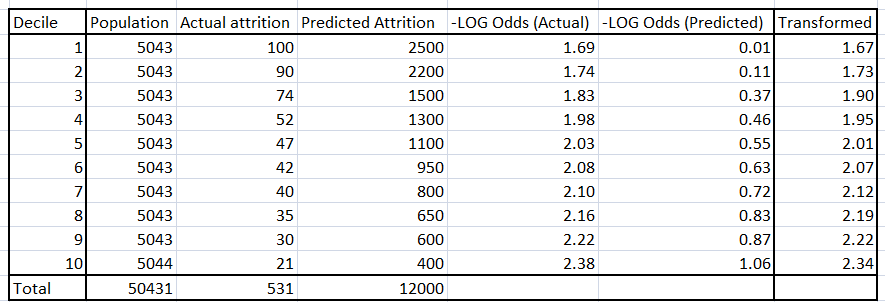
In this case slope is 0.63 and the intercept is 1.66 .
As seen from the above figure, the actual and the transformed logit curve for each decile is much closer compared to the predicted curve.
Step 5: Validate the equation on out of time sample :
Once we reach a final equation of the logit function, we now validate the same on out of time samples. For the case in hand, we take a different cohort and compile the lift chart. If the model holds on out of time as well, we are good to go.
[stextbox id=”section”]End Notes: [/stextbox]
Did you find the article useful? Share with us any other techniques you incorporate while solving a rare event problem. Do let us know your thoughts about this article in the box below.
Tavish Srivastava, co-founder and Chief Strategy Officer of Analytics Vidhya, is an IIT Madras graduate and a passionate data-science professional with 8+ years of diverse experience in markets including the US, India and Singapore, domains including Digital Acquisitions, Customer Servicing and Customer Management, and industry including Retail Banking, Credit Cards and Insurance. He is fascinated by the idea of artificial intelligence inspired by human intelligence and enjoys every discussion, theory or even movie related to this idea.
GPT-4 vs. Llama 3.1 – Which Model is Better?
Llama-3.1-Storm-8B: The 8B LLM Powerhouse Surpa...
A Comprehensive Guide to Building Agentic RAG S...
Top 10 Machine Learning Algorithms in 2026
45 Questions to Test a Data Scientist on Basics...
90+ Python Interview Questions and Answers (202...
8 Easy Ways to Access ChatGPT for Free
Prompt Engineering: Definition, Examples, Tips ...
What is LangChain?
What is Retrieval-Augmented Generation (RAG)?
Hello Tavish it is a nice post. I usually prefer to oversample the cases with such probability that would equalize the proportions in cases/controls though.
Over sampling is a must. It will really helpful if you share how do you translate the found equation on oversample to actual population. Tavish
Hello you say "Using the equation found in step 2," but there is no equation given. Can you give this equation please and explain how you get the values given in the table below part 3 ? I am working on a real life problem related to rare events in a children's hospital. I would like to your method to see if I can predict readmission. thanks. saras
Hi Saras, Equation found in step 2 is the equation you get after running the regression model o biased sample. Table 3 can be directly generated similar to one you make for finding the ks of model. Do let us know of this is still not clear. Tavish
Very good post. Thanks! I am not sure how did you calculate the transformed value and slop/intercept. Could you explain more? Mark
Mark, What we are trying to do here is transform the found logistic equation using the actual unbiased sample. The first thing you need to do is to sort your data-points in the order of predicted attrition. Now decile your population and find the logit for actual attrition and predicted attrition. Now using the equation "{- Log odds (actual)} = slope * {-Log odds(predicted)} + Intercept " find the slope and intercept adjustment factor. Hope this helps. Tavish
Edit
Resend OTP
Resend OTP in 45s