 |
VOOZH | about |
|
VOOZH | about |
I hope you’ve followed my previous articles on ensemble modeling. In this article, I’ll share a crucial trick helpful to build models using ensemble learning. This trick will teach you,
‘How to choose the right models for your ensemble process?’
Are you ready? Let’s Begin!
Imagine the following scenario (great, if you can relate to it).
You are working on a classification problem and have built 1000 machine learning models. Each of the model gives you an AUC in the range of 0.7 to 0.75 . Your task is to combine all the models together to build a more stable and more predictive model by taking up simple bag of these models.
How would you answer it?
To answer this question, let’s try to dig into what are we really looking for in these models.
👁 trick. ensemble learning, machine
“We are trying to combine a set of high-performing diverse models to get a model that has higher stability and higher performance.”
In the sentence above, two things are essential to note:
Now, that we know our model objective, let’s try to quantify both these attributes.
In this article I’ll will choose KS-stat as the Performance Metric and Pearson Coefficient as the Diversity Metric.
There is no perfect algorithm to select the right set of variables. However, in this article I have laid down a methodology which I have found extremely effective in finding the right model set. Following is the step by step methodology with the relevant codes :
We start with finding the performance of individual models. You can use following code :
#I assume train is a table with 1002 columns : column 1 is ID of the row 2:1001 are predictions from individual models and 1002 is the target categorical variable.
train_ks <- 1:1000
for (i in 2:1001){
train_ks[i-1] <- max(ks_compute(train[,i],train[,1002])[10])} #ks_compute is a function whichI have written locally, you can replace it with AUC ROC which is internally built in R.
Let’s try to be effective while referencing our models. Here is a powerful way to do the same:
sno <- 2:1001
train_ks_table <- cbind(sno,train_ks)
train_ks_table <- train_ks_table[order(-train_ks_table[,2]),]
train_order <-c(1,train_ks_table[,1],1002)
train_sorted <- train[,train_order]
You start with the most powerful models in your kitty. And then:
models_selected <- colnames(train_sorted)[2:3]
limit_corr <- 0.75
Here is where you make the final comparison using the performance and the diversity factor (Pearson Coefficient)
for (i in 3:1000) {
choose = 1
for (j in 1:length(models_selected)) {
correlation <- cor(train_sorted[,i],train_sorted[,models_selected[j]])
choose <- ifelse(correlation > limit_corr,0,1*choose)
}
if(choose == 1) {
models_selected <- c(models_selected,colnames(train_sorted)[i])
}
}
Now you have a list of models selected in the vector models_selected.
Having chosen a sequence of models, now is the time to add each combination and check their performance.
train_ks_choose <- rep(1,length(models_selected))
predictions_train <- apply(train_sorted[,2:3],1,mean)
model_considered = 0
for (j in 1:length(models_selected)){
predictions_train <- (model_considered*predictions_train + train_sorted[,models_selected[j]])/(model_considered + 1)
train_ks_choose[j] <- max(ks_compute(predictions_train,train[,462])[10]) #38.49%
model_considered = model_considered + 1
}
ks_table <- cbind(train_ks_choose,itv1_ks_choose,itv2_ks_choose)
write.csv(ks_table,"ks_table.csv")
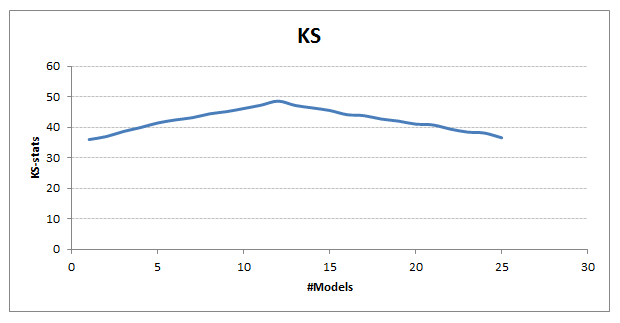
Here is the plot I get after executing the code
It is quite clear from the above graph that we see significant benefits by combining around 12 diverse high-performing models. Our final KS goes up to 49 from 36 (individual model maximum).
How about applying this trick to solve real life problem? Register here for our largest ever Hackathon – The D Hack and compete against more than 500 data scientists across the globe and get a chance to win $300.
Ensemble model gives significant lift over individual models because it is able to combine the positive attributes of multiple models. There is no specific way to combine models together, however I have seen with experience best selections get more intuitive.
Have you tried ensemble learning? If yes, did you see a significant benefit. What method did you use? Share with us your comments/queries/inputs on this article.
Tavish Srivastava, co-founder and Chief Strategy Officer of Analytics Vidhya, is an IIT Madras graduate and a passionate data-science professional with 8+ years of diverse experience in markets including the US, India and Singapore, domains including Digital Acquisitions, Customer Servicing and Customer Management, and industry including Retail Banking, Credit Cards and Insurance. He is fascinated by the idea of artificial intelligence inspired by human intelligence and enjoys every discussion, theory or even movie related to this idea.
GPT-4 vs. Llama 3.1 – Which Model is Better?
Llama-3.1-Storm-8B: The 8B LLM Powerhouse Surpa...
A Comprehensive Guide to Building Agentic RAG S...
Top 10 Machine Learning Algorithms in 2026
45 Questions to Test a Data Scientist on Basics...
90+ Python Interview Questions and Answers (202...
8 Easy Ways to Access ChatGPT for Free
Prompt Engineering: Definition, Examples, Tips ...
What is LangChain?
What is Retrieval-Augmented Generation (RAG)?
I have been following all your post and you have been very helpful, especially for beginners like myself. However, it would be very helpful if you could provide the data used. This will enable the learning as we follow each step.
Interesting article. How would you go from this result to predicting a new set of data?
You make individual model predictions and then apply the weights found from this simulation.
Edit
Resend OTP
Resend OTP in 45s