 |
VOOZH | about |
|
VOOZH | about |
This article was published as a part of the Data Science Blogathon.
The main objectives of a model validation include the testing of the model’s conceptual soundness and continued fit for purpose, including identification of potential risks and limitations. These tests must constitute an effective challenge to the existing production model for the benefit of its improvement, risk mitigation. The data for this exercise is taken from here.
Validate the logistic regression model developed to predict the likelihood an applicant of applying for the loan. The lending companies work by analyzing the financial history of their loan applicants.
The following tests were carried out to validate the model results:
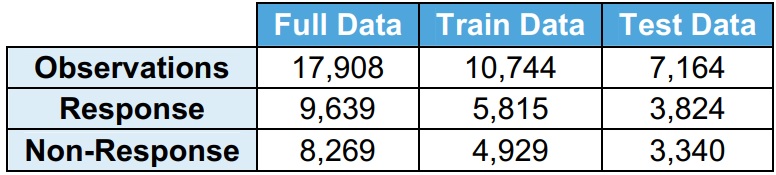
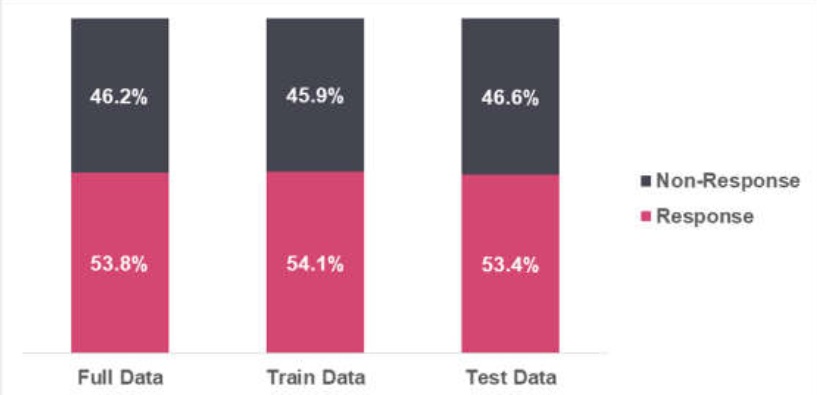
The full data is divided into train data (60% of full data) and test data (40% of full data). The model is developed on the train data and validated on test data.
It is observed that the distribution of response (Y=1) and no response (Y=0) is very similar among full data, train data, and test data.
· Response (Y=1) indicates the applicant has applied for the loan
· No response (Y=0) indicates the applicant has not applied for the loan
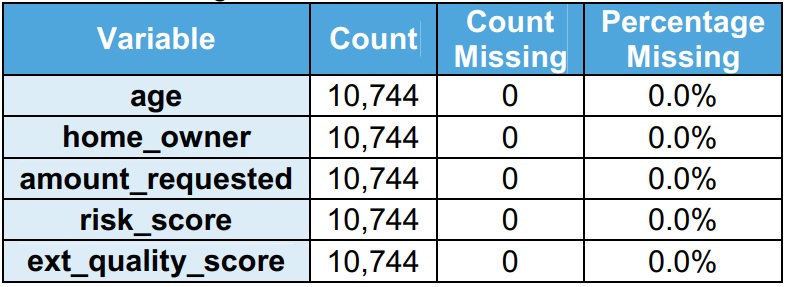
Independent variables include personal and financial information. Risk scores are leveraged to develop the model. There are 5 independent variables in the model.
It is observed that there are no missing values in the train dataset.
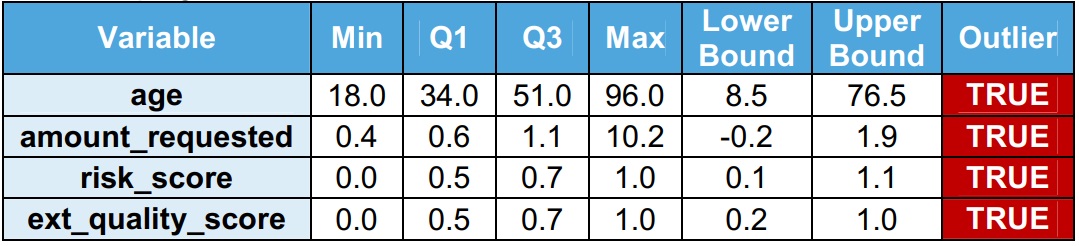
It is observed that there are outliers in the train dataset. Inter Quartile Range (IQR = Q3 – Q1) is used to identify the outlets. Outliers are values more than the upper bound (Q1 + 1.5 x IQR) or values less than the lower bound (Q1 – 1.5 x IQR). The validation team recommends that the outliers should be treated before developing the model.
from statsmodels.stats.outliers_influence import variance_inflation_factor
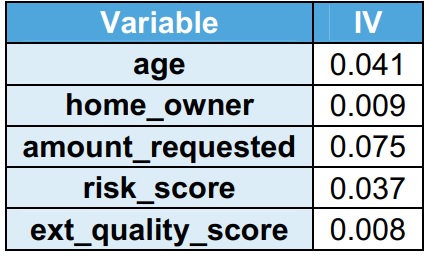
The explanatory power of the variable is captured using IV. As the explanatory power of the variable increases, the IV increases. It is observed that all the variables have IV < 0.1, indicating have low explanatory power in the train dataset.
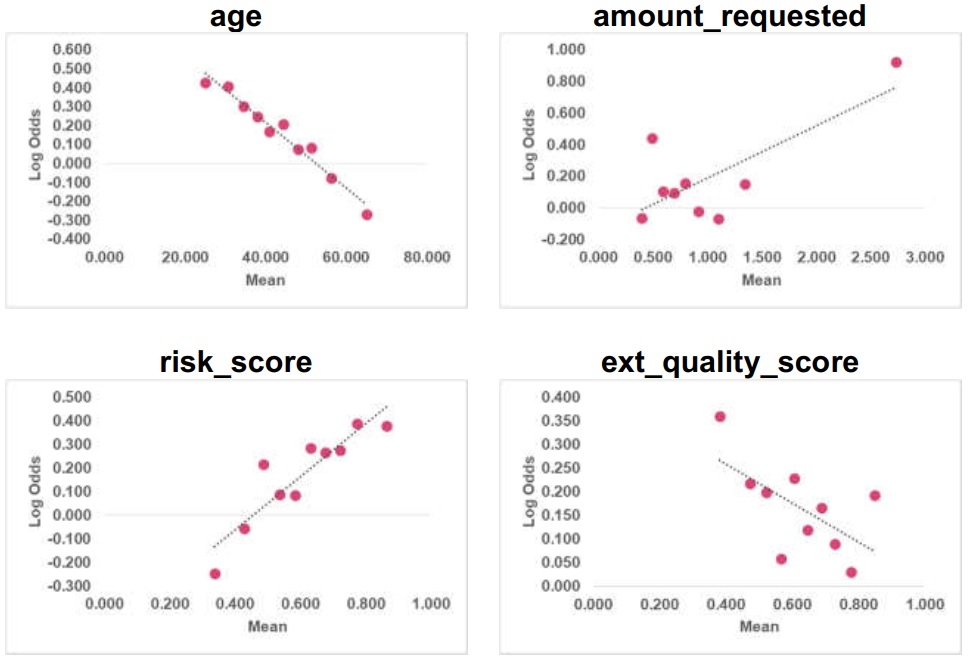
Linearity is checked for the numerical variables (age, amount_requested, risk_score, and ext_quality_score) in the train data. It is observed that age & risk_score are linear and amount_requested & ext_quality_score are non-linear. The validation team recommends that the transformations should be tested for getting a linear relationship.
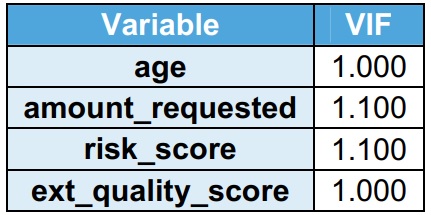
VIF indicates the multicollinearity between the independent variables. It is observed that their VIF is less than 2 in the training dataset. VIF less than 2 indicates no multicollinearity. Home_owner is a flag, hence not considered for VIF.
sklearn.metrics.auc(x, y)
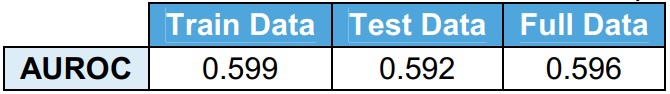
The area under Receiver Operator Curve (AUROC) is used to measure the predictive power of the model. AUROC = 0.50 indicates no predictive power and AUROC = 1.00 indicates perfect predictive power. The model developed on train data is run on test data and full data. It is observed that there is not a significant deviation in the AUROC values.
It is observed that AUROC is less than 0.6. This indicates that the model does not have good predictive power. The validation team recommends using additional variables to improve the model fit.
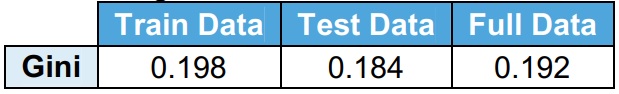
Gini is derived from AUROC. Gini = 0.0 indicates no predictive power and Gini = 1.0 indicates perfect predictive power. The model developed on train data is run on test data and full data. It is observed that there is not a significant deviation in the Gini values.
scipy.stats.ks_2samp
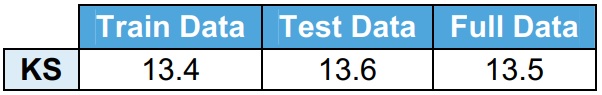
Kolmogorov-Smirnov (KS) test measures the separation between cumulative % event and cumulative % non-event. It is observed that KS test statistics are less than 40, indicating that the model is not able to separate events and non-events.
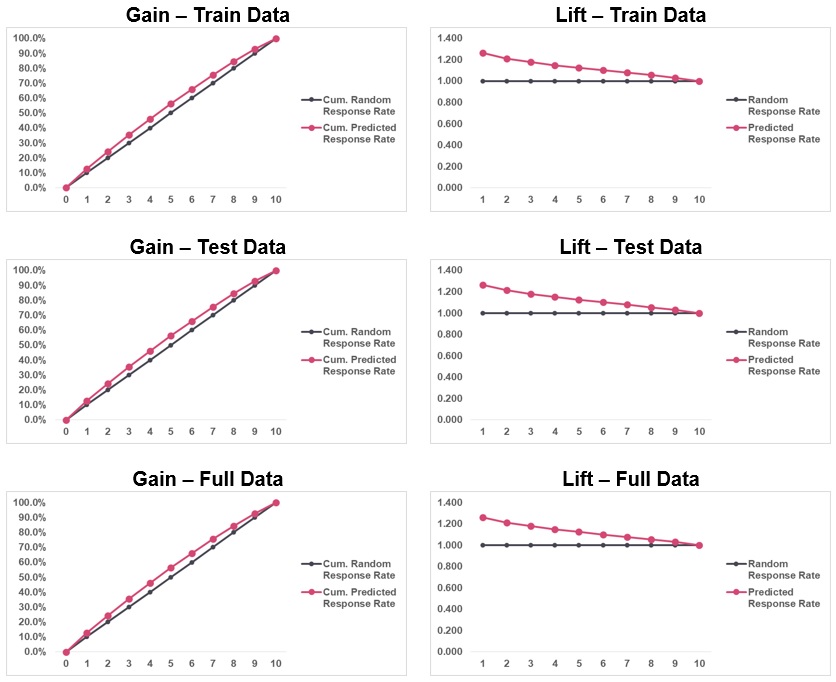
Gain & lift charts are data visualization tools that compare the ability of the classifier to capture the response rate. It is observed that the cumulative predicted response rate is very close to the cumulative random response rate. It indicates that the model has low predictive power. The validation team recommends using additional variables to improve the model fit.
The sensitivity of the model with respect to the independent numerical variables is tested. The sensitivity is checked on the train data. The objective of this exercise is to identify the most sensitive variables. It is observed that age and risk_score are the most sensitive variables and ext_quality_score is the least sensitive variable.
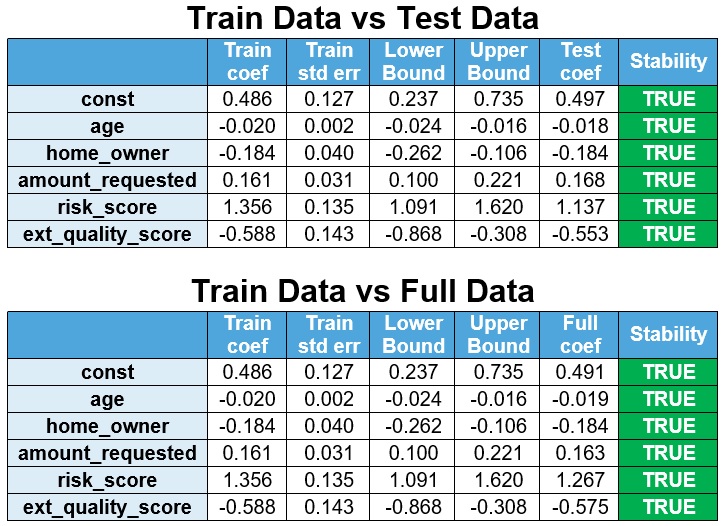
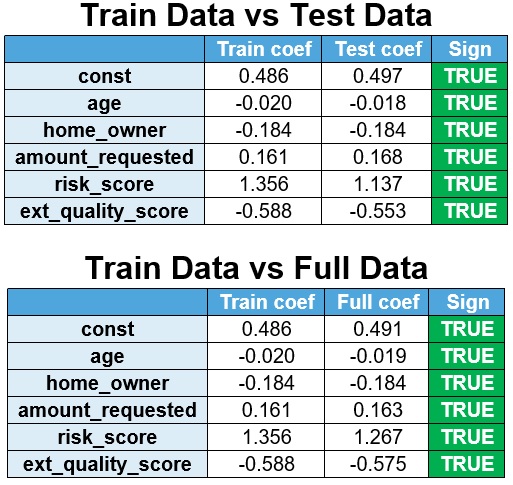
The model is re-estimated on test data & full data and the coefficients are compared with the train data. If the coefficients of the re-estimated model are within the 95% confidence interval (Train coef ± 1.96 x Train std err) then the coefficients are stable.
The lower bound is defined as Train coef – 1.96 x Train std err and the upper bound is defined as Train coef + 1.96 x Train std err. It is observed that the coefficients are stable.
The model is re-estimated on test data & full data and the coefficients are compared with the train data.
It is observed that the signs are stable.
The validation found the model to be stable. However, three severity findings have been raised:
· Finding 1 (input data) – It is observed that there are outliers in the train dataset. The validation team recommends that the outliers should be treated before developing the model.
· Finding 2 (input data) – It is observed that amount_requested & ext_quality_score are non-linear. The validation team recommends that the transformations should be tested for getting a linear relationship.
· Finding 3 (model fit) – It is observed that AUROC is low, Gini is low and KS is low indicating that the model is not able to separate events and non-events. The validation team recommends using additional variables to improve the model fit.
The media shown in this article are not owned by Analytics Vidhya and is used at the Author’s discretion.
GPT-4 vs. Llama 3.1 – Which Model is Better?
Llama-3.1-Storm-8B: The 8B LLM Powerhouse Surpa...
A Comprehensive Guide to Building Agentic RAG S...
Top 10 Machine Learning Algorithms in 2026
45 Questions to Test a Data Scientist on Basics...
90+ Python Interview Questions and Answers (202...
8 Easy Ways to Access ChatGPT for Free
Prompt Engineering: Definition, Examples, Tips ...
What is LangChain?
What is Retrieval-Augmented Generation (RAG)?
Edit
Resend OTP
Resend OTP in 45s