 |
VOOZH | about |
|
VOOZH | about |
This article was published as a part of the Data Science Blogathon
” DVC brings agility, reproducibility, and collaboration into your existing data science workflow “
In a typical data science project, the scientists and machine learning experts deal with a large volume of data of various kinds. There are multiple models built with varying configurations, features, with multiple iterations of parameters tuning to get the best performing model. In such a scenario, all the changes we make to data and in the model building process need to be tracked and measured for us to understand what has worked and what has not. It also is necessary to have the option to go back to a specific version and investigate past results. One such tool which lets us track all of this is Data Version Control (DVC) which helps in governing the data, the underlying model and run reproducible results.
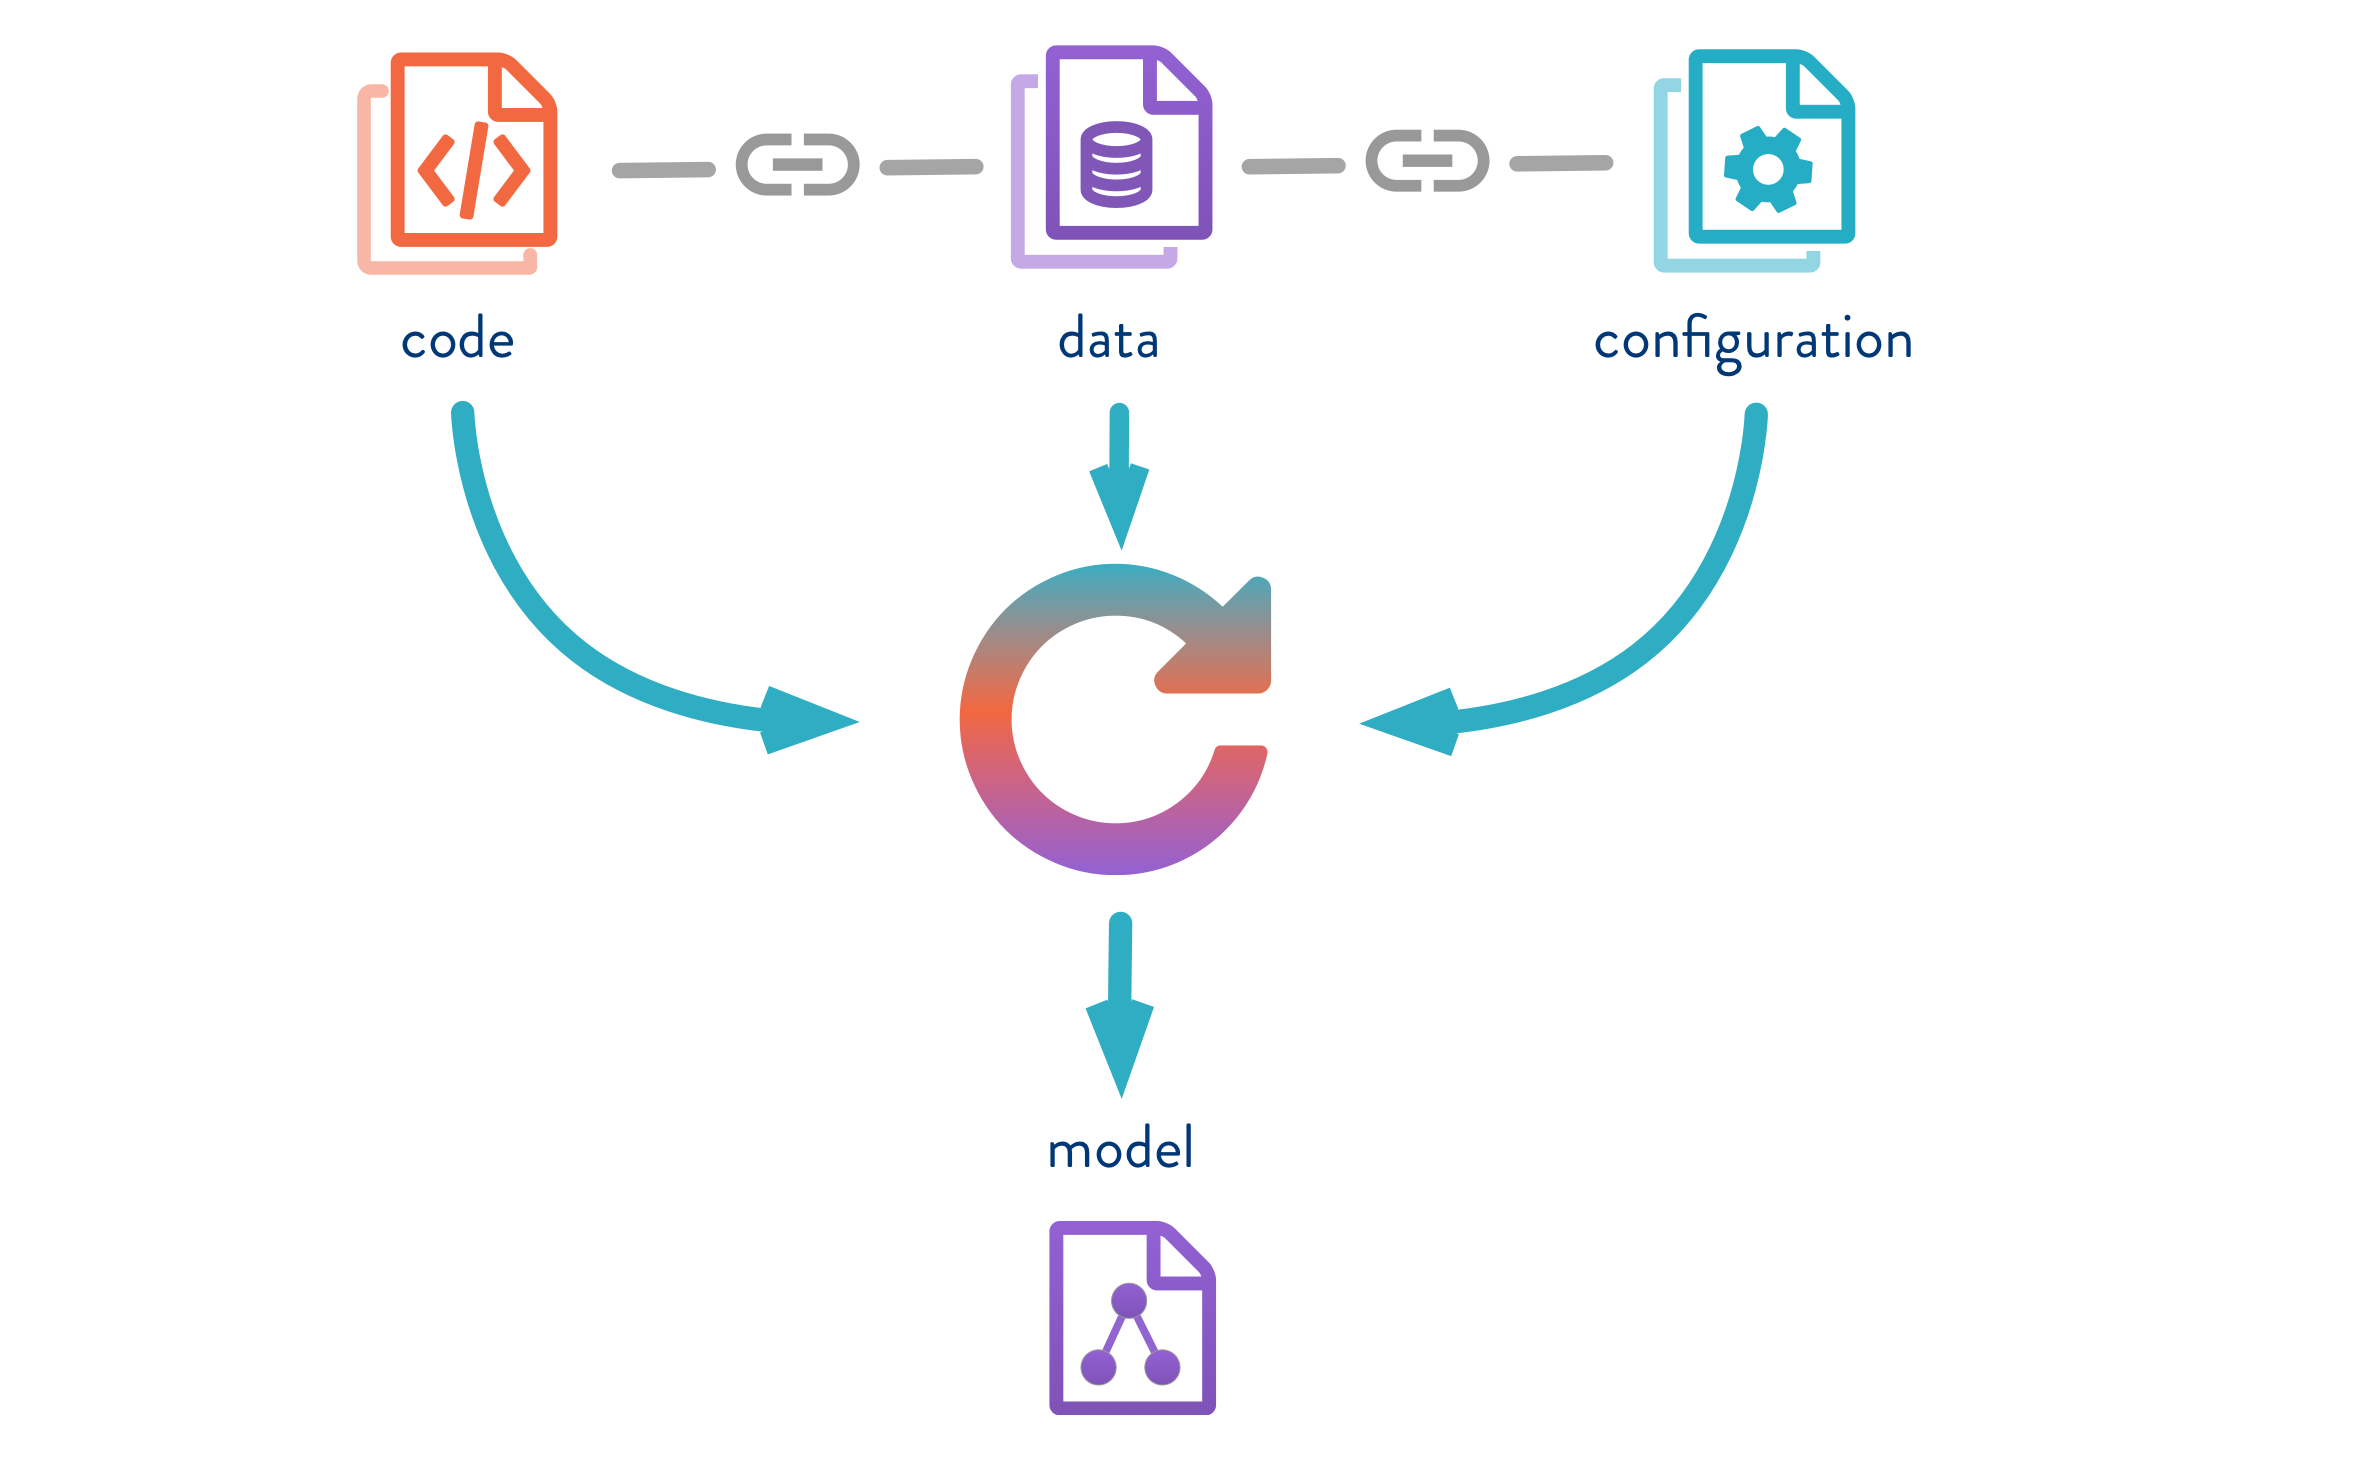
Data Version Control, or DVC, is a data and ML experiment management tool that takes advantage of the existing engineering toolset that we are familiar with (Git, CI/CD, etc.). DVC is meant to be run alongside Git. The git and DVC commands will often be used in tandem, one after the other. While Git is used to storing and version code, DVC does the same for data and model files.
In this blog, we will explore and learn the following:
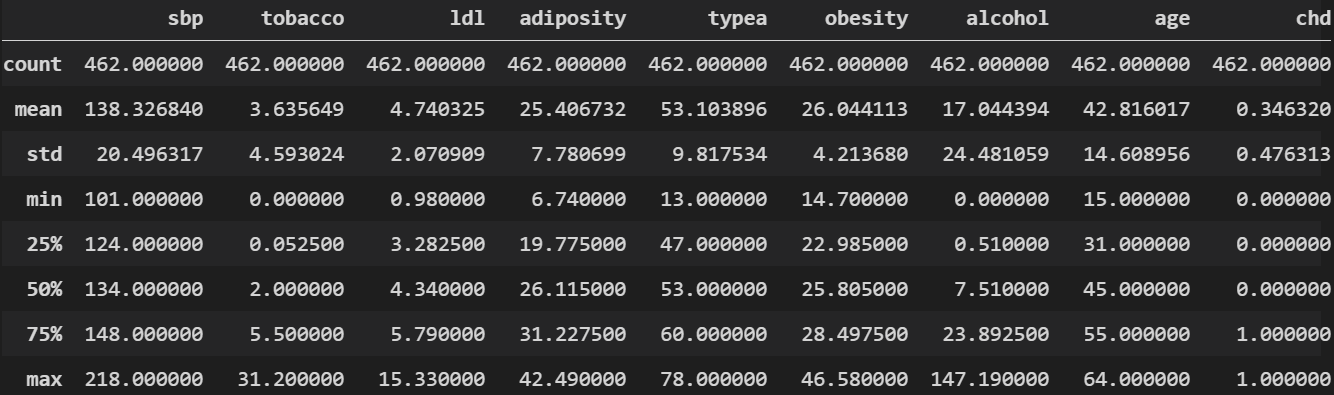
Here is a quick snap of basic stats from our data:
To start with, our project folder structure is as below. As we process the files in the later sections, each of these folders will have respective files in them.
The configuration plays a key role in setting up a workflow and also to keep the code clean and improve readability. We will use the YAML file format to define our configurations in stages. To know more about configs, please read my previous blog Reproducible ML Reports Using YAML Configs
Create a file by name param.yaml and have the below configuration defined:
base:
 project: SAHeart-project
 random_state: 999
 target_col: chd
.........
split_data:
 train_path: data/processed/train_SAHeart.csv
 test_path: data/processed/test_SAHeart.csv
 test_size: 0.25
model_dir: saved_models
Please refer to the complete code on GitHub
Let’s create a python file by the name get_data.py where we will load the data and carry out basic data processing. The processed data will be saved in the data_given folder which we had created in an earlier section
...........
def read_params(config_path):
 with open(config_path) as yaml_file:
 config = yaml.safe_load(yaml_file)
 return config
def get_data(config_path):
 config = read_params(config_path)
 data_path = config["data_source"]["s3_source"]
 df = pd.read_csv(data_path, sep=",", encoding='utf-8')
 df = pd.get_dummies(df, columns = ['famhist'], drop_first=True)
 df.drop("sbp",axis=1, inplace=True)
 return df
..........
Please refer to the complete code on GitHub
We will create a python file load_data.py and load the data from our previous stage and save it in ./raw folder which we had created earlier
.......
def load_and_save(config_path):
 config = read_params(config_path)
 df = get_data(config_path)
 df = df.dropna()
 new_cols = [col.replace(" ", "_") for col in df.columns]
 raw_data_path = config["load_data"]["raw_dataset_csv"]
 df.to_csv(raw_data_path, sep=",", index=False, header=new_cols)
.......
Please refer to the complete code on GitHub
Our next stage would be to split the data into train and test which is an essential step before model building. There will be two files created train_SAHeart.csv and test_SAHeart.csv. These two files will be saved under data/processed folder
.............
 train, test = train_test_split(
 df,
 test_size=split_ratio,
 random_state=random_state
 )
 train.to_csv(train_data_path, sep=",", index=False, encoding="utf-8")
 test.to_csv(test_data_path, sep=",", index=False, encoding="utf-8")
.............
Please refer to the complete code on GitHub
This is the last of four stages – the model building where we will build a binary classification model using Logistic Regression. Lets create a python file by name train_and_evaluate.py with the below code. In the end, the model in the pickle format is saved under the/saved_models folder.
...........
def train_and_evaluate(config_path):
 config = read_params(config_path)
 test_data_path = config["split_data"]["test_path"]
 train_data_path = config["split_data"]["train_path"]
 random_state = config["base"]["random_state"]
 model_dir = config["model_dir"]
 target = [config["base"]["target_col"]]
 train = pd.read_csv(train_data_path, sep=",")
 test = pd.read_csv(test_data_path, sep=",")
 train_y = train[target]
 test_y = test[target]
 train_x = train.drop(target, axis=1)
 test_x = test.drop(target, axis=1)
 # Build logistic regression model
 model = LogisticRegression(solver='saga', random_state=0).fit(train_x, train_y)
 # Report training set score
 train_score = model.score(train_x, train_y) * 100
 print(train_score)
 # Report test set score
 test_score = model.score(test_x, test_y) * 100
 print(test_score)
.............
Please refer to the complete code on GitHub
At this stage, our project structure is as below. The files highlighted are the ones that we generated from our previous four stages.
+---data
| +---processed
| | test_SAHeart.csv
| | train_SAHeart.csv
| ---raw
| SAHeart.csv
+---data_given
| SAHeart.csv
+---report
+---saved_models
| model.joblib
---src
 | get_data.py
 | load_data.py
 | split_data.py
 | train_and_evaluate.py
If you don’t have DVC Install then install as below. For more information refer install DVC
pip install dvcGetting started with DVC:
Assuming you have already installed DVC, initiate DVC as below. This is very similar to initiating git.
dvc init
Mapping remote storage: We need to tell DVC where our remote storage is on local machine.
dvc add . /data_given/SAHeart.csv
Note: DVC supports many cloud-based storage systems, such as AWS S3 buckets, Google Cloud Storage, and Microsoft Azure Blob Storage. You can find out more in the official DVC documentation for the dvc remote add command.
We have successfully installed DVC and mapped our dataset to bed tracked & versioned by DVC.
Create metrics file: Let’s create JSON file under-report folder by name scores.json where we will write some of the key results we need to track. Remember, in our last section, we had created a report folder but didn’t have any file under it.
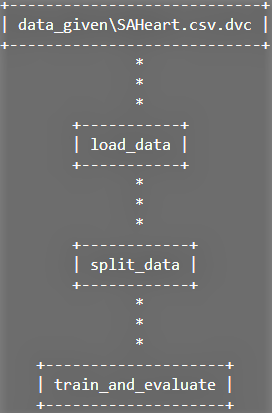
DVC pipelines are effectively version-controlled steps in a typical machine learning workflow (e.g. data loading, pre-processing, data splitting, model building, metrics measurement, etc.). we will define the dependencies and outputs. Under the hood, DVC is building up a Directed Acyclic Graph (DAG) which is a fancy way of saying a series of steps that can only be executed in one direction.
dvc dag
Let’s create a YAML file by the name dvc.yaml where we define all the stages of the pipeline. In the below sample code we are defining the command that needs to execute with all the dependent files and also the output which in this case is SAHeart.csv file to be placed under /data/raw folder
stages:
 load_data:
 cmd: python src/load_data.py --config=params.yaml
 deps:
 - src/get_data.py
 - src/load_data.py
 - data_given/SAHeart.csv
 outs:
 - data/raw/SAHeart.csv
We will define the remaining stages on similar lines as below:
.......
 split_data:
 cmd: python src/split_data.py --config=params.yaml
 deps:
 - src/split_data.py
 - data/raw/SAHeart.csv
 outs:
 - data/processed/train_SAHeart.csv
 - data/processed/test_SAHeart.csv
 train_and_evaluate:
 cmd: [python src/train_and_evaluate.py --config=params.yaml, dvc plots show]
 deps:
 - data/processed/train_SAHeart.csv
 - data/processed/test_SAHeart.csv
 - src/train_and_evaluate.py
 metrics:
 - report/scores.json:
 cache: false
.......
Please refer to the complete code on GitHub
At this stage, we have our model built, DVC installed and setup, defined pipeline with dvc.yaml file. Lets run the pipeline to see if all the stages are executed sequentially as defined.
dvc repro
## Here is the output
'data_givenSAHeart.csv.dvc' didn't change, skipping
Running stage 'load_data':
> python src/load_data.py --config=params.yaml
Updating lock file 'dvc.lock'
Running stage 'split_data':
> python src/split_data.py --config=params.yaml
Updating lock file 'dvc.lock'
Running stage 'train_and_evaluate':
> python src/train_and_evaluate.py --config=params.yaml
.....
.....
To track the changes with git, run:
 git add dvc.lock
Use `dvc push` to send your updates to remote storage.
Ahh !!. All our stages are executed successfully. I have trimmed the output to keep it clean and precise. The dvc also automatically creates a file by name dvc.lock which tracks all the changes. Lets take a look at the content of this file.
schema: '2.0'
stages:
 load_data:
 cmd: python src/load_data.py --config=params.yaml
 deps:
 - path: data_given/SAHeart.csv
 md5: d75f04589cb6fb8dce5772ed762a5621
 size: 22761
 - path: src/get_data.py
 md5: cd5029054879f4cdebb4f105ef891912
 size: 774
 - path: src/load_data.py
 md5: fd8ed8a4e1d3a894523c33f274a42ba1db
 size: 693
 outs:
 - path: data/raw/SAHeart.csv
 md5: 9bcb98547eea864e13d075f2f0e17cea9
 size: 19013
If you observe, the structure of the file is similar to dvc.yaml but the content is different. It has created an identifier to track every single change that goes in the pipeline.
As our pipeline has completed its task successfully, lets look at some of the model metrics that are of our interest. Remember, we had created report/scores.json file in the earlier section?. This file would have the metrics data and it was populated with data during the model building stage. Let’s take a look.
dvc metrics show
## Here is the output
Path Logistic Accuracy roc_auc test_score train_score
reportscores.json 0.62069 0.65093 62.06897 71.96532
Note: Our focus is not on model metrics or on improving it further but on building a reproducible pipeline with DVC to help us track our experiment.
Let’s push the code to github before proceeding further.
git add . && git commit -m "experiment with dvc" && git push origin main
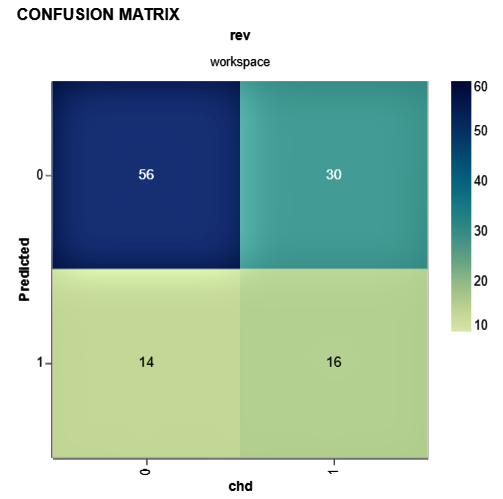
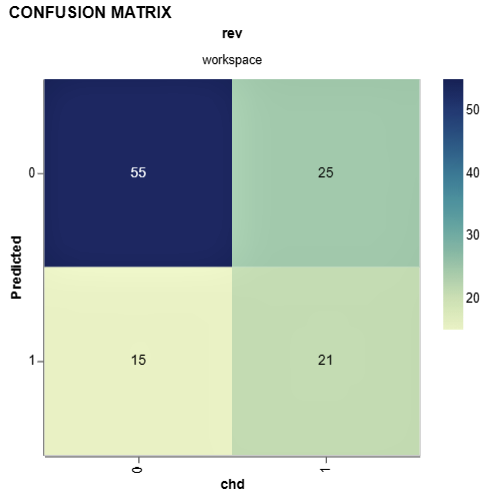
As we have built a binary classification model, it will be good to see the confusion matrix. DVC provides plot templates and in this case, we will use the confusion matrix template. We will also set the x (Actual value from test data i.e. target (chd)) and y axis (predicted value from our model).
dvc plots show cm.csv --template confusion -x chd -y Predicted
## Here is the output. The confusion matrix is generated in HTML and saved in current directory
file://C:/Desktop/Versioning-ML-Models-datasets-With-DVC/plots.html
Let’s now experiment by changing some of the parameters and re-running dvc pipeline.
| Here are the changes: | ||||
|
Let’s run the DVC pipeline and also check metrics.
dvc repro
dvc metrics show
Well, we have some improvement compared to the last iteration. Let’s compare it with DVC.
dvc metrics diff
## Here is the comparision of both the iterations
Path Metric Old New Change
reportscores.json Logistic Accuracy 0.62069 0.65517 0.03448
reportscores.json roc_auc 0.65093 0.72764 0.07671
reportscores.json test_score 62.06897 65.51724 3.44828
reportscores.json train_score 71.96532 74.27746 2.31214
Let’s check confusion matrix as well for this iteration:
dvc plots show cm.csv --template confusion -x chd -y Predicted
We just wrote one line of code to reproduce the entire pipeline, that’s the simplicity DVC brings to ML experiments.
You have learned how to use Data Version Control to create experiments!. For every experiment you run, you can version the data you use and the model you train. The best part is you can place your high-volume dataset on remote(cloud) and use DVC to point to the data source saving disk space on your local and on Github. And moreover, the experiments are reproducible, and anyone can repeat what you’ve done.
I hope this article was useful. Good luck with all your experiments !!!!
You can connect with me – Linkedin
You can find the code for reference – Github
https://dvc.org/
https://unsplash.com/
The media shown in this article are not owned by Analytics Vidhya and are used at the Author’s discretion.
I am a Data Science enthusiast with experience in building predictive models, data processing, and data mining algorithms to solve challenging business problems. Involved in open source community and passionate about building data apps.
GPT-4 vs. Llama 3.1 – Which Model is Better?
Llama-3.1-Storm-8B: The 8B LLM Powerhouse Surpa...
A Comprehensive Guide to Building Agentic RAG S...
Top 10 Machine Learning Algorithms in 2026
45 Questions to Test a Data Scientist on Basics...
90+ Python Interview Questions and Answers (202...
8 Easy Ways to Access ChatGPT for Free
Prompt Engineering: Definition, Examples, Tips ...
What is LangChain?
What is Retrieval-Augmented Generation (RAG)?
Edit
Resend OTP
Resend OTP in 45s