 |
VOOZH | about |
|
VOOZH | about |
Outliers are extreme values that lie far away from the majority of the data points in a dataset. These values do not follow the general pattern of the data and can occur due to various reasons like data entry mistakes, measurement errors or natural variations. For example if most people in a group weigh between 50-70 kg and one person weighs 150 kg that person's weight is considered an outlier because it is higher than the others.
Outliers can be classified into two types:
We should Handle Outliers because they can lead to:
Ignoring outliers can lead to incorrect conclusions and poor model performance in regression and clustering tasks. There are several methods to identify outliers in Python:
Visualization is one of the easiest ways to spot outliers. It gives a clear picture of the data distribution. Here we will be using Pandas, Numpy, Seaborn and Matplotlib libraries to implement these.
A box plot shows the minimum, first quartile (Q1), median, third quartile (Q3) and maximum values of the dataset. Outliers are typically plotted as individual points.
Output:
👁 ImageThe plot will represents the interquartile range with a line for the median. The data point at 150 will be marked separately as an outlier.
A scatter plot helps to visualize the relationship between two variables and spot any unusual data points.
Output:
👁 ImageThis above plot show each data point along the y-axis. The point at 150 will stand out clearly above the others.
Histogram displays the frequency distribution of a dataset making it easier to identify outliers by looking at extremely low or high frequency bars.
Output:
👁 ImageThe histogram show most values grouped around 22-30 with the outlier 150 appearing far away from the rest of the data.
We have statistical methods also to detect outliers that are:
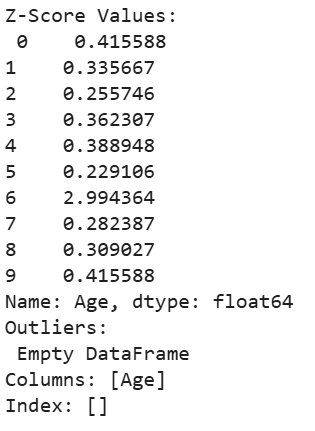
Z-Score method calculates how many standard deviations a data point is from the mean. Data points with a Z-score greater than 3 or less than -3 are considered outliers.
Output:
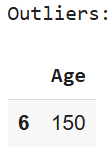
Interquartile Range (IQR)method identifies outliers by measuring the spread between the first quartile (Q1) and third quartile (Q3). Any data point below or above is considered an outlier.
Output:
Once we have detected outliers we can handle them using different methods:
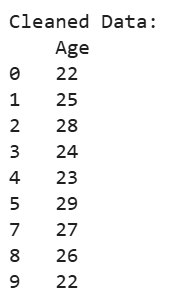
If the outliers are due to data entry errors or measurement mistakes, removing them is the best option. This method works well if the outliers are not important for analysis. Now see how it can be done.
Output:
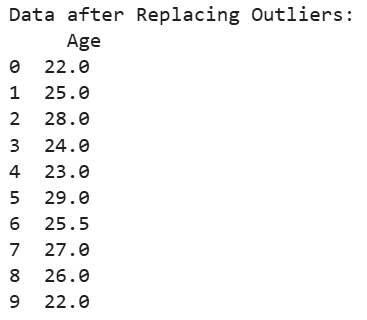
In some cases outliers can be replaced with statistical measures like mean or median to reduce their impact without losing data. Median is preferred because it is less affected by extreme values.
Output:
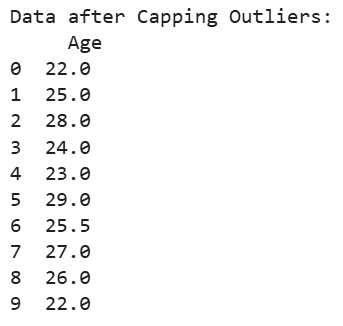
Capping limits the extreme values to predefined upper and lower bounds ensures no value exceeds these limits.
Output:
Handling outliers effectively is important for accurate data analysis and building reliable machine learning models.