 |
VOOZH | about |
|
VOOZH | about |
The only agent that thinks for itself
Autonomous Monitoring with self-learning AI built-in, operating independently across your entire stack.
Centralized metrics streaming and storage
Aggregate metrics from multiple agents into centralized Parent nodes for unified monitoring across your infrastructure.
Fully managed cloud platform
Access your monitoring data from anywhere with our SaaS platform. No infrastructure to manage, automatic updates, and global availability.
Deploy Netdata Cloud in your infrastructure
Run the full Netdata Cloud platform on-premises for complete data sovereignty and compliance with your security policies.
Powerful, intuitive monitoring interface
Modern, responsive UI built for real-time troubleshooting with customizable dashboards and advanced visualization capabilities.
Monitor on the go
Native iOS and Android apps bring full monitoring capabilities to your mobile device with real-time alerts and notifications.
The future of infrastructure observability
See our strategic direction across AI-native observability, full-stack signals, operational intelligence, and enterprise platform maturity.
Best energy efficiency
True real-time per-second
100% automated zero config
Centralized observability
Multi-year retention
High availability built-in
Zero maintenance
Always up-to-date
Enterprise security
Complete data control
Air-gap ready
Compliance certified
Millisecond responsiveness
Infinite zoom & pan
Works on any device
Native performance
Instant alerts
Monitor anywhere
AI-native observability
Continuous delivery
Open source foundation
80% Faster Incident Resolution
True Real-Time and Simple, even at Scale
90% Cost Reduction, Full Fidelity
See and Map Your Entire Network
Single Pane of Glass
Control Without Surrender
Integrations
800+ collectors and notification channels, auto-discovered and ready out of the box.
Reduced monitoring costs by 46% while cutting staff overhead by 67%.
— Leonardo Antunez, Codyas
No data shipping. No central storage costs. Query at the edge.
So many out-of-the-box features! I mostly don't have to develop anything.
— Simon Beginn, LANCOM Systems
Point-and-click troubleshooting. No PromQL, no LogQL, no learning curve.
Enterprise efficiency without enterprise complexity—real ROI from day one.
— Leonardo Antunez, Codyas
Zero data egress. Only metadata reaches the cloud. Your metrics stay on your infrastructure.
Auto-discovered and configured. No manual setup required.
Slack, PagerDuty, Teams, email, webhooks—all built-in.
Built for the People Who Get Paged
Every Industry Has Rules. We Master Them.
Monitor Any Technology. Configure Nothing.
Complete Visibility. Total Control.
Don't Take Our Word for It
Netdata gives more than you invest in it. A rare unicorn that obeys the Pareto rule.
— Eduard Porquet Mateu, TMB Barcelona
Reduced website downtime by 99% and cloud bill by 30% using Netdata alerts.
— Falkland Islands Government
Optimized resource allocation based on Netdata alerts cut cloud spending by 30%.
— Falkland Islands Government
Reduced monitoring staff by 67% while cutting operational costs by 46%.
— Codyas
Netdata has agent capacity or a plugin for everything, including Windows and Kubernetes.
— Eduard Porquet Mateu, TMB Barcelona
So many out-of-the-box features! I mostly don't have to develop anything.
— Simon Beginn, LANCOM Systems
From 2-3 minutes to 30 seconds—instant visibility into any node issue.
— Matthew Artist, Nodecraft
20% less downtime and 40% budget optimization from out-of-the-box monitoring.
— Simon Beginn, LANCOM Systems
Pay per Node. Unlimited Everything Else.
One price per node. Unlimited metrics, logs, users, and retention. No per-GB surprises.
What's Your Monitoring Really Costing You?
Most teams overpay by 40-60%. Let's find out why.
Your Infrastructure Is Unique. Let's Talk.
Because monitoring 10 nodes is different from monitoring 10,000.
Monitoring That Sells Itself
Deploy in minutes. Impress clients in hours. Earn recurring revenue for years.
Per-Second Metrics at Homelab Prices
Same engine, same dashboards, same ML. Just priced for tinkerers.
$1,000 Per Referral. Unlimited Referrals.
Your colleagues get 10% off. You get 10% commission. Everyone wins.
"Netdata's significant positive impact" — LANCOM Systems
Compare vs Datadog, Grafana, Dynatrace
"Cut costs by 46%, staff by 67%" — Codyas
"Reduced cloud bill by 30%" — Falkland Islands Gov
"Better observability with Netdata than combining other tools." — TMB Barcelona
DPA, SLAs, on-prem, volume pricing
One command, 30 seconds, real data—no sandbox needed
Auto-config + per-node pricing = predictable profit
8-episode Netdata tutorial by LearnLinux.tv
3rd most starred monitoring project
Customers report 40-67% cost cuts, 99% downtime reduction
Free tier lets them try before they buy
AI Support Assistant, Available 24/7
Nedi has access to all official documentation, source code, and resources. Ask any question about Netdata—responds in your language.
Engineering Insights & Product Updates
Jun 2026
Network Monitoring, the Netdata Way: …
Interface counters tell you a port is busy. …
Jun 2026
5 Best SolarWinds Alternatives for 2026
As organizations modernize their …
Jun 2026
SolarWinds Price Increases 2026: What …
If you’re a SolarWinds customer facing …
May 2026
High-cardinality metrics at scale: why …
The “high cardinality is …
Never Fight Fires Alone
Docs, community, and expert help—pick your path to resolution.
60 Seconds to First Dashboard
One command to install. Zero config. 850+ integrations documented.
Level Up Your Monitoring
76,000+ Engineers Strong
Per-Second. 90% Cheaper. Data Stays Home.
See why teams switch from Datadog, Prometheus, Grafana, and more.
> Browse all comparisonsTrace issues directly in the source code
Get architecture recommendations
One of the most popular open-source monitoring projects
Enterprise-grade security and compliance
Your metrics stay on your infrastructure
"Most energy-efficient monitoring solution" — ICSOC 2023, peer-reviewed
"Doesn't miss alerts—mission-critical trust for safety software"
Global community improving monitoring for everyone
Trusted by teams worldwide
Free forever, fully open source agent
Work from anywhere, async-friendly culture
Your work helps millions of systems
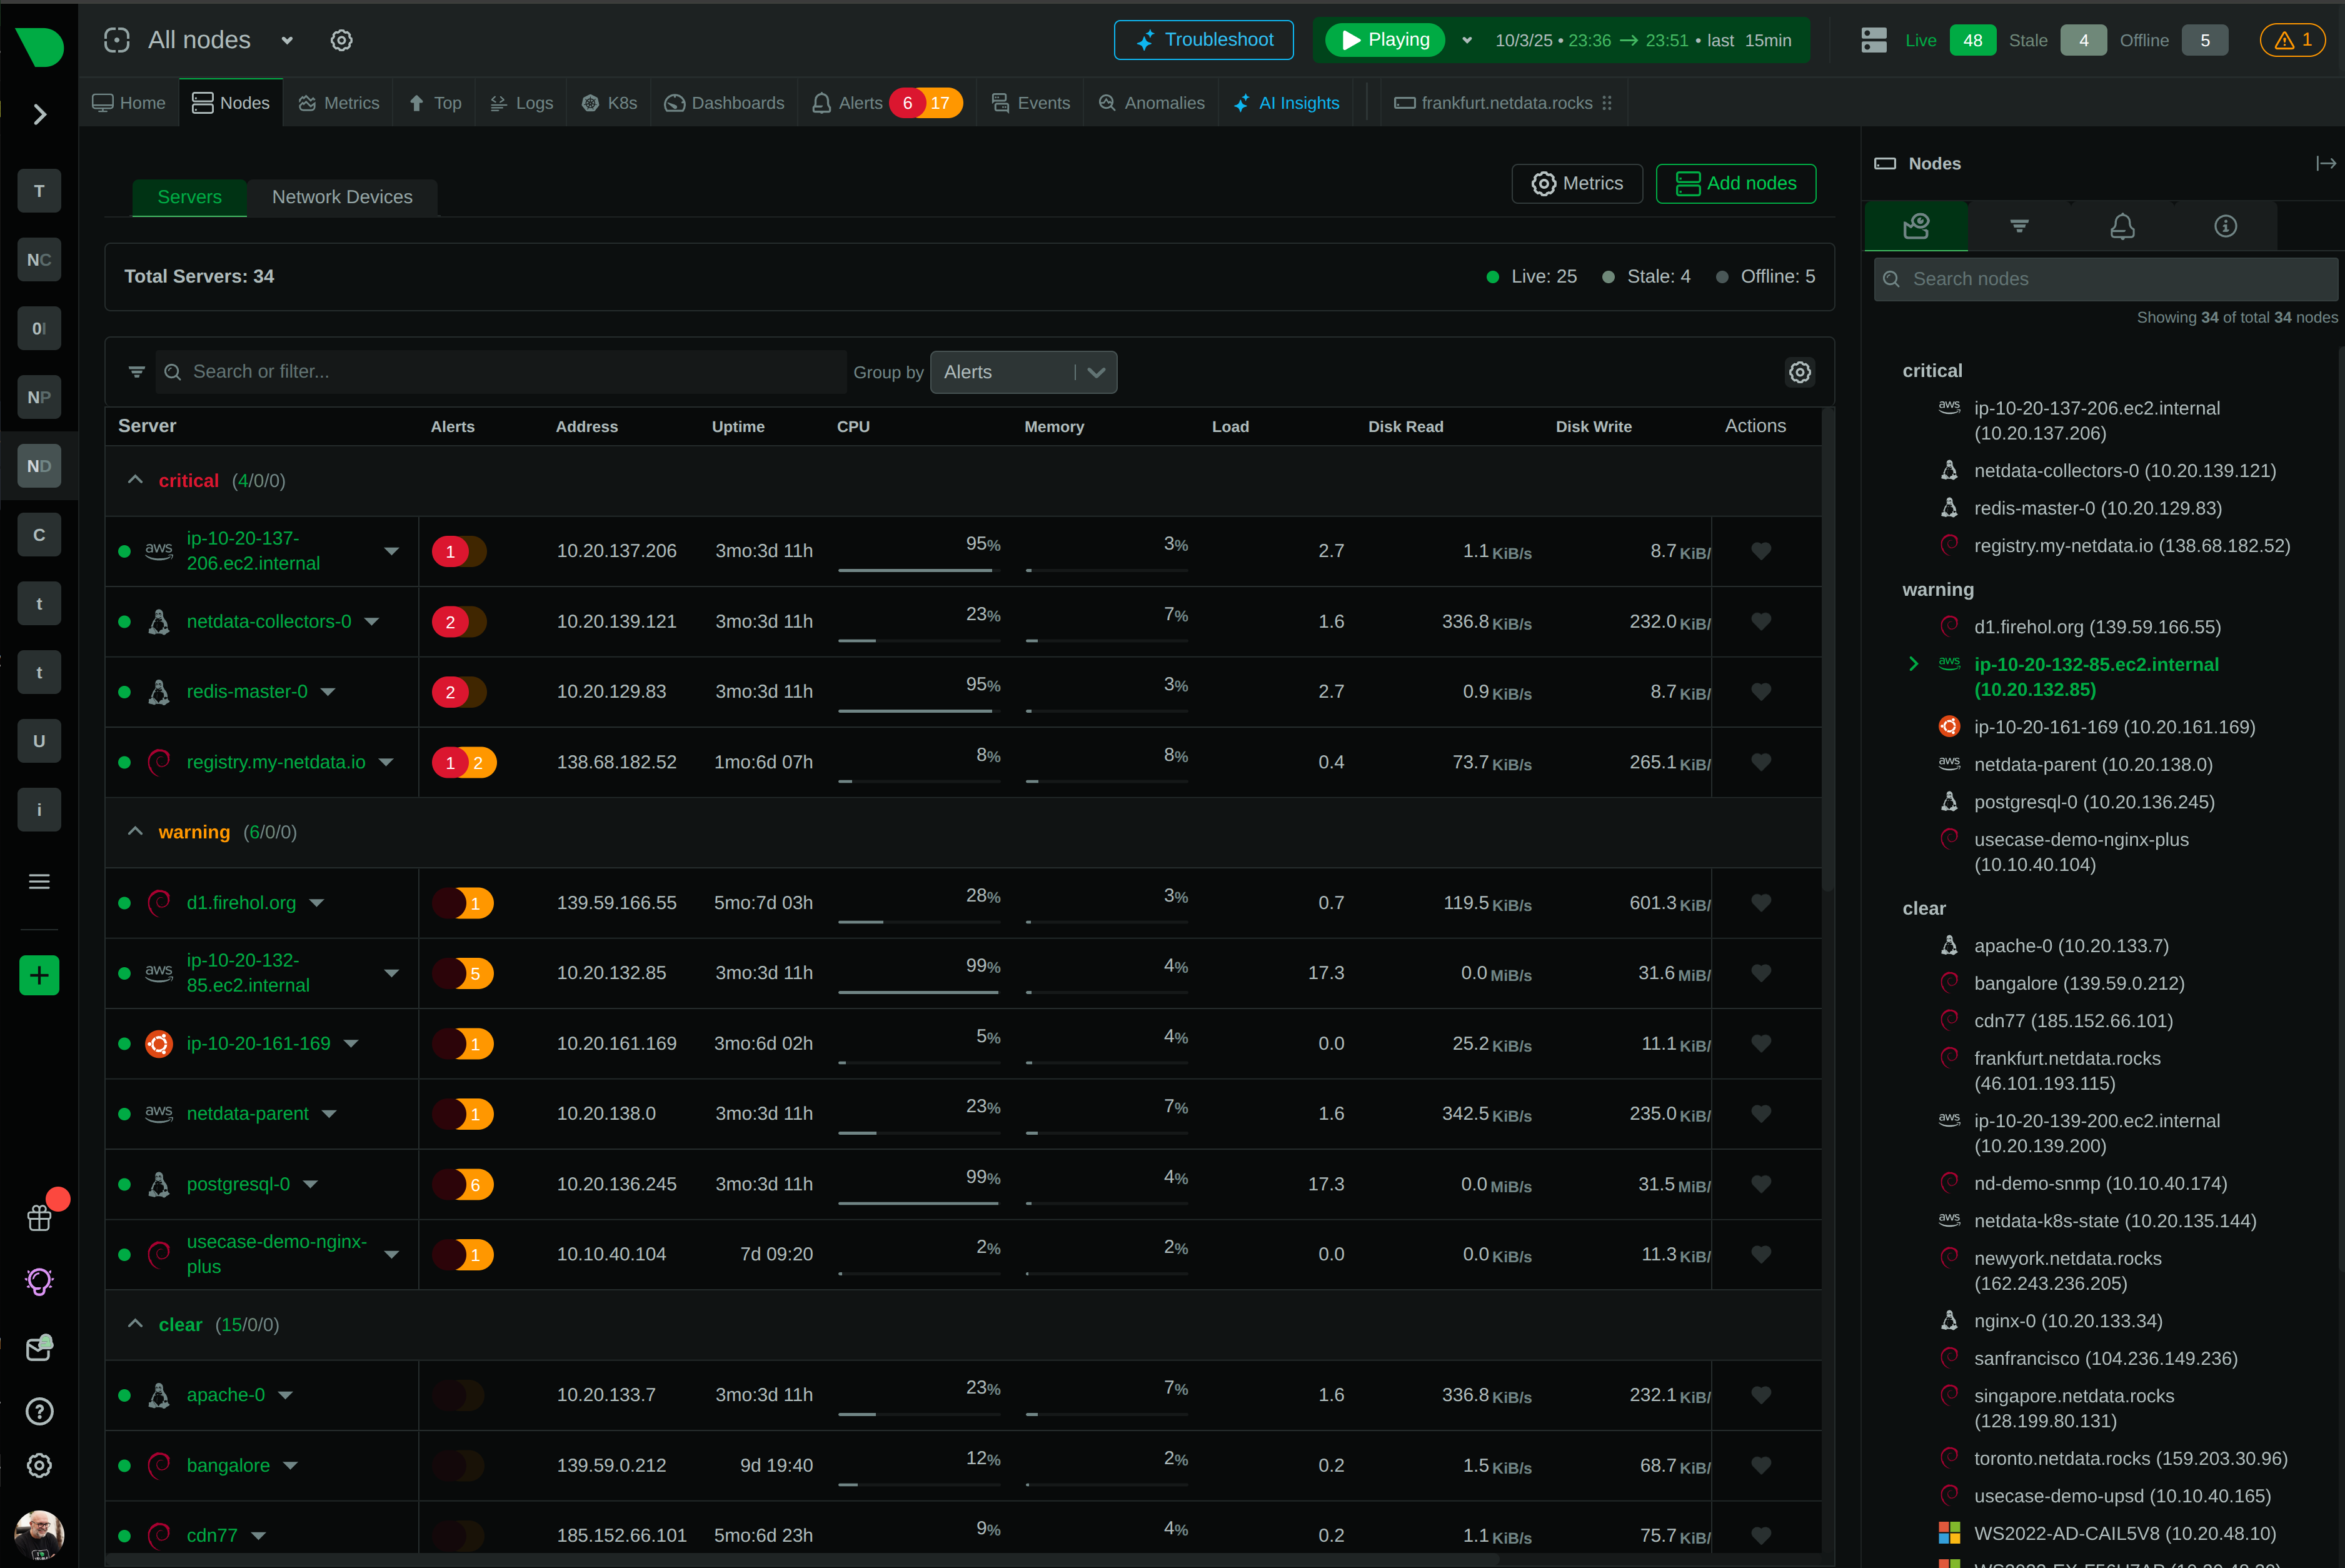
Algorithmic dashboards that generate automatically for every metric, instance, and node - eliminating months of manual configuration while delivering insights traditional dashboards can’t match.
Experience the power of dashboards designed by algorithms, not configurations
Deploy complete infrastructure monitoring in 60 seconds - 800+ integrations auto-discover and visualize everything without query languages or specialized expertise.
Every chart delivers 20-25× more capability than traditional dashboards - interactive drill-down, dynamic filtering, real-time statistics, and ML anomaly overlays in unified interface.
Point-and-click analysis replaces query languages - junior engineers gain expert-level visibility instantly through intuitive navigation that works identically across all infrastructure.
Dashboards evolve automatically as infrastructure changes - new containers appear instantly, deleted resources vanish cleanly, maintaining visibility through dynamic environments.
18 unsupervised models per metric detect anomalies automatically - 99% false positive reduction through consensus-based detection, with root cause surfaced in top 30-50 correlated metrics.
Edge-native architecture maintains per-second granularity from 1 to 100,000+ nodes - linear costs, distributed processing, no centralized bottlenecks or architectural rewrites.
Trusted by DevOps teams worldwide
60 seconds to first dashboard vs. months of manual configuration
See Installation Guide
Each chart = 20-25+ traditional dashboard panels
Explore NIDL Framework
Zero dashboard maintenance as infrastructure scales
Learn About Auto-Discovery
99% false positive reduction through 18-model consensus
Explore ML Capabilities
100,000+ nodes with per-second granularity maintained
Understand Scalability
80% MTTR reduction through AI-accelerated troubleshooting
Discover AI Features
The Algorithmic Advantage
See how algorithmic generation transforms observability from months-long projects into instant, comprehensive visibility
Capability
Netdata Algorithmic Dashboards
Traditional Manual Dashboards
Time to First Dashboard
✅ 60 Seconds
Instant visibility after installation
❌ Weeks to Months
Manual configuration and setup required
Configuration Required
✅ Minimal
Auto-discovery handles standard components
❌ Extensive
Templates, queries, panels, data sources
Query Language Expertise
✅ Not Required
Point-and-click analysis
❌ Mandatory
PromQL, SQL, or custom DSLs
Analytical Depth Per Chart
✅ Advanced
Complete analytical toolkit in every chart
⚠️ Basic
Single-purpose visualizations
Adaptation to Infrastructure Changes
✅ Automatic
Real-time discovery and visualization
❌ Manual Updates
Dashboard maintenance overhead
ML Anomaly Detection
✅ Built-In
18 models per metric, 99% false positive reduction
⚠️ Optional Add-On
Requires separate configuration
Maintenance Overhead
✅ Near-Zero
Self-organizing and self-updating
❌ Continuous
Dashboard drift and update burden
Team Onboarding Time
✅ Minutes
Intuitive interface, universal navigation
❌ Weeks to Months
Query language training required
Cost Structure
✅ Predictable Per-Node
Unlimited metrics, logs, users included
❌ Variable Per-Metric
Volume-based charges add unpredictably
Data Granularity
✅ Per-Second
1-second collection and visualization
⚠️ Per-Minute or Worse
10-60 second intervals typical
The NIDL framework (Nodes, Instances, Dimensions, Labels) structures all metrics consistently, enabling automatic generation of meaningful visualizations. Metric design IS dashboard design - there's no separate configuration step.
Foundation of algorithmic generation
Learn NIDL Framework800+ integrations automatically detect systems, containers, applications, and services - generating appropriate visualizations instantly. New resources appear within seconds, deleted resources vanish cleanly.
Comprehensive coverage from day one
Explore Integrations18 unsupervised ML models per metric train automatically, achieving 99% false positive reduction through consensus-based detection. Anomaly flags appear as visual overlays on every chart.
Intelligence without complexity
Discover ML CapabilitiesEdge-native processing maintains per-second granularity from 1 to 100,000+ nodes - each Agent operates independently while Netdata Cloud federates queries across distributed infrastructure.
Infinite scale without bottlenecks
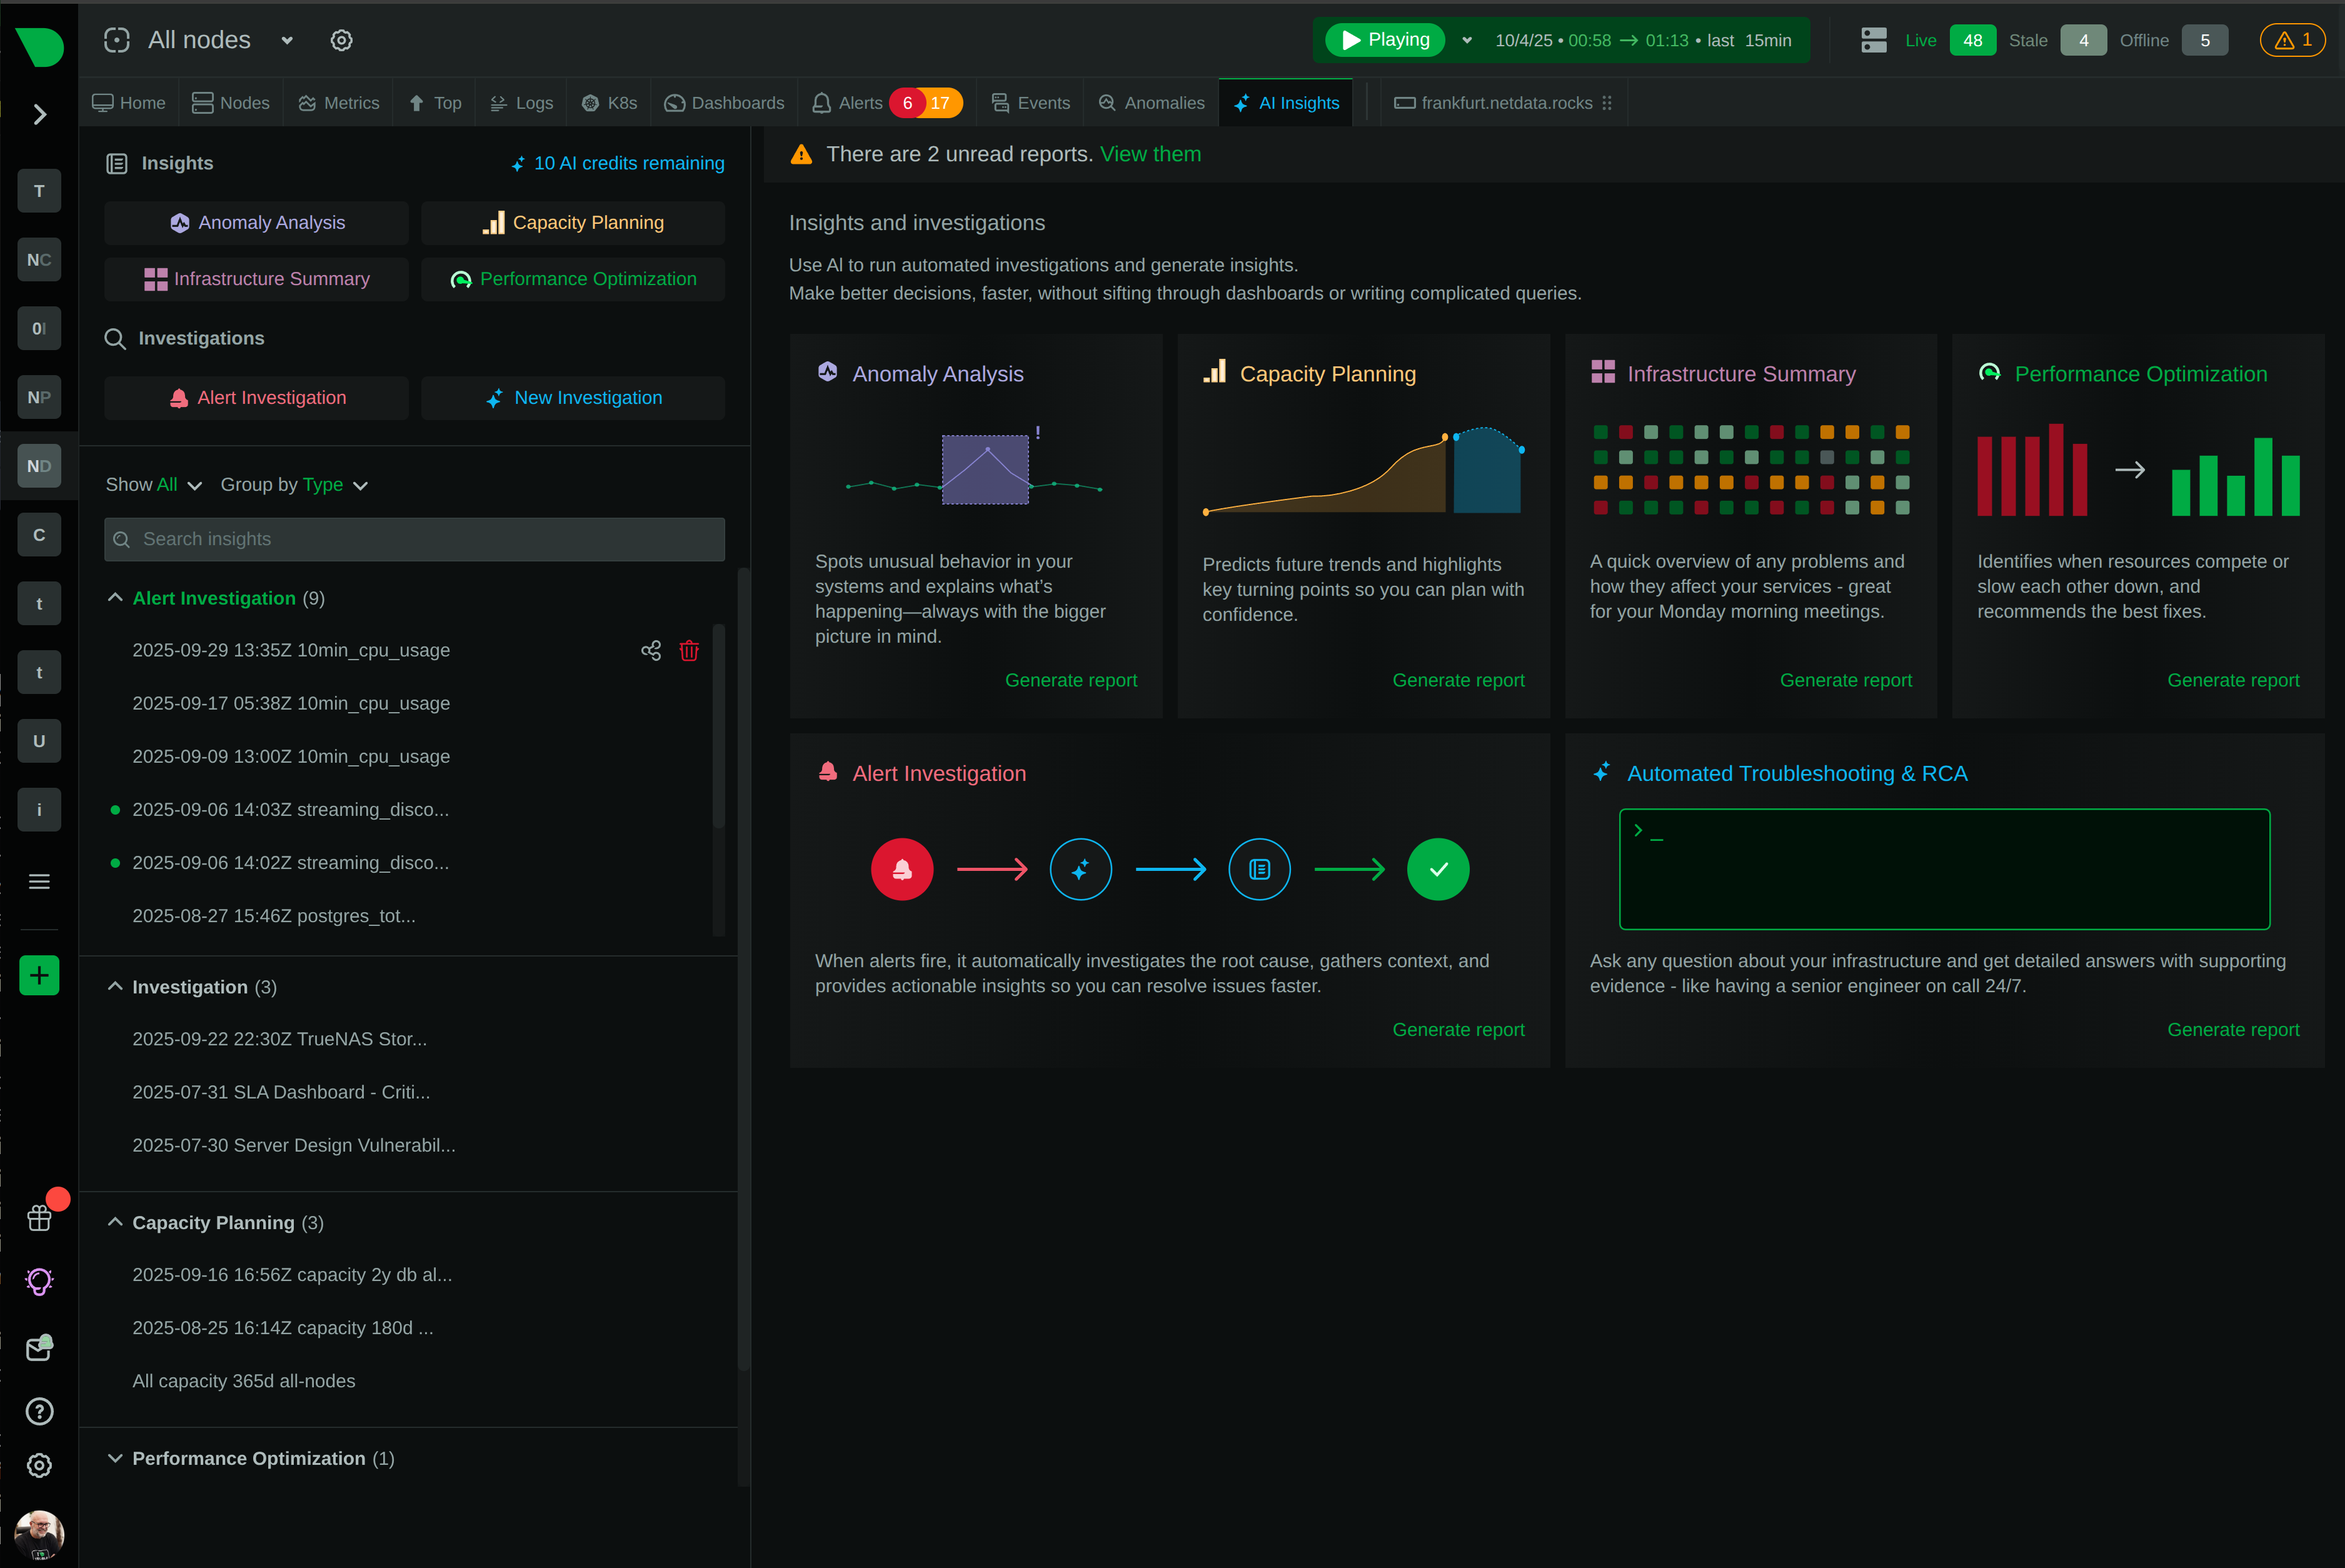
Understand ArchitectureAI Troubleshoot provides interactive investigation anywhere - ask questions in natural language, get answers based on actual infrastructure data. Choose managed AI or bring your own LLM via Model Context Protocol.
Algorithmic dashboards + AI intelligence
Explore AI FeaturesTransform observability from complex project to instant product
Complete infrastructure visibility from installation to insight - no templates or query languages required for comprehensive monitoring.
Every chart provides complete analytical toolkit - interactive drill-down, dynamic filtering, real-time statistics, and ML overlays in unified interface.
Point-and-click analysis replaces query languages - junior engineers gain expert-level troubleshooting capabilities instantly through intuitive navigation.
Dashboards evolve as infrastructure changes - new resources appear instantly, deleted resources vanish cleanly, maintaining visibility through dynamic environments.
18 ML models per metric achieve 99% false positive reduction - consensus-based detection surfaces root cause in top 30-50 correlated metrics automatically.
Edge-native architecture maintains per-second granularity from 1 to 100,000+ nodes - linear costs, distributed processing, no centralized bottlenecks.
Predictable per-node pricing with unlimited metrics, logs, and users - costs scale linearly instead of exponentially with infrastructure growth.
AI-powered troubleshooting with complete infrastructure context - natural language queries, automated reports, and interactive investigation accelerate MTTR dramatically.
June 24, 2026
Netdata has added NPM-class network monitoring: live topology maps, NetFlow and sFlow traffic analysis, SNMP device and trap monitoring, and a dedicated network dashboard, all unified with your full-stack observability and processed at the edge.
June 23, 2026
Discover the top SolarWinds alternatives for 2026. Compare modern monitoring platforms built for cloud-native infrastructure - now with NPM-class network monitoring - with transparent pricing and real-time insights.
June 23, 2026
Understanding SolarWinds' subscription-only pricing changes following the Turn/River Capital acquisition, and exploring your options for infrastructure monitoring.
Netdata dashboards are generated by algorithms based on the semantic meaning and relationships of collected data, not manually configured. The NIDL framework (Nodes, Instances, Dimensions, Labels) structures all data consistently, enabling automatic generation of meaningful visualizations for every metric without human intervention. When you install Netdata, dashboards appear instantly - you don’t build them.
Grafana requires importing templates, connecting data sources, and customizing panels manually. Even with templates, you must understand your data structure, write PromQL queries, and configure each dashboard. Netdata eliminates this entirely - there’s nothing to import, configure, or customize. Dashboards generate automatically based on discovered data, and each chart provides 20-25× more analytical capability than typical Grafana panels through interactive point-and-click exploration.
No. Netdata eliminates the need for query languages entirely. The NIDL framework enables point-and-click analysis - filter by labels, group by dimensions, aggregate across nodes - all through interactive dropdowns and controls. For advanced users, REST APIs are available, but typical operations require zero query writing.
Within 60 seconds. Installation takes approximately 60 seconds, auto-discovery runs immediately, and dashboards populate in real-time as metrics are collected. You’ll see hundreds of pre-configured visualizations within the first minute, with more appearing as additional services are discovered. See our installation guide for details.
Yes. Netdata provides fully automated dashboards as the foundation, which you can extend with custom dashboards using drag-and-drop creation. Most users find automated dashboards sufficient for daily operations, using custom dashboards only for specific business views or executive summaries. This saves significant time compared to building everything manually.
Dashboards adapt automatically. New services are discovered instantly, appropriate visualizations generate automatically, ML models begin training, and pre-configured alerts activate. When resources are deleted, they’re removed from dashboards automatically. This dynamic adaptation eliminates maintenance overhead as infrastructure evolves. Learn more about auto-discovery.
Every metric gets 18 unsupervised ML models that train automatically (consensus-based detection for 99% false positive reduction). Anomaly flags appear as visual overlays on every chart, with Anomaly Advisor surfacing the top 30-50 correlated metrics during incidents. No configuration required - ML starts working 15 minutes after installation.
No. Netdata’s edge-native architecture ensures each node operates independently, maintaining per-second granularity and sub-2-second latency regardless of fleet size. Adding nodes doesn’t affect existing performance. We’ve proven this at 100,000+ node deployments processing billions of metrics per second globally. See our scalability documentation.
Industry data shows many organizations spend months building dashboards manually, with teams spending significant hours per analyst per month on dashboard maintenance. Netdata delivers comprehensive dashboards in 60 seconds with near-zero ongoing maintenance, representing substantial time and labor cost savings.
Absolutely. Netdata integrates with existing observability stacks through Prometheus export (scrape endpoint + Remote Write), native Grafana plugin, and OpenTelemetry. Many organizations use Netdata for real-time operations and keep Grafana for long-term analytics or business dashboards. This reduces risk during adoption.
Netdata uses predictable per-node pricing with volume discounts, not per metric, log volume, or user charges. This means you can collect unlimited metrics, logs, and dimensions without cost penalties. All ML features, AI capabilities, and advanced visualizations are included - there are no premium tiers that gate functionality. See our pricing page for details.
All metrics and logs stay on your infrastructure (Agents or Parents). Only metadata (node names, chart titles, alert configurations) syncs to Netdata Cloud for unified dashboards. This ensures data sovereignty and compliance with GDPR, HIPAA, PCI DSS. For complete air-gapped deployments, Netdata Cloud On-Premises is available.
Netdata offers two AI integration paths: (1) Managed AI via Netdata Cloud (AI Troubleshoot, Ask AI for alerts, AI Insights reports), and (2) Model Context Protocol (MCP) for bring-your-own-LLM integration. AI doesn’t replace algorithmic dashboards - it enhances them by providing natural language explanations, automated report generation, and interactive troubleshooting guidance.
Yes. For custom applications, instrument them using Prometheus/OpenMetrics format, StatsD, or OpenTelemetry. Once metrics are collected, Netdata’s algorithmic engine automatically generates appropriate visualizations based on metric types and labels. You don’t need to build dashboards - just expose metrics in standard formats. See our integrations for details.