 |
VOOZH | about |
|
VOOZH | about |
The only agent that thinks for itself
Autonomous Monitoring with self-learning AI built-in, operating independently across your entire stack.
Centralized metrics streaming and storage
Aggregate metrics from multiple agents into centralized Parent nodes for unified monitoring across your infrastructure.
Fully managed cloud platform
Access your monitoring data from anywhere with our SaaS platform. No infrastructure to manage, automatic updates, and global availability.
Deploy Netdata Cloud in your infrastructure
Run the full Netdata Cloud platform on-premises for complete data sovereignty and compliance with your security policies.
Powerful, intuitive monitoring interface
Modern, responsive UI built for real-time troubleshooting with customizable dashboards and advanced visualization capabilities.
Monitor on the go
Native iOS and Android apps bring full monitoring capabilities to your mobile device with real-time alerts and notifications.
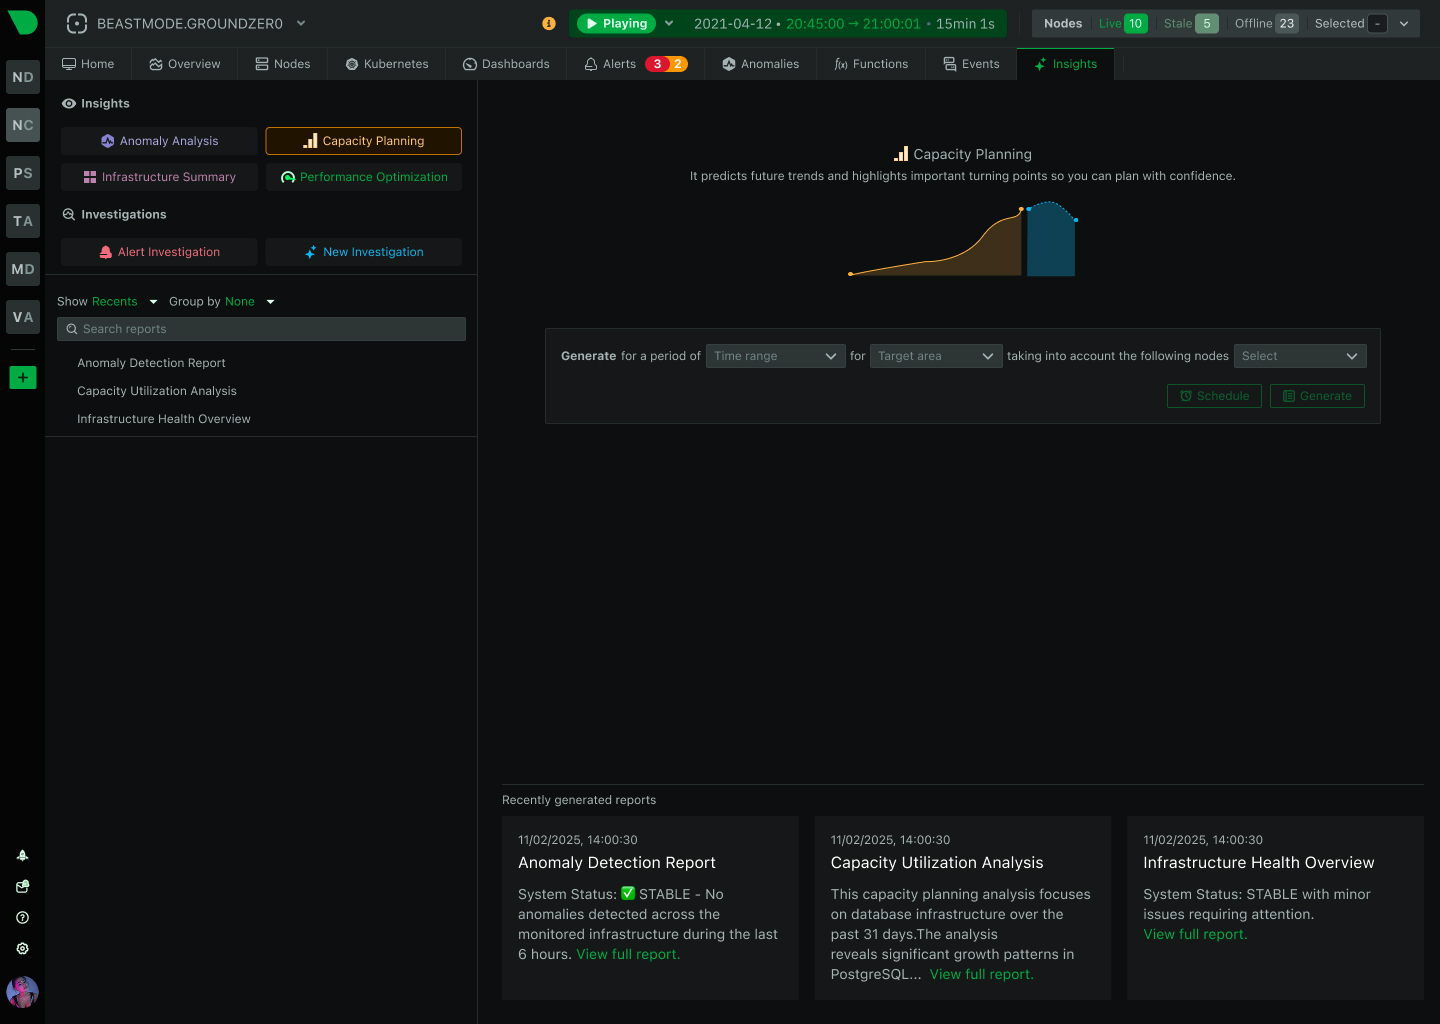
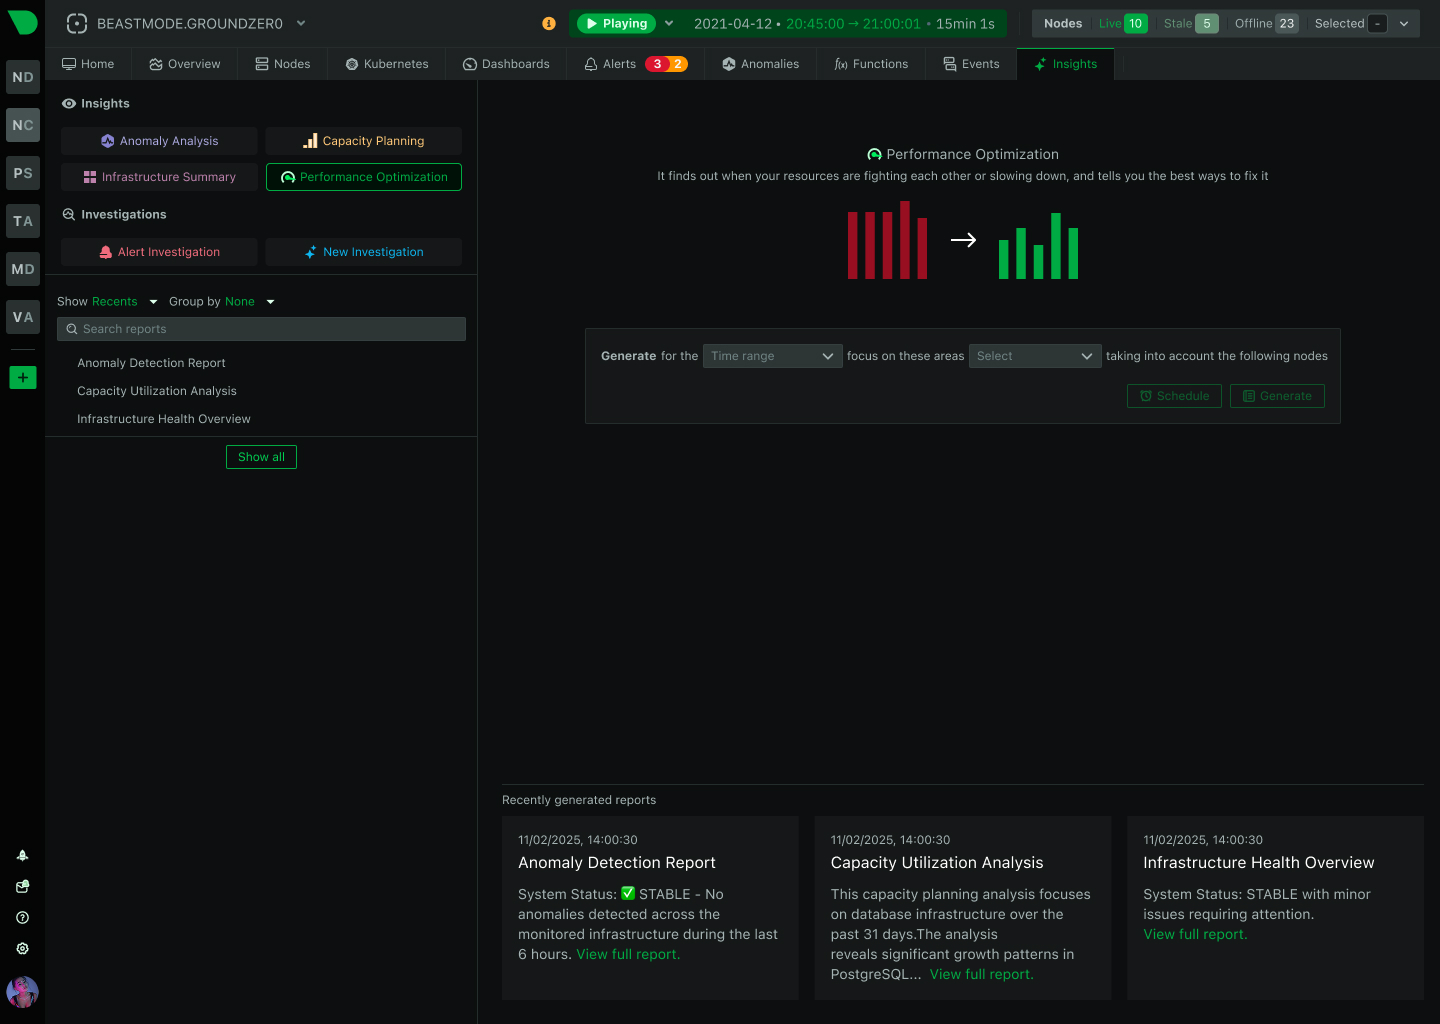
The future of infrastructure observability
See our strategic direction across AI-native observability, full-stack signals, operational intelligence, and enterprise platform maturity.
Best energy efficiency
True real-time per-second
100% automated zero config
Centralized observability
Multi-year retention
High availability built-in
Zero maintenance
Always up-to-date
Enterprise security
Complete data control
Air-gap ready
Compliance certified
Millisecond responsiveness
Infinite zoom & pan
Works on any device
Native performance
Instant alerts
Monitor anywhere
AI-native observability
Continuous delivery
Open source foundation
80% Faster Incident Resolution
True Real-Time and Simple, even at Scale
90% Cost Reduction, Full Fidelity
See and Map Your Entire Network
Single Pane of Glass
Control Without Surrender
Integrations
800+ collectors and notification channels, auto-discovered and ready out of the box.
Reduced monitoring costs by 46% while cutting staff overhead by 67%.
— Leonardo Antunez, Codyas
No data shipping. No central storage costs. Query at the edge.
So many out-of-the-box features! I mostly don't have to develop anything.
— Simon Beginn, LANCOM Systems
Point-and-click troubleshooting. No PromQL, no LogQL, no learning curve.
Enterprise efficiency without enterprise complexity—real ROI from day one.
— Leonardo Antunez, Codyas
Zero data egress. Only metadata reaches the cloud. Your metrics stay on your infrastructure.
Auto-discovered and configured. No manual setup required.
Slack, PagerDuty, Teams, email, webhooks—all built-in.
Built for the People Who Get Paged
Every Industry Has Rules. We Master Them.
Monitor Any Technology. Configure Nothing.
Complete Visibility. Total Control.
Don't Take Our Word for It
Netdata gives more than you invest in it. A rare unicorn that obeys the Pareto rule.
— Eduard Porquet Mateu, TMB Barcelona
Reduced website downtime by 99% and cloud bill by 30% using Netdata alerts.
— Falkland Islands Government
Optimized resource allocation based on Netdata alerts cut cloud spending by 30%.
— Falkland Islands Government
Reduced monitoring staff by 67% while cutting operational costs by 46%.
— Codyas
Netdata has agent capacity or a plugin for everything, including Windows and Kubernetes.
— Eduard Porquet Mateu, TMB Barcelona
So many out-of-the-box features! I mostly don't have to develop anything.
— Simon Beginn, LANCOM Systems
From 2-3 minutes to 30 seconds—instant visibility into any node issue.
— Matthew Artist, Nodecraft
20% less downtime and 40% budget optimization from out-of-the-box monitoring.
— Simon Beginn, LANCOM Systems
Pay per Node. Unlimited Everything Else.
One price per node. Unlimited metrics, logs, users, and retention. No per-GB surprises.
What's Your Monitoring Really Costing You?
Most teams overpay by 40-60%. Let's find out why.
Your Infrastructure Is Unique. Let's Talk.
Because monitoring 10 nodes is different from monitoring 10,000.
Monitoring That Sells Itself
Deploy in minutes. Impress clients in hours. Earn recurring revenue for years.
Per-Second Metrics at Homelab Prices
Same engine, same dashboards, same ML. Just priced for tinkerers.
$1,000 Per Referral. Unlimited Referrals.
Your colleagues get 10% off. You get 10% commission. Everyone wins.
"Netdata's significant positive impact" — LANCOM Systems
Compare vs Datadog, Grafana, Dynatrace
"Cut costs by 46%, staff by 67%" — Codyas
"Reduced cloud bill by 30%" — Falkland Islands Gov
"Better observability with Netdata than combining other tools." — TMB Barcelona
DPA, SLAs, on-prem, volume pricing
One command, 30 seconds, real data—no sandbox needed
Auto-config + per-node pricing = predictable profit
8-episode Netdata tutorial by LearnLinux.tv
3rd most starred monitoring project
Customers report 40-67% cost cuts, 99% downtime reduction
Free tier lets them try before they buy
AI Support Assistant, Available 24/7
Nedi has access to all official documentation, source code, and resources. Ask any question about Netdata—responds in your language.
Engineering Insights & Product Updates
Jun 2026
Fleet observability: how to monitor …
It feels less like managing devices and more …
Jun 2026
Network Monitoring, the Netdata Way: …
Interface counters tell you a port is busy. …
Jun 2026
5 Best SolarWinds Alternatives for 2026
As organizations modernize their …
Jun 2026
SolarWinds Price Increases 2026: What …
If you’re a SolarWinds customer facing …
Never Fight Fires Alone
Docs, community, and expert help—pick your path to resolution.
60 Seconds to First Dashboard
One command to install. Zero config. 850+ integrations documented.
Level Up Your Monitoring
76,000+ Engineers Strong
Per-Second. 90% Cheaper. Data Stays Home.
See why teams switch from Datadog, Prometheus, Grafana, and more.
> Browse all comparisonsTrace issues directly in the source code
Get architecture recommendations
One of the most popular open-source monitoring projects
Enterprise-grade security and compliance
Your metrics stay on your infrastructure
"Most energy-efficient monitoring solution" — ICSOC 2023, peer-reviewed
"Doesn't miss alerts—mission-critical trust for safety software"
Global community improving monitoring for everyone
Trusted by teams worldwide
Free forever, fully open source agent
Work from anywhere, async-friendly culture
Your work helps millions of systems
Gaming infrastructure demands real-time visibility that traditional monitoring can’t deliver. Netdata provides per-second metrics, ML-powered anomaly detection, and AI-assisted troubleshooting - enabling your team to maintain 99.9% uptime during launches, events, and peak traffic while reducing monitoring costs by 90%.
The monitoring platform that understands gaming workloads
Per-second metrics with sub-2-second latency from event to insight. Catch transient issues and microbursts that 30-second monitoring completely misses.
ML-powered Anomaly Advisor narrows thousands of metrics to the top 30-50 culprits in seconds. AI Chat explains root causes in plain language without query languages.
Transparent per-node pricing with unlimited metrics and logs. No surprise bills from traffic spikes during launches or events. Predictable costs that scale linearly.
From installation to first dashboard in 60 seconds. Auto-discovers game servers, databases, containers, and services. 400+ pre-configured alerts work immediately.
All metrics and logs stay on your infrastructure. Only metadata travels to Cloud for unified dashboards. Perfect for compliance and air-gapped environments.
18 ML models per metric train locally with 99% false positive reduction. Detects performance degradation, capacity issues, and security threats automatically.
Trusted by gaming companies worldwide
78% of gamers quit due to high latency
Learn about network monitoring
5 minutes average MTTR vs 45 minutes traditional
Explore AI troubleshooting
90% cost reduction vs traditional tools
View pricing
Console-quality precision with history
Discover Netdata Functions
1M log entries analyzed vs 5K traditional
Learn about logs management
25% infrastructure cost savings typical
Explore AI Insights
Why Gaming Teams Choose Netdata
Traditional monitoring tools weren’t designed for gaming workloads. Netdata delivers the real-time visibility, cost efficiency, and operational simplicity gaming teams need.
Capability
Netdata
Traditional Monitoring
Data Granularity
Metric collection frequency
✅ Per-Second
Catches transient issues and microbursts
⚠️ 10-60 Seconds
Misses 90% of short-duration problems
Time to First Dashboard
From install to visibility
✅ 60 Seconds
Zero configuration required
⚠️ Days to Weeks
Manual setup and dashboard building
Anomaly Detection
ML-based pattern recognition
✅ Included
18 models per metric, 99% false positive reduction
⚠️ Paid Add-On
Limited coverage or expensive
Pricing Model
Cost structure and predictability
✅ Per-Node
Unlimited metrics, logs, users
❌ Volume-Based
Spikes during launches inflate bills
MTTR During Incidents
Average time to resolution
✅ 3-5 Minutes
AI-powered root cause analysis
⚠️ 30-60 Minutes
Manual correlation across tools
Data Sovereignty
Where metrics and logs are stored
✅ On-Premises
Complete control and compliance
❌ Vendor Cloud
Data egress and compliance concerns
Log Management Cost
Per GB ingestion and storage
✅ Included
Zero-pipeline direct journal access
❌ Expensive
Volume-based charges add up quickly
Query Language Required
Learning curve for analysis
✅ None
Point-and-click interface
⚠️ PromQL/LogQL
Weeks to months learning curve
Multi-Region Visibility
Unified dashboard across regions
✅ Native
Distributed architecture by design
⚠️ Complex
Requires federation or aggregation
Per-second visibility into CPU, memory, network, and disk performance for every game server process. Track player connections, match state, and resource utilization with ML anomaly detection.
Real-time process monitoring with history
Learn moreMonitor latency, packet loss, retransmissions, and connection quality per region. Detect network degradation before players experience lag. Correlate infrastructure metrics with player-reported issues.
Per-second network performance tracking
Explore network monitoringNative collectors for MySQL, PostgreSQL, MongoDB, Redis, and more. Monitor query performance, connection pools, replication lag, and cache hit rates. Identify slow queries impacting game responsiveness.
Database performance without query tracing
View database monitoringComplete Kubernetes visibility from cluster to pod level. Monitor node capacity, pod resource utilization, HPA effectiveness, and deployment health. Optimize auto-scaling policies based on actual game workload patterns.
Native Kubernetes monitoring included
Discover K8s monitoringZero-pipeline log management queries systemd-journal and Windows Event Logs directly. Click any metric anomaly to view logs from that exact second. Full-text search across millions of entries without expensive indexing.
90% cost reduction vs traditional log platforms
Learn about logsBuilt for the unique challenges of gaming infrastructure
Per-second metrics reveal transient problems and microbursts that 30-second monitoring completely misses. See the exact moment performance degrades.
Zero-configuration installation with auto-discovery. From install to first dashboard in 60 seconds. No PromQL, no manual dashboard building, no weeks of setup.
Per-node pricing with unlimited metrics and logs. Traffic spikes during launches don’t inflate bills. 90% cost reduction versus traditional tools.
Anomaly Advisor narrows thousands of metrics to top culprits in seconds. AI Chat explains root causes in plain language. 80% faster MTTR.
All metrics and logs stay on your infrastructure. Perfect for compliance and air-gapped environments. Only metadata travels to Cloud for unified dashboards.
Junior engineers operate at senior level with AI assistance. No specialized query language skills required. Point-and-click analysis for everyone.
Distributed architecture provides unified visibility across all regions. Correlate issues globally while maintaining data sovereignty per region.
18 ML models per metric train automatically with 99% false positive reduction. Detects performance degradation, capacity issues, and security threats.
Netdata Functions provide browser-based access to top, netstat, iostat, and more - all with historical data and ML context. Debug without SSH.
June 28, 2026
Fleet observability for thousands of distributed Linux devices — robots, kiosks, EV chargers, IoT gateways. Edge-resident, outbound-only, works behind NAT and offline.
June 24, 2026
Netdata has added NPM-class network monitoring: live topology maps, NetFlow and sFlow traffic analysis, SNMP device and trap monitoring, and a dedicated network dashboard, all unified with your full-stack observability and processed at the edge.
June 23, 2026
Discover the top SolarWinds alternatives for 2026. Compare modern monitoring platforms built for cloud-native infrastructure - now with NPM-class network monitoring - with transparent pricing and real-time insights.
Netdata uses P90 billing methodology, which means you’re charged based on sustained usage, not temporary spikes. If you briefly spike to 1,000 nodes during a launch but normally run 100 nodes, you’re billed for 100 nodes. The top 10% of daily usage and the highest 3 days per month are automatically excluded. This makes costs predictable even during launches, events, or patches.
Yes. Netdata’s distributed architecture is designed for multi-region deployments. Deploy Netdata Parents in each region (US-East, EU-West, AP-Southeast, etc.) and connect them to Netdata Cloud for unified visibility. Each region maintains data sovereignty while providing infrastructure-wide dashboards. You can filter by region, correlate cross-region issues, and track regional network quality - all from a single interface.
No. Netdata provides point-and-click analysis without requiring query languages. Every chart has dropdown menus for filtering, grouping, and aggregation. The NIDL framework (Nodes, Instances, Dimensions, Labels) enables slicing and dicing any dataset instantly. For advanced users, Netdata also provides REST APIs, but they’re optional - not required for daily operations.
Netdata provides 90% cost reduction versus Datadog while delivering true real-time (per-second) monitoring compared to Datadog’s near real-time (15-60 seconds). Netdata includes ML anomaly detection, AI troubleshooting, and unlimited logs at no additional cost. However, Datadog offers distributed tracing today (Netdata Q2 2026) and has a Unity SDK for client-side monitoring. For infrastructure monitoring, Netdata is superior in cost, speed, and simplicity. For comprehensive gaming observability, consider Netdata for infrastructure plus specialized tools for player analytics. See our detailed comparison.
Yes. Netdata supports custom metrics via StatsD, OpenTelemetry, Prometheus exporters, and REST API. Instrument your game servers to send CCU counts, match durations, room occupancy, or any custom metrics. Netdata will automatically apply ML anomaly detection, create charts, and enable alerting - no additional configuration required.
Yes. Netdata has native Windows support with comprehensive system metrics, Windows Event Logs, and application monitoring. The Windows agent monitors CPU, memory, disk, network, processes, services, and more. Windows Event Logs are fully searchable with the same zero-pipeline approach as Linux systemd-journal. Windows monitoring requires a Business plan or higher.
Most gaming companies deploy Netdata in 1-4 weeks depending on infrastructure size. Small studios (10-100 servers) can deploy in days. Mid-size studios (100-1,000 servers) typically complete deployment in 2-3 weeks. Large studios (1,000+ servers) with multiple regions complete deployment in 4-8 weeks. The agent installation itself takes 60 seconds per server - the time is spent on planning topology, configuring credentials for protected services, and team onboarding.
All your metrics and logs remain on your infrastructure in standard formats (Netdata’s dbengine for metrics, systemd-journal/Windows Event Logs for logs). You can export metrics to Prometheus, InfluxDB, Graphite, or any other time-series database. Logs are already in native OS formats. There’s no vendor lock-in - your data is always accessible and portable.
Netdata excels as the infrastructure monitoring foundation and can replace tools like Prometheus, Grafana, Loki, and traditional log platforms. However, for comprehensive gaming observability, you may want specialized tools for: distributed tracing (until Netdata Q2 2026), client-side player experience monitoring (GameAnalytics, PlayFab), error tracking with stack traces (Sentry), and anti-cheat systems. Netdata’s strength is providing 90% of what you need at 10% of the cost, allowing budget for specialized tools where needed.
Netdata trains 18 k-means clustering models per metric using different time windows. All 18 models must agree before flagging an anomaly, achieving a theoretical false positive rate of 10^-36 (99% false positive reduction). Models train automatically at the edge using the last 2 days of data, adapting to your infrastructure’s unique patterns. No configuration or tuning required. The Anomaly Advisor correlation engine then ranks all anomalies by severity, surfacing the root cause in the top 30-50 results.
The Business plan (per-node pricing with volume discounts) includes: unlimited metrics and logs, unlimited users, ML anomaly detection on all metrics, AI troubleshooting (10 sessions/month), 400+ pre-configured alerts, 27 notification integrations, SSO and RBAC, Windows monitoring, multi-region support, and 99.9% SLA. Additional AI sessions available via credits. No charges for containers, data volume, or team size. See pricing details.
All metrics and logs stay on your infrastructure. Netdata Cloud only receives metadata (node names, chart titles, alert configurations) for unified dashboards. This architecture satisfies GDPR, HIPAA, PCI DSS, and regional data residency requirements by design. For complete air-gapped environments, Netdata Cloud On-Premise provides the full control plane within your datacenter. Netdata is SOC 2 Type 2 certified.
Yes. The open-source Netdata Agent is free forever with full functionality. For Cloud features, we offer a 14-day free trial with unlimited nodes and all features. No credit card required. You can also start with the Community plan (free for personal use, 5 nodes) or Homelab plan (unlimited nodes for personal non-commercial use) to evaluate before upgrading to Business. See our pricing page for details.
Community support includes GitHub Discussions, Discord, and forums. Business plan includes email/ticket support during business hours with SLA. Enterprise includes 24/7 availability, dedicated support team, phone support, and custom SLAs. Professional services available for implementation assistance, architecture design, migration support, and training programs.