 |
VOOZH | about |
|
VOOZH | about |
The only agent that thinks for itself
Autonomous Monitoring with self-learning AI built-in, operating independently across your entire stack.
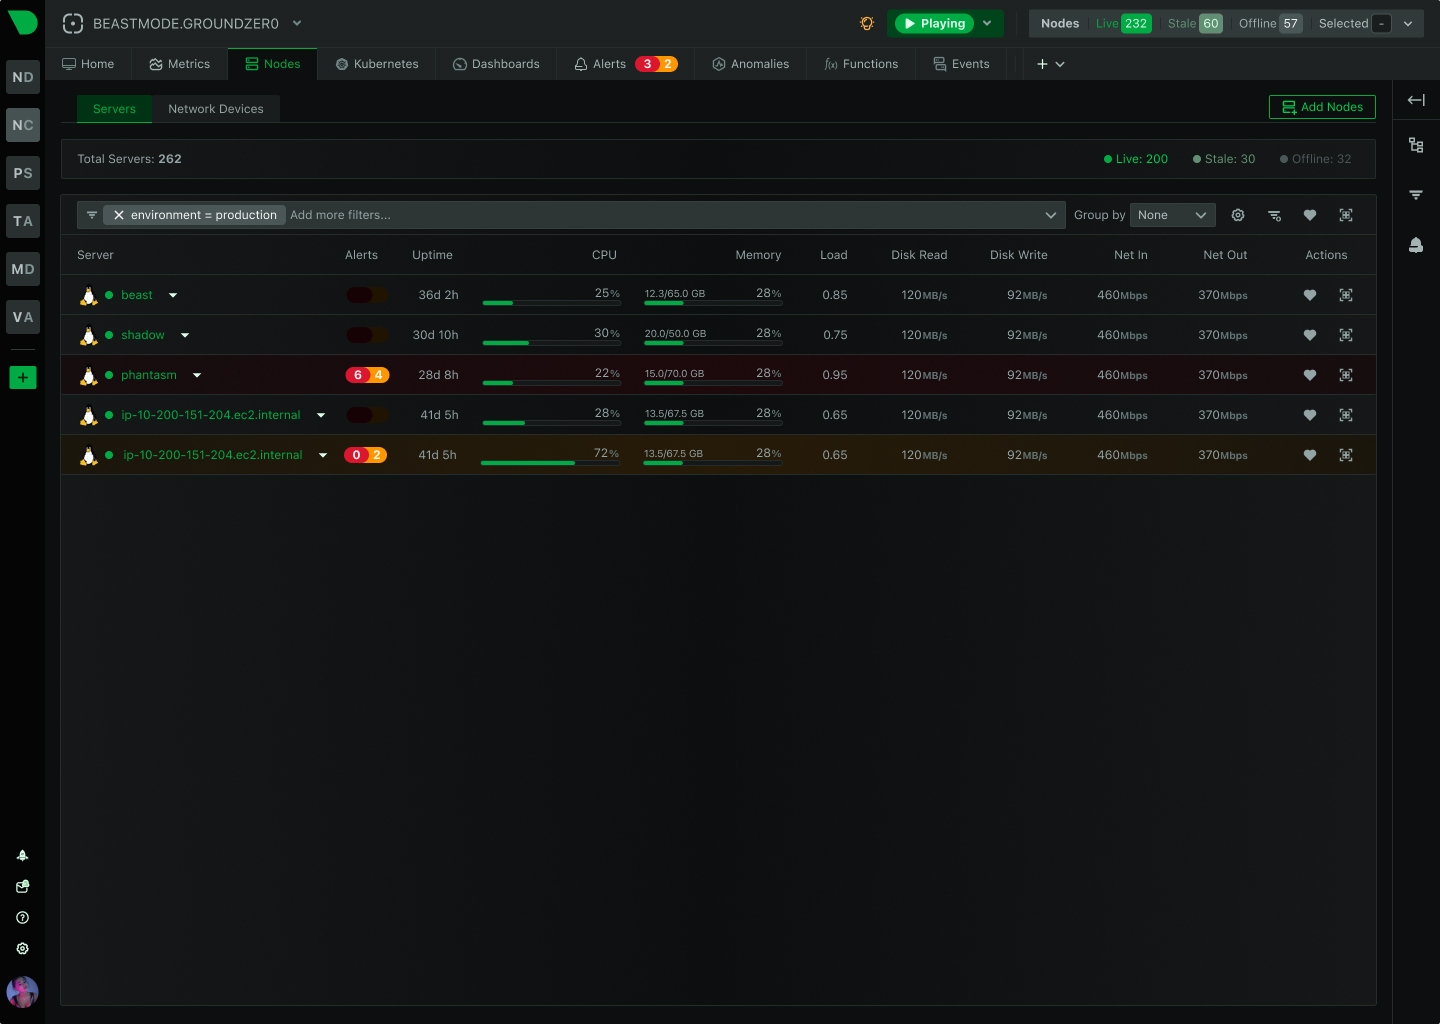
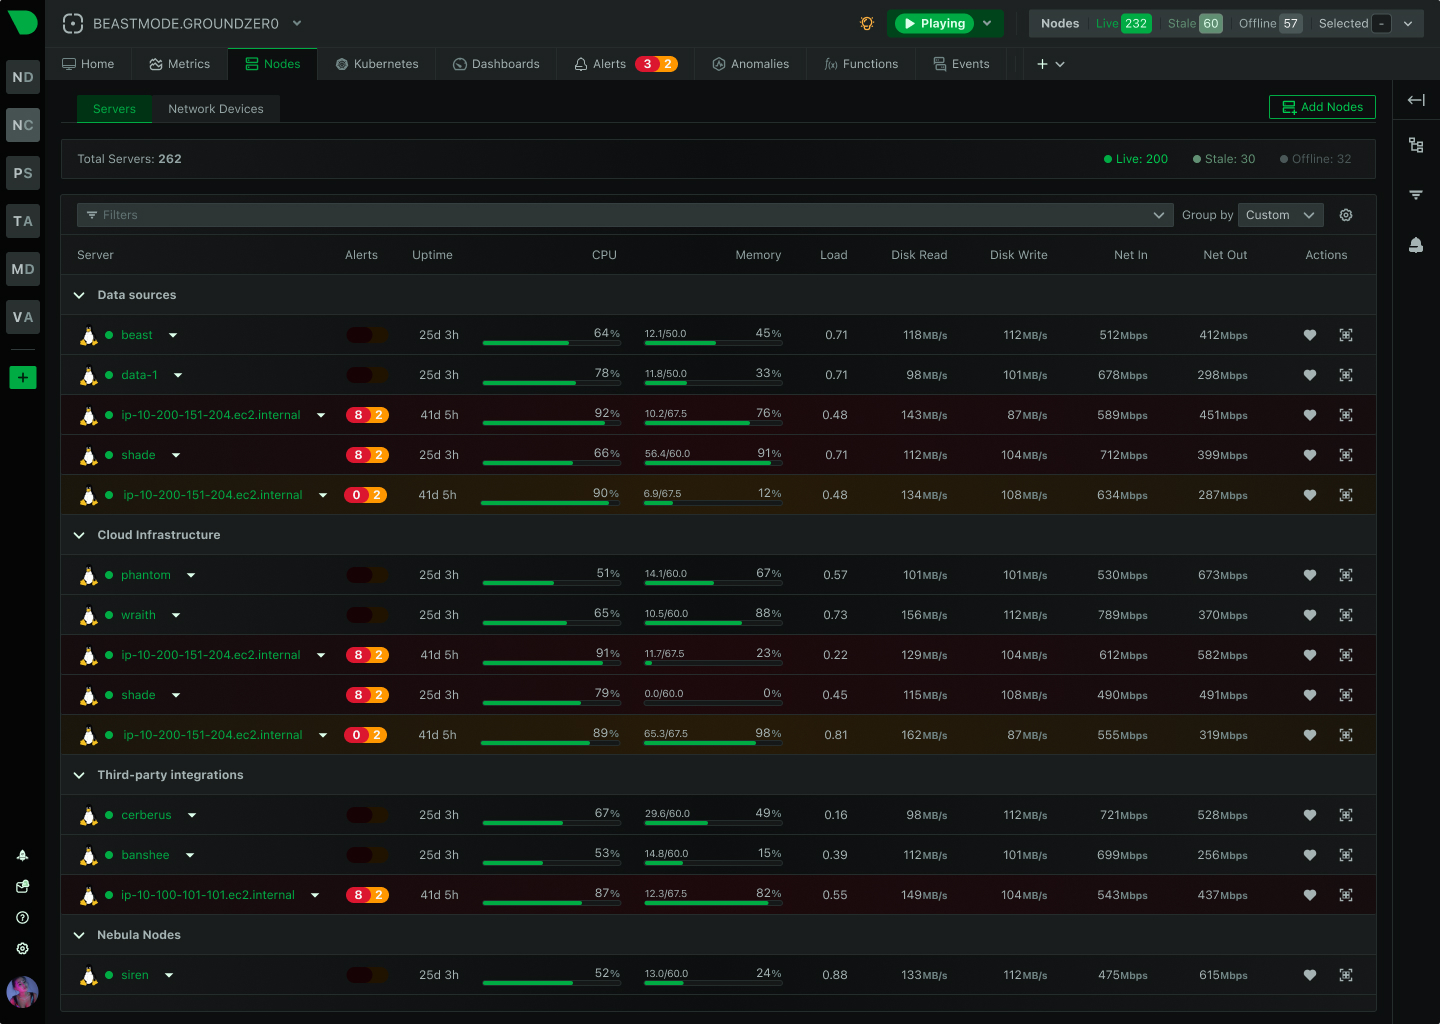
Centralized metrics streaming and storage
Aggregate metrics from multiple agents into centralized Parent nodes for unified monitoring across your infrastructure.
Fully managed cloud platform
Access your monitoring data from anywhere with our SaaS platform. No infrastructure to manage, automatic updates, and global availability.
Deploy Netdata Cloud in your infrastructure
Run the full Netdata Cloud platform on-premises for complete data sovereignty and compliance with your security policies.
Powerful, intuitive monitoring interface
Modern, responsive UI built for real-time troubleshooting with customizable dashboards and advanced visualization capabilities.
Monitor on the go
Native iOS and Android apps bring full monitoring capabilities to your mobile device with real-time alerts and notifications.
The future of infrastructure observability
See our strategic direction across AI-native observability, full-stack signals, operational intelligence, and enterprise platform maturity.
Best energy efficiency
True real-time per-second
100% automated zero config
Centralized observability
Multi-year retention
High availability built-in
Zero maintenance
Always up-to-date
Enterprise security
Complete data control
Air-gap ready
Compliance certified
Millisecond responsiveness
Infinite zoom & pan
Works on any device
Native performance
Instant alerts
Monitor anywhere
AI-native observability
Continuous delivery
Open source foundation
80% Faster Incident Resolution
True Real-Time and Simple, even at Scale
90% Cost Reduction, Full Fidelity
See and Map Your Entire Network
Single Pane of Glass
Control Without Surrender
Integrations
800+ collectors and notification channels, auto-discovered and ready out of the box.
Reduced monitoring costs by 46% while cutting staff overhead by 67%.
— Leonardo Antunez, Codyas
No data shipping. No central storage costs. Query at the edge.
So many out-of-the-box features! I mostly don't have to develop anything.
— Simon Beginn, LANCOM Systems
Point-and-click troubleshooting. No PromQL, no LogQL, no learning curve.
Enterprise efficiency without enterprise complexity—real ROI from day one.
— Leonardo Antunez, Codyas
Zero data egress. Only metadata reaches the cloud. Your metrics stay on your infrastructure.
Auto-discovered and configured. No manual setup required.
Slack, PagerDuty, Teams, email, webhooks—all built-in.
Built for the People Who Get Paged
Every Industry Has Rules. We Master Them.
Monitor Any Technology. Configure Nothing.
Complete Visibility. Total Control.
Don't Take Our Word for It
Netdata gives more than you invest in it. A rare unicorn that obeys the Pareto rule.
— Eduard Porquet Mateu, TMB Barcelona
Reduced website downtime by 99% and cloud bill by 30% using Netdata alerts.
— Falkland Islands Government
Optimized resource allocation based on Netdata alerts cut cloud spending by 30%.
— Falkland Islands Government
Reduced monitoring staff by 67% while cutting operational costs by 46%.
— Codyas
Netdata has agent capacity or a plugin for everything, including Windows and Kubernetes.
— Eduard Porquet Mateu, TMB Barcelona
So many out-of-the-box features! I mostly don't have to develop anything.
— Simon Beginn, LANCOM Systems
From 2-3 minutes to 30 seconds—instant visibility into any node issue.
— Matthew Artist, Nodecraft
20% less downtime and 40% budget optimization from out-of-the-box monitoring.
— Simon Beginn, LANCOM Systems
Pay per Node. Unlimited Everything Else.
One price per node. Unlimited metrics, logs, users, and retention. No per-GB surprises.
What's Your Monitoring Really Costing You?
Most teams overpay by 40-60%. Let's find out why.
Your Infrastructure Is Unique. Let's Talk.
Because monitoring 10 nodes is different from monitoring 10,000.
Monitoring That Sells Itself
Deploy in minutes. Impress clients in hours. Earn recurring revenue for years.
Per-Second Metrics at Homelab Prices
Same engine, same dashboards, same ML. Just priced for tinkerers.
$1,000 Per Referral. Unlimited Referrals.
Your colleagues get 10% off. You get 10% commission. Everyone wins.
"Netdata's significant positive impact" — LANCOM Systems
Compare vs Datadog, Grafana, Dynatrace
"Cut costs by 46%, staff by 67%" — Codyas
"Reduced cloud bill by 30%" — Falkland Islands Gov
"Better observability with Netdata than combining other tools." — TMB Barcelona
DPA, SLAs, on-prem, volume pricing
One command, 30 seconds, real data—no sandbox needed
Auto-config + per-node pricing = predictable profit
8-episode Netdata tutorial by LearnLinux.tv
3rd most starred monitoring project
Customers report 40-67% cost cuts, 99% downtime reduction
Free tier lets them try before they buy
AI Support Assistant, Available 24/7
Nedi has access to all official documentation, source code, and resources. Ask any question about Netdata—responds in your language.
Engineering Insights & Product Updates
Jun 2026
Network Monitoring, the Netdata Way: …
Interface counters tell you a port is busy. …
Jun 2026
5 Best SolarWinds Alternatives for 2026
As organizations modernize their …
Jun 2026
SolarWinds Price Increases 2026: What …
If you’re a SolarWinds customer facing …
May 2026
High-cardinality metrics at scale: why …
The “high cardinality is …
Never Fight Fires Alone
Docs, community, and expert help—pick your path to resolution.
60 Seconds to First Dashboard
One command to install. Zero config. 850+ integrations documented.
Level Up Your Monitoring
76,000+ Engineers Strong
Per-Second. 90% Cheaper. Data Stays Home.
See why teams switch from Datadog, Prometheus, Grafana, and more.
> Browse all comparisonsTrace issues directly in the source code
Get architecture recommendations
One of the most popular open-source monitoring projects
Enterprise-grade security and compliance
Your metrics stay on your infrastructure
"Most energy-efficient monitoring solution" — ICSOC 2023, peer-reviewed
"Doesn't miss alerts—mission-critical trust for safety software"
Global community improving monitoring for everyone
Trusted by teams worldwide
Free forever, fully open source agent
Work from anywhere, async-friendly culture
Your work helps millions of systems
Netdata delivers complete observability across distributed edge infrastructure with per-second precision, minimal resource consumption, and autonomous operation - even when connectivity fails. Built for edge-first architectures where intelligence lives at the source and visibility never depends on the cloud.
Purpose-built for distributed, resource-constrained, intermittently-connected environments
Every agent is a complete observability engine - collection, storage, ML, alerts, dashboards - operating independently without cloud dependency.
Monitor with <5% CPU and 150MB RAM. University-validated as the most energy-efficient solution while collecting per-second data.
Per-node pricing with volume discounts. Monitor unlimited metrics without data volume charges - 90% cost reduction vs traditional platforms.
18 unsupervised models per metric train locally, achieving 99% false positive reduction through consensus - no cloud processing required.
All metrics and logs stay on-premises. ML trains locally. Only metadata travels to Cloud - perfect for regulated industries and air-gapped facilities.
Install in 60 seconds, gain complete visibility. Auto-discovers 800+ integrations, generates dashboards algorithmically, trains ML automatically.
Trusted by organizations managing distributed edge infrastructure worldwide
100% visibility maintained during network partitions
Learn about autonomous operation
4.5B+ metrics/second processed globally
Explore scalability architecture
15 minutes to first ML detection, 2 days to full confidence
Discover ML capabilities
Replaces top, iostat, netstat, journalctl, and more
See Functions in action
Monitor AI at the edge with AI at the edge
Explore AI features
Predictable per node pricing, no data volume charges
View pricing details
Edge Computing Observability Comparison
Traditional monitoring solutions were built for data centers and retrofitted for edge. Netdata was designed edge-first from day one.
Capability
Netdata
Traditional Monitoring
Offline Operation
✅ Ideal
Full capability maintained during network failures
❌ Not Available
Requires constant cloud connectivity
Resource Footprint
✅ Ideal
<5% CPU, 150MB RAM validated
⚠️ Challenging
10-20% CPU typical, higher memory
Data Granularity
✅ Real-Time
Per-second collection, sub-2s latency
⚠️ Near Real-Time
10-60 second intervals typical
ML Anomaly Detection
✅ Included
18 models per metric, edge-trained
⚠️ Paid Add-On
Cloud-based, often extra cost
Configuration Required
✅ Automated
Auto-discovery, algorithmic dashboards
⚠️ Manual
Extensive setup, dashboard building
Data Sovereignty
✅ Ideal
All data stays on-premises
❌ Not Available
Data transmitted to cloud
Pricing Model
✅ Included
Predictable per node pricing
⚠️ Expensive
Data volume based, unpredictable
Scalability
✅ Ideal
Linear growth, no bottlenecks
⚠️ Complex
Central bottlenecks at scale
Sample Completeness
100%
No sampling or data loss
93-95%
Sampling common at scale
Time to First Dashboard
60 seconds
Instant auto-generated visibility
Hours to weeks
Manual configuration required
Every Netdata agent is a complete observability engine - collection, storage, query, ML, alerts, dashboards - operating independently. When connectivity fails, monitoring continues. When connectivity returns, data replicates automatically without gaps.
100% visibility maintained during network partitions
Learn about distributed architectureUniversity-validated as the most energy-efficient monitoring solution. Runs with <5% CPU and 150MB RAM while collecting per-second data and training ML models. Further optimized for IoT: <1% CPU, <100MB RAM when offloading to parents.
Lowest CPU, RAM, energy consumption validated
See resource utilization details18 unsupervised k-means models per metric train locally without external transmission. Consensus-based detection achieves 99% false positive reduction. Models retrain every 3 hours automatically, adapting to each edge location's unique patterns.
15 minutes to first detection, 2 days to full confidence
Explore ML capabilitiesOptional parent aggregation provides multi-node dashboards and longer retention while maintaining edge autonomy. Parents cluster for high availability. Agents buffer locally during parent downtime, replaying data on reconnection.
One parent cluster per ~500 edge nodes recommended
Design your topologyBuilt-in Functions replace console tools - processes, network connections, systemd services, logs - all accessible via web dashboard with history and ML context. Perfect for retail locations, manufacturing facilities, remote sites where SSH access is restricted.
Replaces top, iostat, netstat, journalctl, and more
See Functions in actionWhy organizations choose Netdata for distributed edge infrastructure monitoring
Built from day one for distributed, resource-constrained, intermittently-connected environments - not retrofitted from cloud-first solutions.
Every agent is a complete observability engine operating independently - monitoring continues when connectivity fails, data replicates when restored.
University-validated as most energy-efficient solution - <5% CPU, 150MB RAM while collecting per-second data and training ML models.
18 unsupervised models per metric train locally, achieving 99% false positive reduction through consensus - no cloud processing required.
Per-node pricing with volume discounts - monitor unlimited metrics without data volume charges. 90% cost reduction vs traditional platforms.
All metrics and logs stay on-premises. ML trains locally. Only metadata travels to Cloud - perfect for regulated industries and air-gapped facilities.
Install in 60 seconds, gain complete visibility. Auto-discovers 800+ integrations, generates dashboards algorithmically, trains ML automatically.
Scale from hundreds to millions of edge nodes without architectural changes. Adding nodes doesn’t degrade existing performance.
Built-in Functions replace SSH access - processes, connections, services, logs - all via web dashboard with history and ML context.
June 24, 2026
Netdata has added NPM-class network monitoring: live topology maps, NetFlow and sFlow traffic analysis, SNMP device and trap monitoring, and a dedicated network dashboard, all unified with your full-stack observability and processed at the edge.
June 23, 2026
Discover the top SolarWinds alternatives for 2026. Compare modern monitoring platforms built for cloud-native infrastructure - now with NPM-class network monitoring - with transparent pricing and real-time insights.
June 23, 2026
Understanding SolarWinds' subscription-only pricing changes following the Turn/River Capital acquisition, and exploring your options for infrastructure monitoring.
Every Netdata agent operates autonomously as a complete observability engine. When connectivity fails, agents continue collecting, storing, analyzing, alerting, and serving local dashboards. When connectivity returns, agents automatically replay buffered data to parents without gaps or data loss. This architecture is proven in air-gapped manufacturing facilities, maritime vessels, and remote energy sites.
Netdata typically uses <5% CPU and 150-200MB RAM for full-featured monitoring with ML enabled. For resource-constrained devices, you can offload ML training, alerting, and storage to parents, reducing edge footprint to ~2% CPU and <150MB RAM. For extremely constrained IoT devices, minimal mode uses <1% CPU and <100MB RAM with RAM-only storage. The University of Amsterdam study validated Netdata as the most energy-efficient monitoring solution.
Netdata uses predictable per-node pricing with volume discounts. Traditional platforms charge based on data volume, leading to unpredictable costs. With Netdata, you get no data volume charges, no per-metric fees, and no user limits - representing 90% cost reduction compared to traditional monitoring platforms. The more edge nodes you monitor, the lower your per-node cost becomes. See our pricing page for details.
Yes. Netdata agents operate fully autonomously without any cloud dependency. Each agent provides local dashboards (http://[edge-node]:19999), ML anomaly detection, alerting, and storage. For multi-node visibility in air-gapped environments, deploy Netdata Parents within your isolated network. Netdata Cloud is optional - used only for unified access across multiple independent parent clusters when internet connectivity is available.
Netdata trains 18 unsupervised k-means models per metric directly on each edge node using local data. Models train on different time windows (6-hour windows, 3-hour staggered intervals) and require unanimous agreement before flagging anomalies - achieving 99% false positive reduction. Training happens as low-priority background tasks, automatically yielding to data collection. First detection available after 15-minute baseline; full confidence reached in 2 days. No external data transmission required.
The edge node continues full monitoring operation locally - collecting metrics, training ML models, evaluating alerts, serving dashboards. Data is buffered locally (configurable retention, typically 1+ hours). When connectivity returns, the agent automatically replays buffered data to parents without gaps. Engineers can still access the local dashboard directly (http://[edge-node]:19999) even during network partitions.
Netdata’s zero-configuration approach eliminates management overhead: (1) Auto-discovery finds systems, containers, applications across 800+ integrations, (2) Algorithmic dashboards generate automatically based on collected data, (3) ML trains automatically after 15-minute baseline, (4) 400+ pre-configured alerts work out-of-box, (5) Parent clusters aggregate multi-node views, (6) Netdata Cloud provides unified infrastructure visibility. Teams report becoming productive within hours, not weeks.
Yes. Netdata provides per-second GPU metrics for NVIDIA and AMD GPUs: utilization, memory usage, temperature, fan speed, power consumption, and PCIe bandwidth. ML anomaly detection applies to GPU metrics automatically. The AI Co-Engineer can troubleshoot inference performance issues using natural language queries. All while maintaining the lightweight footprint edge AI workloads require.
Netdata’s edge-native architecture provides significant advantages: (1) Autonomous operation - works offline, Prometheus requires constant connectivity, (2) Resource efficiency - Netdata benchmark shows 36% less CPU, 88% less RAM, 97% less disk I/O at 4.6M metrics/sec, (3) Built-in ML - 18 models per metric vs manual configuration, (4) Zero configuration - auto-discovery vs manual scrape configs, (5) Per-node pricing - predictable costs vs infrastructure overhead. See detailed comparison.
Netdata is designed for data sovereignty: all metrics and logs stay on-premises, ML trains locally without external transmission, only metadata (node names, chart titles) travels to Netdata Cloud. SOC 2 Type 2 certified, GDPR/HIPAA/PCI DSS aligned by design. Perfect for regulated industries (healthcare, finance, government), multi-region deployments with differing regulations, and critical infrastructure requiring complete data control. Air-gapped deployment option available.
Typical timeline: Week 1-2 (POC on 5-10 nodes), Week 3-6 (regional pilot with 100-500 nodes), Month 2-6 (production rollout to all edge locations). Installation takes 60 seconds per node via one-line command. Auto-discovery and algorithmic dashboards eliminate configuration time. Many organizations achieve full deployment in 2-3 months vs 6-12 months for traditional solutions.
Yes. Netdata supports open standards: (1) Ingest - OpenTelemetry, Prometheus, StatsD, OpenMetrics, Nagios plugins, (2) Export - Prometheus remote-write, InfluxDB, Graphite, OpenTSDB, TimescaleDB, (3) Visualize - native UI plus Grafana plugin, (4) Alert - PagerDuty, Slack, Teams, webhooks, custom scripts. Many customers run Netdata at edge while keeping existing tools for centralized systems. No vendor lock-in.
Business plan includes email/ticket support during business hours with SLA. Enterprise support offers 24/7 availability, dedicated support teams, phone support, and custom SLAs. Professional services available for implementation assistance, architecture design, migration support, and training programs. Active community support via Discord, GitHub Discussions, and Community Forums.
Netdata automatically handles ephemeral edge nodes: (1) New devices auto-register when Netdata starts, (2) Dashboards update automatically as nodes appear/disappear, (3) Parents maintain historical data for ephemeral nodes, (4) ML models train fresh on each node’s unique patterns, (5) Alerts automatically apply to new instances. Perfect for auto-scaling edge deployments, container-based edge workloads, and frequently replaced IoT devices.