 |
VOOZH | about |
|
VOOZH | about |
The only agent that thinks for itself
Autonomous Monitoring with self-learning AI built-in, operating independently across your entire stack.
Centralized metrics streaming and storage
Aggregate metrics from multiple agents into centralized Parent nodes for unified monitoring across your infrastructure.
Fully managed cloud platform
Access your monitoring data from anywhere with our SaaS platform. No infrastructure to manage, automatic updates, and global availability.
Deploy Netdata Cloud in your infrastructure
Run the full Netdata Cloud platform on-premises for complete data sovereignty and compliance with your security policies.
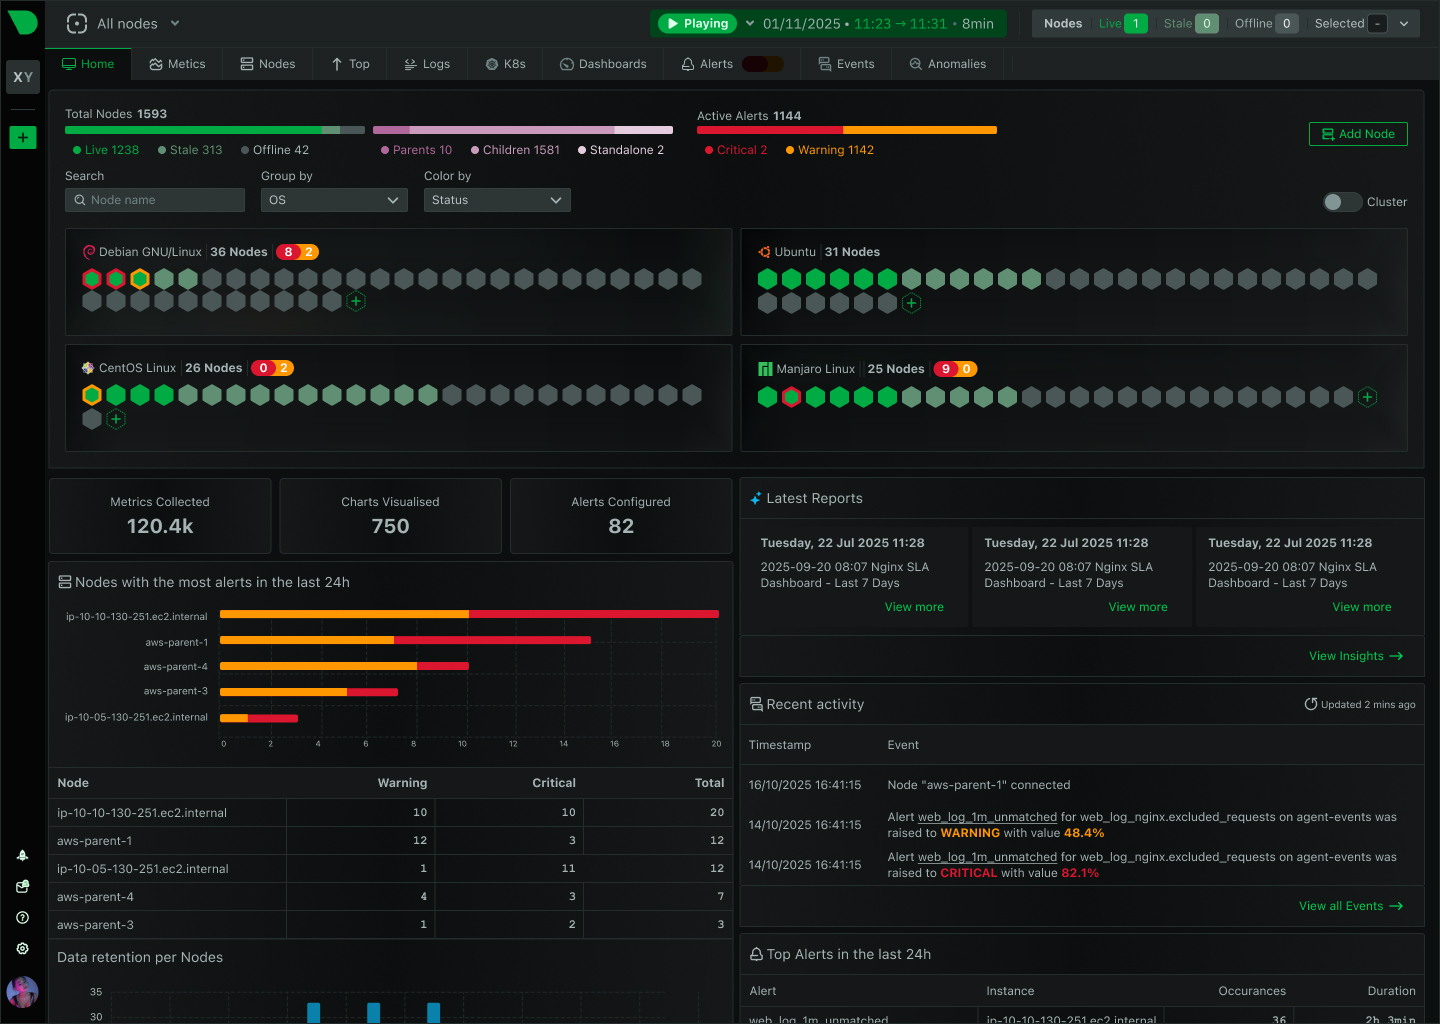
Powerful, intuitive monitoring interface
Modern, responsive UI built for real-time troubleshooting with customizable dashboards and advanced visualization capabilities.
Monitor on the go
Native iOS and Android apps bring full monitoring capabilities to your mobile device with real-time alerts and notifications.
The future of infrastructure observability
See our strategic direction across AI-native observability, full-stack signals, operational intelligence, and enterprise platform maturity.
Best energy efficiency
True real-time per-second
100% automated zero config
Centralized observability
Multi-year retention
High availability built-in
Zero maintenance
Always up-to-date
Enterprise security
Complete data control
Air-gap ready
Compliance certified
Millisecond responsiveness
Infinite zoom & pan
Works on any device
Native performance
Instant alerts
Monitor anywhere
AI-native observability
Continuous delivery
Open source foundation
80% Faster Incident Resolution
True Real-Time and Simple, even at Scale
90% Cost Reduction, Full Fidelity
See and Map Your Entire Network
Single Pane of Glass
Control Without Surrender
Integrations
800+ collectors and notification channels, auto-discovered and ready out of the box.
Reduced monitoring costs by 46% while cutting staff overhead by 67%.
— Leonardo Antunez, Codyas
No data shipping. No central storage costs. Query at the edge.
So many out-of-the-box features! I mostly don't have to develop anything.
— Simon Beginn, LANCOM Systems
Point-and-click troubleshooting. No PromQL, no LogQL, no learning curve.
Enterprise efficiency without enterprise complexity—real ROI from day one.
— Leonardo Antunez, Codyas
Zero data egress. Only metadata reaches the cloud. Your metrics stay on your infrastructure.
Auto-discovered and configured. No manual setup required.
Slack, PagerDuty, Teams, email, webhooks—all built-in.
Built for the People Who Get Paged
Every Industry Has Rules. We Master Them.
Monitor Any Technology. Configure Nothing.
Complete Visibility. Total Control.
Don't Take Our Word for It
Netdata gives more than you invest in it. A rare unicorn that obeys the Pareto rule.
— Eduard Porquet Mateu, TMB Barcelona
Reduced website downtime by 99% and cloud bill by 30% using Netdata alerts.
— Falkland Islands Government
Optimized resource allocation based on Netdata alerts cut cloud spending by 30%.
— Falkland Islands Government
Reduced monitoring staff by 67% while cutting operational costs by 46%.
— Codyas
Netdata has agent capacity or a plugin for everything, including Windows and Kubernetes.
— Eduard Porquet Mateu, TMB Barcelona
So many out-of-the-box features! I mostly don't have to develop anything.
— Simon Beginn, LANCOM Systems
From 2-3 minutes to 30 seconds—instant visibility into any node issue.
— Matthew Artist, Nodecraft
20% less downtime and 40% budget optimization from out-of-the-box monitoring.
— Simon Beginn, LANCOM Systems
Pay per Node. Unlimited Everything Else.
One price per node. Unlimited metrics, logs, users, and retention. No per-GB surprises.
What's Your Monitoring Really Costing You?
Most teams overpay by 40-60%. Let's find out why.
Your Infrastructure Is Unique. Let's Talk.
Because monitoring 10 nodes is different from monitoring 10,000.
Monitoring That Sells Itself
Deploy in minutes. Impress clients in hours. Earn recurring revenue for years.
Per-Second Metrics at Homelab Prices
Same engine, same dashboards, same ML. Just priced for tinkerers.
$1,000 Per Referral. Unlimited Referrals.
Your colleagues get 10% off. You get 10% commission. Everyone wins.
"Netdata's significant positive impact" — LANCOM Systems
Compare vs Datadog, Grafana, Dynatrace
"Cut costs by 46%, staff by 67%" — Codyas
"Reduced cloud bill by 30%" — Falkland Islands Gov
"Better observability with Netdata than combining other tools." — TMB Barcelona
DPA, SLAs, on-prem, volume pricing
One command, 30 seconds, real data—no sandbox needed
Auto-config + per-node pricing = predictable profit
8-episode Netdata tutorial by LearnLinux.tv
3rd most starred monitoring project
Customers report 40-67% cost cuts, 99% downtime reduction
Free tier lets them try before they buy
AI Support Assistant, Available 24/7
Nedi has access to all official documentation, source code, and resources. Ask any question about Netdata—responds in your language.
Engineering Insights & Product Updates
Jun 2026
Network Monitoring, the Netdata Way: …
Interface counters tell you a port is busy. …
Jun 2026
5 Best SolarWinds Alternatives for 2026
As organizations modernize their …
Jun 2026
SolarWinds Price Increases 2026: What …
If you’re a SolarWinds customer facing …
May 2026
High-cardinality metrics at scale: why …
The “high cardinality is …
Never Fight Fires Alone
Docs, community, and expert help—pick your path to resolution.
60 Seconds to First Dashboard
One command to install. Zero config. 850+ integrations documented.
Level Up Your Monitoring
76,000+ Engineers Strong
Per-Second. 90% Cheaper. Data Stays Home.
See why teams switch from Datadog, Prometheus, Grafana, and more.
> Browse all comparisonsTrace issues directly in the source code
Get architecture recommendations
One of the most popular open-source monitoring projects
Enterprise-grade security and compliance
Your metrics stay on your infrastructure
"Most energy-efficient monitoring solution" — ICSOC 2023, peer-reviewed
"Doesn't miss alerts—mission-critical trust for safety software"
Global community improving monitoring for everyone
Trusted by teams worldwide
Free forever, fully open source agent
Work from anywhere, async-friendly culture
Your work helps millions of systems
Educational institutions face unique challenges: 24/7 access requirements, limited IT resources, strict compliance mandates, and unpredictable traffic spikes during registration and grading periods. Netdata delivers real-time infrastructure monitoring with complete data sovereignty - ensuring student information never leaves your systems while providing the visibility your lean IT team needs to maintain 99.9%+ uptime.
From K-12 districts to research universities, Netdata adapts to your institution’s unique needs
Zero-configuration installation discovers 800+ integrations automatically. From install to full visibility in under 60 seconds.
100% data on-premises architecture. Only metadata travels to Cloud - metrics and logs never leave your systems.
Transparent pricing with no data volume charges. Eliminate expensive log pipelines and replace multiple tools with one unified platform.
Catch brief anomalies that minute-level monitoring misses. See registration spikes and system stress as they happen.
Junior engineers get senior-level insights through AI Co-Engineer. Natural language troubleshooting and automated root cause analysis reduce MTTR by 80%.
Monitor 10 nodes or 10,000 with the same architecture. Proven at 100,000+ node deployments with linear scaling.
Trusted by Educational Institutions Worldwide
99.9%+ uptime achievable
Learn about real-time monitoring
80% MTTR reduction
Explore AI features
Eliminate log pipeline costs
Discover zero-pipeline logs
Detect 2-10 second anomalies
See performance monitoring
99% false positive reduction
Explore security monitoring
800+ integrations
View all integrations
Why Educational Institutions Choose Netdata
Traditional monitoring tools weren’t designed for educational institutions’ constraints - limited budgets, lean IT teams, strict compliance requirements, and 24/7 uptime expectations. Netdata addresses these challenges through architectural innovation, not feature bloat.
Capability
Netdata
Traditional Monitoring
Deployment Time
From installation to full visibility
✅ 60 seconds
Zero-config auto-discovery
⚠️ 3-6 months
Requires extensive setup
Data Sovereignty
Student data protection
✅ 100% on-premises
Metrics never leave systems
❌ Centralized egress
Data sent to vendor clouds
Monitoring Granularity
Data collection frequency
✅ Per-second
Catch brief anomalies
⚠️ Per-minute
Miss transient issues
Cost Model
Pricing predictability
✅ Predictable per-node
No data volume charges
⚠️ Variable pricing
Charges for metrics, logs, users
Skills Required
Team expertise needed
✅ None
AI-powered, no query languages
⚠️ Specialized
PromQL, Grafana, tuning
Log Management
Compliance-ready logs
✅ Zero pipeline
Query journals directly
❌ Expensive pipelines
Elasticsearch/Splunk required
ML Anomaly Detection
False positive reduction
✅ 99% reduction
18 ML models per metric
⚠️ Limited or none
Manual threshold tuning
Scalability
Growth without redesign
✅ Linear
10 to 100,000+ nodes
⚠️ Exponential complexity
Requires replatforming
Compliance Support
Audit-ready architecture
✅ SOC 2 Type 2
Data sovereignty, FSS logs
⚠️ Varies
Often requires validation
Limited IT staff, tight budgets, and 100-300+ EdTech vendors to manage. Netdata provides enterprise-grade monitoring at education-friendly pricing with zero-configuration deployment.
Deploy in 60 seconds, monitor everything
Explore K-12 SolutionsComplex hybrid infrastructure spanning on-premises datacenters, multi-cloud deployments, research clusters, and distributed campuses. Netdata scales to 100,000+ nodes with unified visibility.
Monitor millions of metrics per second
Explore Higher Ed SolutionsCanvas, Moodle, Blackboard performance monitoring with per-second visibility into PHP-FPM pools, database queries, web server response times, and server resources during peak periods.
Prevent slowdowns before students notice
Learn About Application MonitoringHPC clusters, field-deployed sensors, edge devices, and specialized research equipment. Netdata's minimal overhead (<5% CPU, 150-200MB RAM) ensures monitoring doesn't impact research workloads.
Minimal impact, maximum insight
Explore HPC MonitoringReal-time threat detection with per-second visibility catches attacks lasting just 2-10 seconds. ML-based anomaly detection with 99% false positive reduction helps you focus on genuine threats.
Detect threats in seconds, not minutes
Explore Security MonitoringFrom registration spikes to security threats, Netdata addresses the unique operational challenges educational institutions face daily
Only 10% of education IT departments are fully staffed. Netdata’s AI-powered troubleshooting and zero-configuration deployment enable lean teams to manage complex infrastructure without specialized expertise.
42% of institutions anticipate budget cuts. Netdata delivers transparent per-node pricing with no surprise charges for metrics, logs, or users - achieving 90% cost savings versus traditional solutions.
Student data must stay sovereign. Netdata’s 100% on-premises architecture ensures metrics and logs never leave your systems, with SOC 2 Type 2 certification and audit-grade tamper-evident logging.
Registration periods and grading deadlines create predictable spikes. Per-second monitoring reveals PHP-FPM exhaustion, database saturation, and server stress before students experience slowdowns.
Netdata provides component-level alerts with 400+ pre-configured health checks. ML-based anomaly detection with 18 models per metric achieves 99% false positive reduction in anomaly detection.
88% of institutions use multi-cloud. Netdata provides unified visibility across on-premises, AWS, Azure, GCP, Kubernetes, and edge devices from a single agent installation with auto-discovery.
82% report MTTR over 1 hour. Netdata’s AI Co-Engineer, automated root cause analysis, and per-second visibility reduce MTTR by 80% - from hours to minutes.
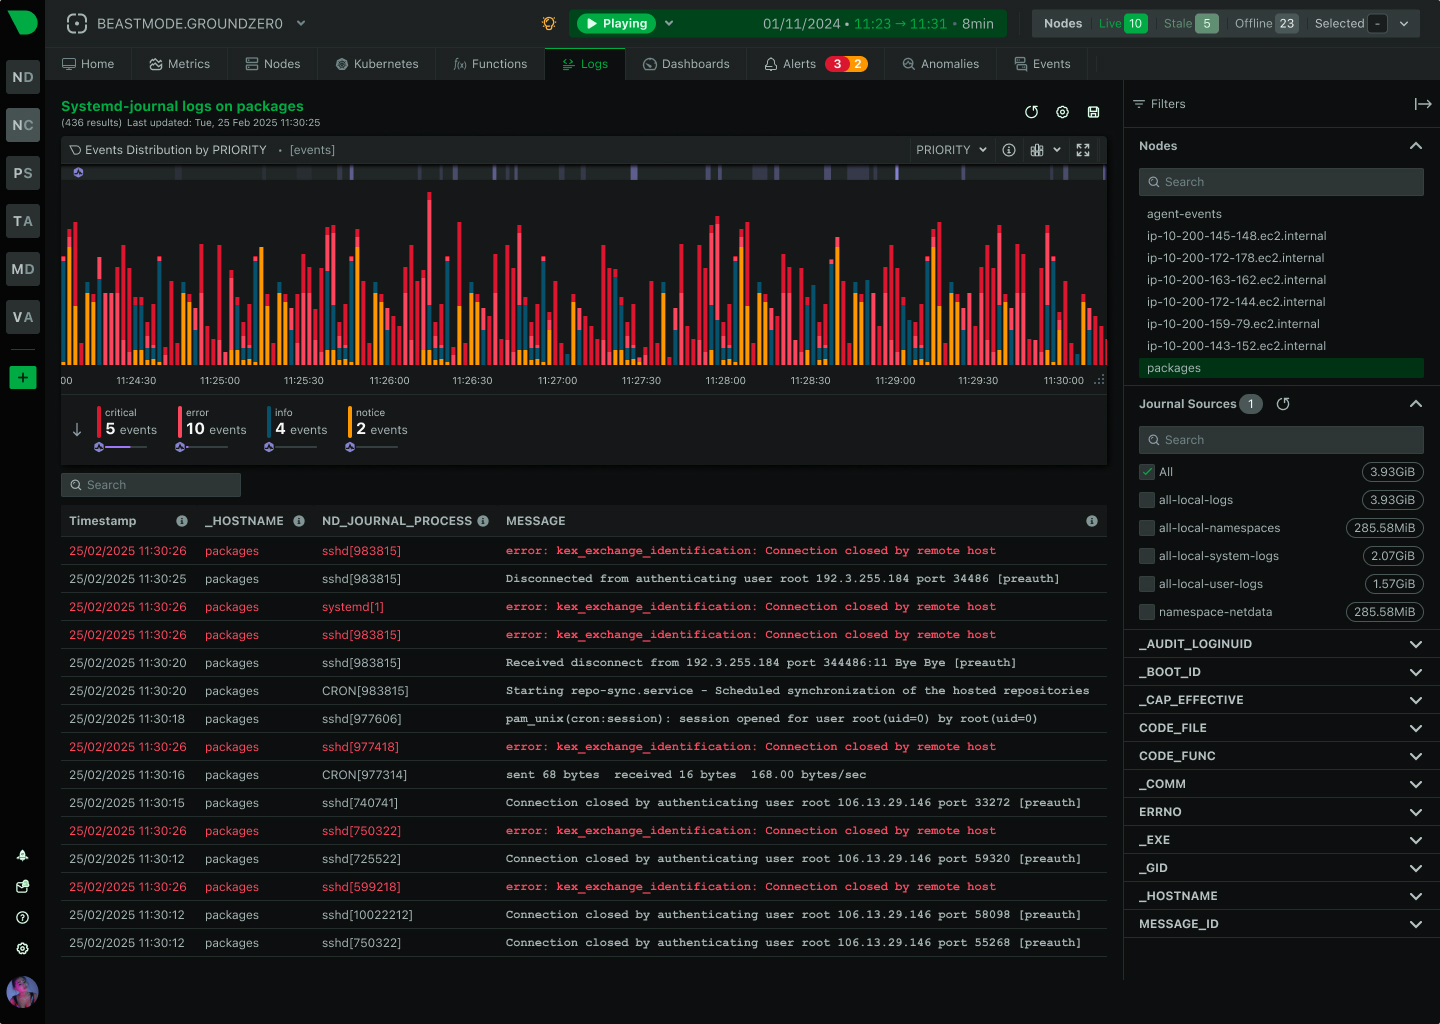
Traditional log pipelines require significant infrastructure investment. Netdata’s zero-pipeline architecture queries systemd-journal and Windows Event Logs directly where they live.
Minute-level monitoring misses 90% of anomalies lasting 2-10 seconds. Netdata’s per-second granularity captures brief spikes, crypto-miners, port scans, and memory scanning attempts.
June 24, 2026
Netdata has added NPM-class network monitoring: live topology maps, NetFlow and sFlow traffic analysis, SNMP device and trap monitoring, and a dedicated network dashboard, all unified with your full-stack observability and processed at the edge.
May 30, 2026
The standard advice on high-cardinality observability (aggregate before storage, pay for cardinality, drop the labels) solves the wrong problem. Here's what's actually going on.
May 20, 2026
The netdata/skills repo is an open-source collection of 54 agent skills that teach Claude Code, Cursor, Copilot, and other AI coding agents how to set up OpenTelemetry instrumentation, configure Netdata, and troubleshoot production issues using live telemetry via MCP.
Netdata’s architecture is FERPA-friendly by design - 100% of metrics and logs remain on your infrastructure, with only metadata (hostnames, chart names) transmitted to Netdata Cloud. We maintain SOC 2 Type 2 certification and provide Data Processing Agreements (DPAs) and Business Associate Agreements (BAAs) for regulated environments. While we don’t hold explicit FERPA certification, our data sovereignty model eliminates most compliance risks. For institutions requiring explicit FERPA compliance reports, we recommend supplementing with specialized compliance tools.
Single server: 60 seconds from installation to monitoring with zero configuration. Enterprise deployment: 2-3 days for 1,000+ nodes including topology design, automated deployment, credential configuration, alert review, and team onboarding. Compare this to 3-6 months typical for traditional enterprise monitoring solutions. Our one-line installer works on Linux, Windows, macOS, and FreeBSD with automatic discovery of 800+ integrations.
Netdata Business Plan: Predictable per-node pricing with volume discounts as you grow. Includes unlimited metrics, unlimited logs, unlimited users, ML anomaly detection, AI troubleshooting, and all features with no data volume charges. Compare to alternatives: Traditional monitoring solutions typically charge per-node plus additional fees for metrics volume, log ingestion, and user seats - often resulting in unpredictable bills. Free options: Community Cloud (5 nodes), Homelab (unlimited nodes for non-commercial personal use), Open Source Agent (100% free). Education discounts available.
Yes, through infrastructure-level monitoring. Netdata monitors PHP-FPM (request duration, pool utilization, slow requests), web servers (Apache/NGINX request rates, response times, status codes), databases (MySQL/PostgreSQL query performance, connection pools, slow queries), and server resources (CPU/memory/disk during peak loads). This reveals performance bottlenecks during registration and grading periods. However, Netdata does not provide LMS-specific metrics like course completion rates or student engagement - use your LMS’s native analytics for those. Learn more about application performance monitoring.
Netdata uses systemd-journal (Linux) and Windows Event Logs natively - no log pipelines required. Configure retention directly via systemd/Windows policies for 3-6+ years as needed for FERPA/Title IV compliance. Forward Secure Sealing (FSS) provides tamper-evident logging for audit requirements. Logs stay on-premises for complete data sovereignty. Learn about zero-pipeline logs.
Netdata is not a SIEM replacement but provides excellent infrastructure security monitoring. What Netdata provides: Real-time threat detection (per-second visibility catches 2-10 second attacks), ML-based behavioral analysis (99% false positive reduction in anomaly detection), complete audit trails (SOC 2 Type 2), process/network monitoring, and anomaly detection. What Netdata lacks: Threat intelligence feeds, security-specific correlation rules, compliance dashboards. Recommended approach: Use Netdata for infrastructure monitoring alongside a dedicated SIEM for security correlation and compliance. This combination provides comprehensive security at minimal cost.
Netdata is purpose-built for this scenario. Zero configuration: 800+ integrations auto-discovered in 60 seconds. No query languages: Point-and-click analysis, no PromQL/SQL required. AI troubleshooting: Junior engineers get senior-level insights through natural language queries. Pre-configured alerts: 400+ health checks active immediately. Minimal maintenance: No tuning, no compaction, no database administration. AI Co-Engineer: Ask ‘Why is the database slow?’ and get instant answers with root cause analysis. 48% of organizations cite lack of knowledge as their biggest observability challenge - Netdata eliminates this barrier. Learn about AI features.
Yes, with the same architecture - no redesign required. Netdata scales linearly from 1 to 100,000+ nodes. Proven scale: Single installations monitoring 100,000+ nodes, processing 4.5+ billion metrics/second globally. Cost scaling: Volume discounts reduce per-node price as you grow. Performance: Adding nodes adds capacity, not complexity. Architecture: Distributed edge-native design eliminates central bottlenecks. Resource efficiency: 36% less CPU, 88% less RAM, 97% less disk I/O versus Prometheus at scale (Netdata benchmark at 4.6 million metrics/second). Learn about infinite scalability.
Netdata advantages: Zero configuration (vs weeks of setup), algorithmic dashboards (vs manual building), per-second granularity (vs 10-second default), ML anomaly detection (vs manual threshold tuning), AI troubleshooting (vs query languages), and logs management (vs separate Loki setup). Prometheus/Grafana advantages: 100% free, massive community, ultimate flexibility. Cost comparison: Netdata Business requires predictable per-node investment vs Prometheus/Grafana requiring significant engineering time. Best for education: Netdata if you have limited IT staff and need instant value; Prometheus/Grafana if you have skilled engineers and time to build. See detailed comparison.
Community Plan: GitHub discussions, Discord community, documentation. Business Plan: Email/ticket support during business hours with SLA. Enterprise: 24/7 support, dedicated team, phone support, custom SLAs. Professional services: Implementation assistance, architecture design, migration support, training programs. Education discounts: Available for institutional pricing - contact sales. Documentation: Comprehensive guides at learn.netdata.cloud. Community: Active forums with 76,300+ GitHub stars and responsive maintainers.
Yes, multiple ways: (1) Free Community Cloud: 5 nodes, all features, no credit card required. (2) Open Source Agent: 100% free, unlimited nodes, local dashboards at http://localhost:19999. (3) 14-day Business trial: Full features, unlimited nodes, no restrictions. (4) Live demo: View our demo environment without installation. (5) Homelab plan: Unlimited nodes for non-commercial personal testing. Installation: One-line command, 60 seconds to monitoring. No risk: Cancel anytime, no long-term contracts required. Start free trial.
Step 1: Start free trial or install Open Source Agent on a test server. Step 2: Experience auto-discovery (800+ integrations found in 60 seconds). Step 3: Explore pre-configured dashboards and 400+ alerts. Step 4: Test AI troubleshooting and anomaly detection. Step 5: Contact sales for institutional pricing and education discounts. Step 6: Deploy across infrastructure using automation tools (Ansible, Terraform, Helm). Timeline: Proof of concept in 1 day, full deployment in 2-3 days. Support: We provide implementation assistance and architecture guidance.
800+ integrations including: LMS: Canvas, Moodle, Blackboard (via PHP-FPM, web server, database monitoring). Databases: MySQL, PostgreSQL, Oracle, MongoDB, Redis, MS SQL Server. Web servers: Apache, NGINX, IIS, Lighttpd. Cloud: AWS, Azure, Google Cloud (via Prometheus exporters). Containers: Docker, Kubernetes, Podman, LXC. Virtualization: VMware, Hyper-V, Proxmox, Xen. Network: SNMP devices, routers, switches, firewalls. Authentication: Active Directory, LDAP, SSO/OIDC. Monitoring: Prometheus, Grafana, Splunk integration. Custom: StatsD, OpenTelemetry, REST APIs. View all integrations.
Yes, ideal for research environments. Minimal overhead: <5% CPU, 150-200MB RAM doesn’t impact research workloads (University of Amsterdam validation confirms Netdata has the lowest overhead among monitoring tools). HPC monitoring: GPU utilization (NVIDIA/AMD), PCIe bandwidth, compute node resources, job queue status, network interconnect. Edge devices: Field-deployed sensors, remote instruments, distributed research equipment. Data sovereignty: Critical for federally-funded research (NIST 800-171 compliance support). Scalability: Monitor thousands of compute nodes with linear scaling. Retention: Years of per-second data for capacity planning and performance analysis. Learn about HPC monitoring.
Your data remains 100% accessible. All metrics and logs are stored on your infrastructure - Netdata Cloud only provides unified access and management. If you disconnect: (1) Local dashboards continue working at http://localhost:19999 on each Agent. (2) Parent dashboards provide multi-node visibility. (3) All historical data remains on your systems. (4) Alerts continue evaluating and notifying. (5) ML anomaly detection keeps running. No vendor lock-in: Your data is yours, stored in open formats (systemd-journal, Windows Event Logs, Netdata’s TSDB). Export options: REST API, Prometheus, InfluxDB, Graphite for data portability.
Partially. Netdata can monitor vendor infrastructure and APIs: HTTP endpoint checks (uptime, response time, status codes), TCP port connectivity, DNS resolution, X.509 certificate expiration, and API performance. What Netdata cannot do: Vendor security posture monitoring, automated compliance verification (FERPA/COPPA/SOC 2), breach indicator detection, or contract compliance tracking. Recommendation: Use Netdata for vendor infrastructure monitoring alongside a dedicated third-party risk management platform for comprehensive vendor risk management of 100-300+ EdTech vendors.
Designed for distributed infrastructure. Architecture: Deploy Agents on all servers across all campuses. Centralization: Optional Parent clusters per campus/region for local aggregation. Unified view: Netdata Cloud provides infrastructure-wide dashboards across all locations. Network efficiency: Agents operate independently; Parents aggregate locally; only metadata travels to Cloud. High availability: Active-active Parents with automatic failover. Isolation: Create Rooms per campus/department for team segmentation. Scalability: Same architecture works for 2 campuses or 200. Example: Main campus + 5 satellite locations + cloud infrastructure - all unified in one view.
Minimal to none. No query languages: Point-and-click analysis, no PromQL/SQL/custom DSLs. Algorithmic dashboards: Generated automatically based on discovered data. AI assistance: Natural language troubleshooting (‘Why is this slow?’). Pre-configured alerts: 400+ health checks work immediately. Onboarding: 60 seconds from install to monitoring. Documentation: Comprehensive guides at learn.netdata.cloud. Support: Community forums, Discord, email/ticket support. Skill democratization: Junior engineers get senior-level insights through AI. Time to productivity: Hours, not months.
Yes, Netdata integrates well. Export metrics to: Prometheus, InfluxDB, Graphite, OpenTSDB, TimescaleDB. Visualize in: Grafana (native datasource plugin). Alert to: PagerDuty, Opsgenie, Slack, MS Teams, email, webhooks. SIEM integration: Forward alerts to Splunk, QRadar, Microsoft Sentinel. Log integration: systemd-journal and Windows Event Logs readable by existing tools. API access: REST API v3 for custom integrations. Common pattern: Use Netdata for infrastructure monitoring + specialized APM for code-level profiling + SIEM for security correlation. Consolidation path: Many organizations start with integration, then consolidate to Netdata as primary platform.
Community (Free): 5 nodes, 4-hour alert retention, 1 custom dashboard, basic features. Homelab: Unlimited nodes, 60-day alerts, unlimited dashboards, all features - personal non-commercial use only. Business: Unlimited nodes, 90-day alerts, unlimited dashboards, RBAC, SSO/OIDC, SCIM, enterprise notifications (PagerDuty, Opsgenie, Slack, MS Teams), AI features (10 sessions/month), Windows monitoring, audit logs, 99.9% SLA, premium support. All plans include: Unlimited metrics, unlimited logs, unlimited users, ML anomaly detection, real-time monitoring, zero-pipeline logs. Compare plans.
Netdata AI is embedded throughout the platform, not bolted on. AI Co-Engineer: Natural language troubleshooting via Model Context Protocol (MCP) - works with Claude, ChatGPT, Gemini, and more. AI Insights: Automated reports (Infrastructure Summary, Capacity Planning, Performance Optimization, Anomaly Analysis) generated in 2-3 minutes. Alert AI Assistant: One-click explanations for any alert with recommended actions. ML anomaly detection: 18 models per metric trained locally at the edge (not cloud-dependent), achieving 99% false positive reduction in anomaly detection. Root cause analysis: Finds root cause in the top 30-50 metrics most correlated with the issue. Bring Your Own LLM: Use your preferred AI provider or run locally. Key difference: Netdata’s ML runs at the edge on your infrastructure, not in vendor clouds.