 |
VOOZH | about |
|
VOOZH | about |
The only agent that thinks for itself
Autonomous Monitoring with self-learning AI built-in, operating independently across your entire stack.
Centralized metrics streaming and storage
Aggregate metrics from multiple agents into centralized Parent nodes for unified monitoring across your infrastructure.
Fully managed cloud platform
Access your monitoring data from anywhere with our SaaS platform. No infrastructure to manage, automatic updates, and global availability.
Deploy Netdata Cloud in your infrastructure
Run the full Netdata Cloud platform on-premises for complete data sovereignty and compliance with your security policies.
Powerful, intuitive monitoring interface
Modern, responsive UI built for real-time troubleshooting with customizable dashboards and advanced visualization capabilities.
Monitor on the go
Native iOS and Android apps bring full monitoring capabilities to your mobile device with real-time alerts and notifications.
The future of infrastructure observability
See our strategic direction across AI-native observability, full-stack signals, operational intelligence, and enterprise platform maturity.
Best energy efficiency
True real-time per-second
100% automated zero config
Centralized observability
Multi-year retention
High availability built-in
Zero maintenance
Always up-to-date
Enterprise security
Complete data control
Air-gap ready
Compliance certified
Millisecond responsiveness
Infinite zoom & pan
Works on any device
Native performance
Instant alerts
Monitor anywhere
AI-native observability
Continuous delivery
Open source foundation
80% Faster Incident Resolution
True Real-Time and Simple, even at Scale
90% Cost Reduction, Full Fidelity
See and Map Your Entire Network
Single Pane of Glass
Control Without Surrender
Integrations
800+ collectors and notification channels, auto-discovered and ready out of the box.
Reduced monitoring costs by 46% while cutting staff overhead by 67%.
— Leonardo Antunez, Codyas
No data shipping. No central storage costs. Query at the edge.
So many out-of-the-box features! I mostly don't have to develop anything.
— Simon Beginn, LANCOM Systems
Point-and-click troubleshooting. No PromQL, no LogQL, no learning curve.
Enterprise efficiency without enterprise complexity—real ROI from day one.
— Leonardo Antunez, Codyas
Zero data egress. Only metadata reaches the cloud. Your metrics stay on your infrastructure.
Auto-discovered and configured. No manual setup required.
Slack, PagerDuty, Teams, email, webhooks—all built-in.
Built for the People Who Get Paged
Every Industry Has Rules. We Master Them.
Monitor Any Technology. Configure Nothing.
Complete Visibility. Total Control.
Don't Take Our Word for It
Netdata gives more than you invest in it. A rare unicorn that obeys the Pareto rule.
— Eduard Porquet Mateu, TMB Barcelona
Reduced website downtime by 99% and cloud bill by 30% using Netdata alerts.
— Falkland Islands Government
Optimized resource allocation based on Netdata alerts cut cloud spending by 30%.
— Falkland Islands Government
Reduced monitoring staff by 67% while cutting operational costs by 46%.
— Codyas
Netdata has agent capacity or a plugin for everything, including Windows and Kubernetes.
— Eduard Porquet Mateu, TMB Barcelona
So many out-of-the-box features! I mostly don't have to develop anything.
— Simon Beginn, LANCOM Systems
From 2-3 minutes to 30 seconds—instant visibility into any node issue.
— Matthew Artist, Nodecraft
20% less downtime and 40% budget optimization from out-of-the-box monitoring.
— Simon Beginn, LANCOM Systems
Pay per Node. Unlimited Everything Else.
One price per node. Unlimited metrics, logs, users, and retention. No per-GB surprises.
What's Your Monitoring Really Costing You?
Most teams overpay by 40-60%. Let's find out why.
Your Infrastructure Is Unique. Let's Talk.
Because monitoring 10 nodes is different from monitoring 10,000.
Monitoring That Sells Itself
Deploy in minutes. Impress clients in hours. Earn recurring revenue for years.
Per-Second Metrics at Homelab Prices
Same engine, same dashboards, same ML. Just priced for tinkerers.
$1,000 Per Referral. Unlimited Referrals.
Your colleagues get 10% off. You get 10% commission. Everyone wins.
"Netdata's significant positive impact" — LANCOM Systems
Compare vs Datadog, Grafana, Dynatrace
"Cut costs by 46%, staff by 67%" — Codyas
"Reduced cloud bill by 30%" — Falkland Islands Gov
"Better observability with Netdata than combining other tools." — TMB Barcelona
DPA, SLAs, on-prem, volume pricing
One command, 30 seconds, real data—no sandbox needed
Auto-config + per-node pricing = predictable profit
8-episode Netdata tutorial by LearnLinux.tv
3rd most starred monitoring project
Customers report 40-67% cost cuts, 99% downtime reduction
Free tier lets them try before they buy
AI Support Assistant, Available 24/7
Nedi has access to all official documentation, source code, and resources. Ask any question about Netdata—responds in your language.
Engineering Insights & Product Updates
Jun 2026
Network Monitoring, the Netdata Way: …
Interface counters tell you a port is busy. …
Jun 2026
5 Best SolarWinds Alternatives for 2026
As organizations modernize their …
Jun 2026
SolarWinds Price Increases 2026: What …
If you’re a SolarWinds customer facing …
May 2026
High-cardinality metrics at scale: why …
The “high cardinality is …
Never Fight Fires Alone
Docs, community, and expert help—pick your path to resolution.
60 Seconds to First Dashboard
One command to install. Zero config. 850+ integrations documented.
Level Up Your Monitoring
76,000+ Engineers Strong
Per-Second. 90% Cheaper. Data Stays Home.
See why teams switch from Datadog, Prometheus, Grafana, and more.
> Browse all comparisonsTrace issues directly in the source code
Get architecture recommendations
One of the most popular open-source monitoring projects
Enterprise-grade security and compliance
Your metrics stay on your infrastructure
"Most energy-efficient monitoring solution" — ICSOC 2023, peer-reviewed
"Doesn't miss alerts—mission-critical trust for safety software"
Global community improving monitoring for everyone
Trusted by teams worldwide
Free forever, fully open source agent
Work from anywhere, async-friendly culture
Your work helps millions of systems
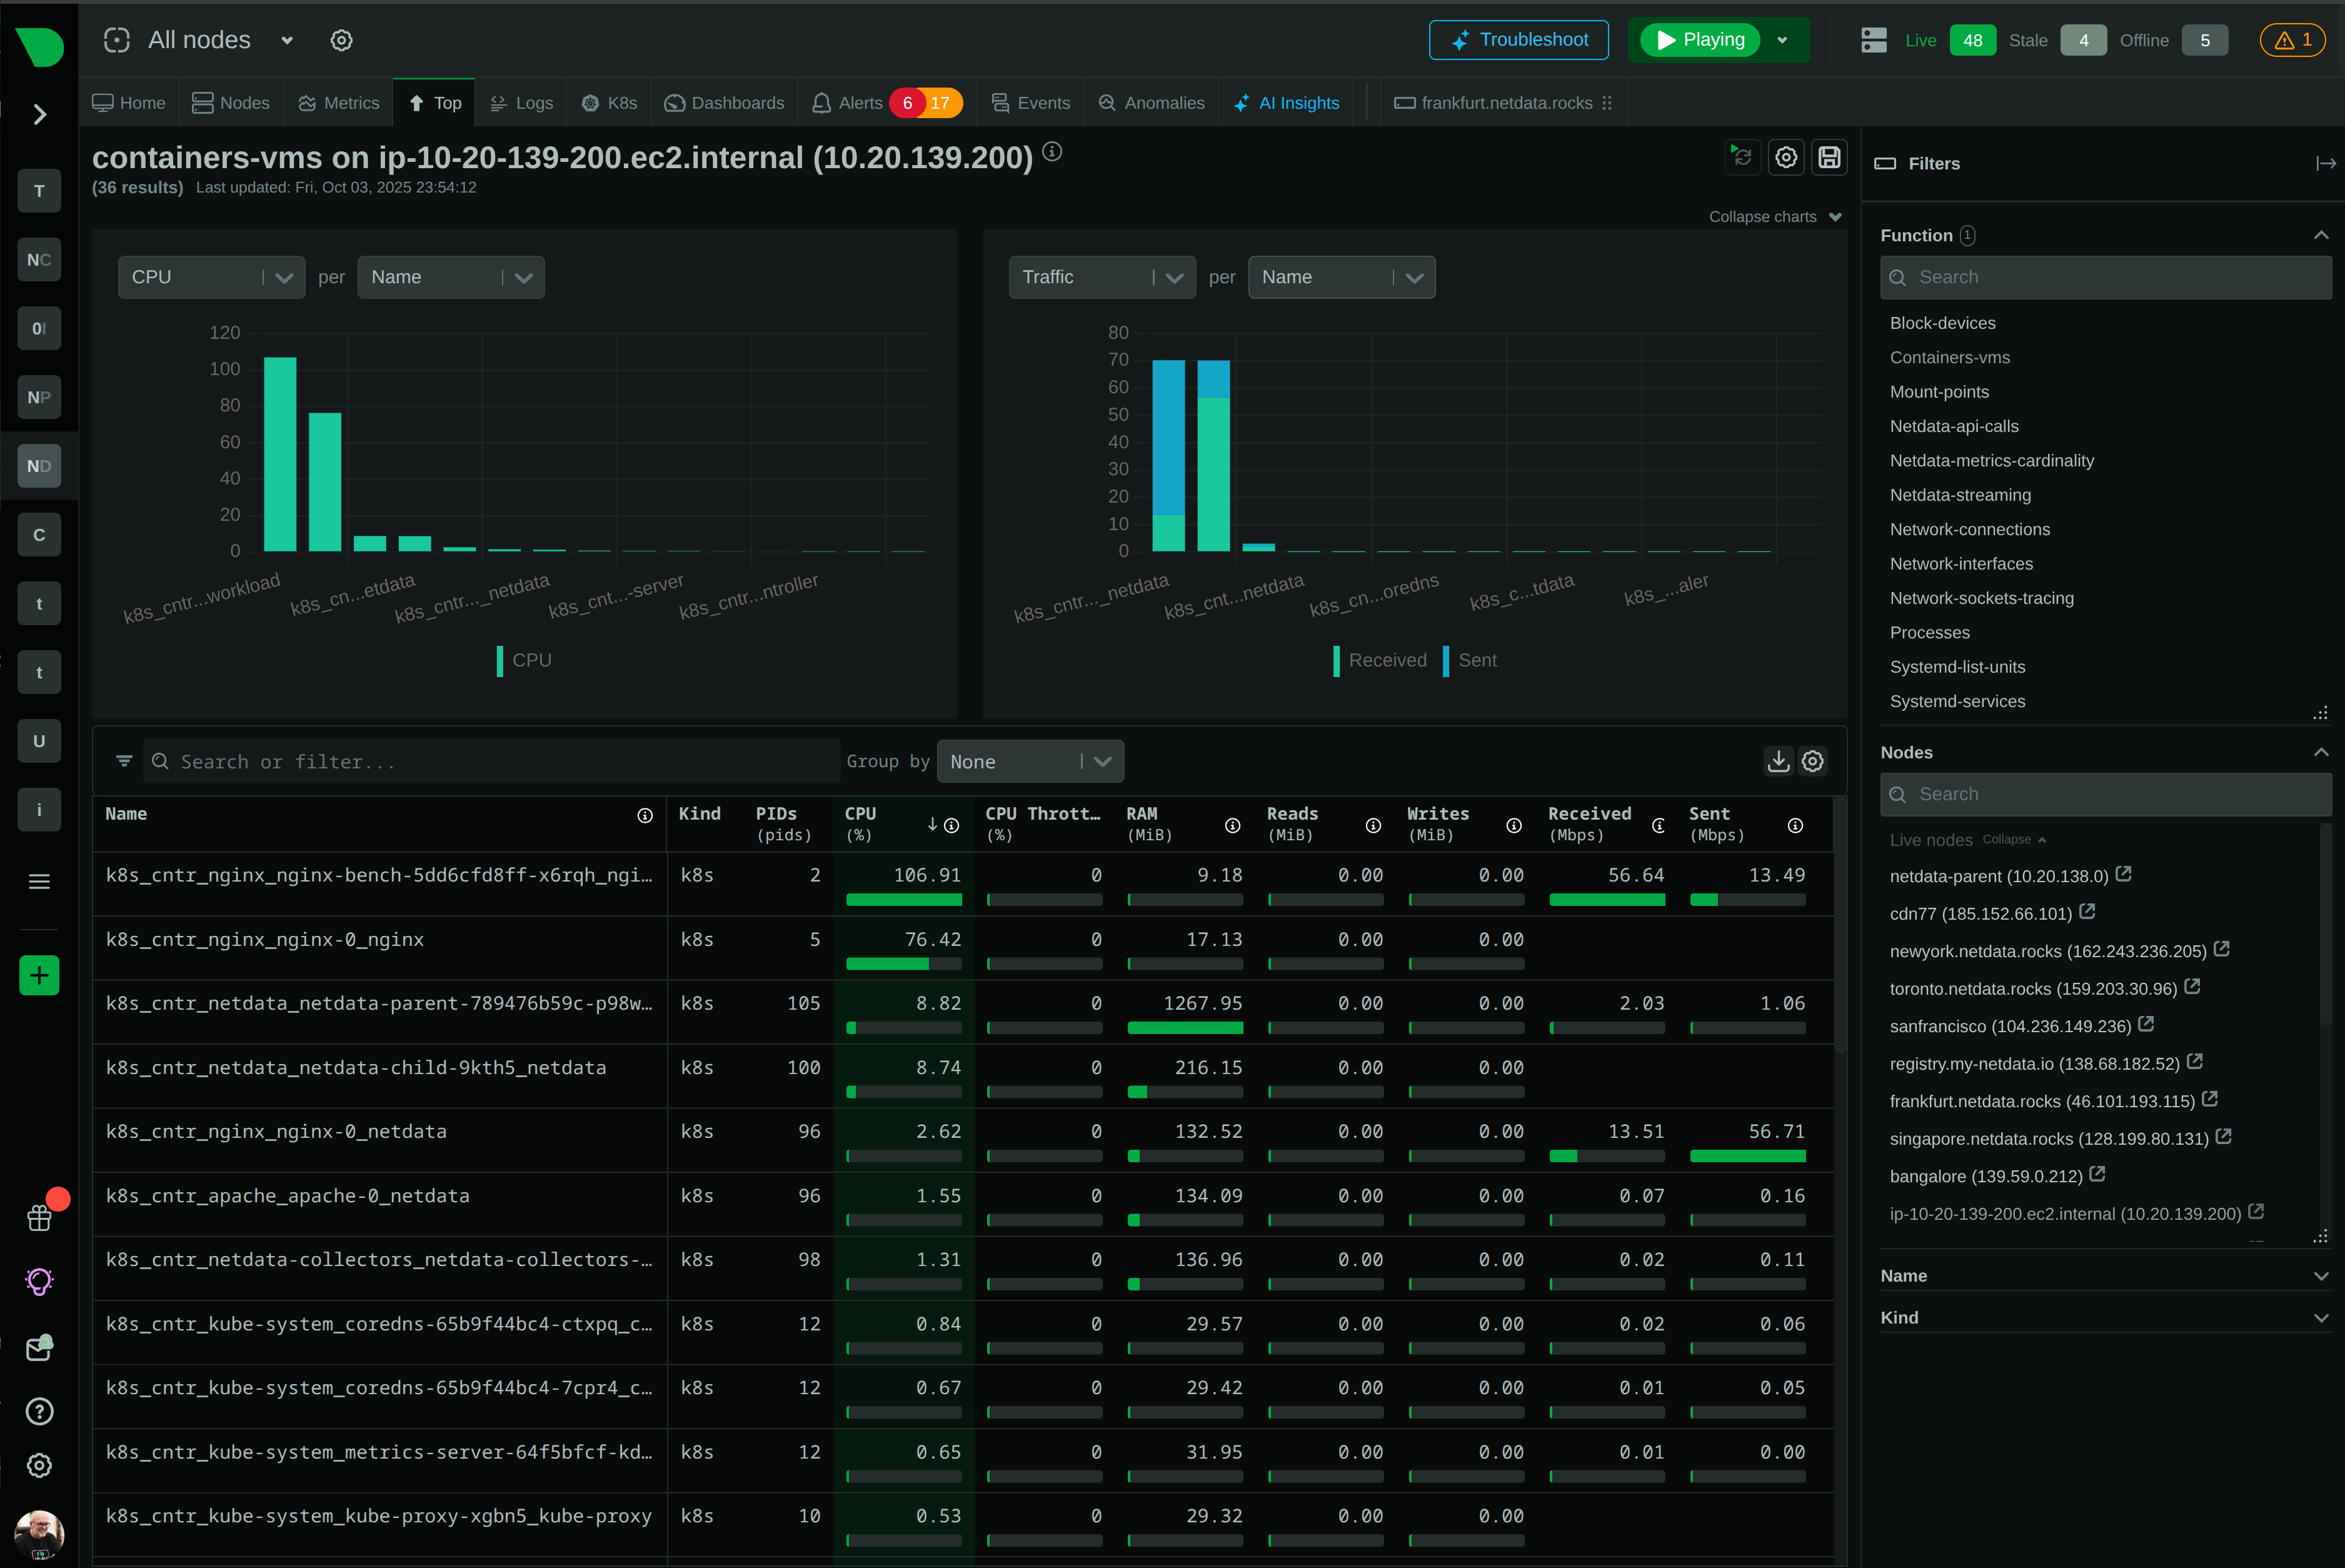
The Live tab gives you real-time access to Netdata Functions - specialized routines provided by collectors that deliver live information from your monitored nodes. Process explorers, database monitoring, network topology maps, diagnostics, and troubleshooting actions - all from your browser.
Real-time functions executed directly on your nodes
Browser-based replacement for top, htop, and ps. Sort, filter, and group processes with full historical data and ML context.
Top Queries for PostgreSQL, MySQL, SQL Server, Oracle, ClickHouse, and MongoDB. See which queries consume the most resources.
Active network connections ranked by bandwidth with connection states, protocols, and traffic statistics.
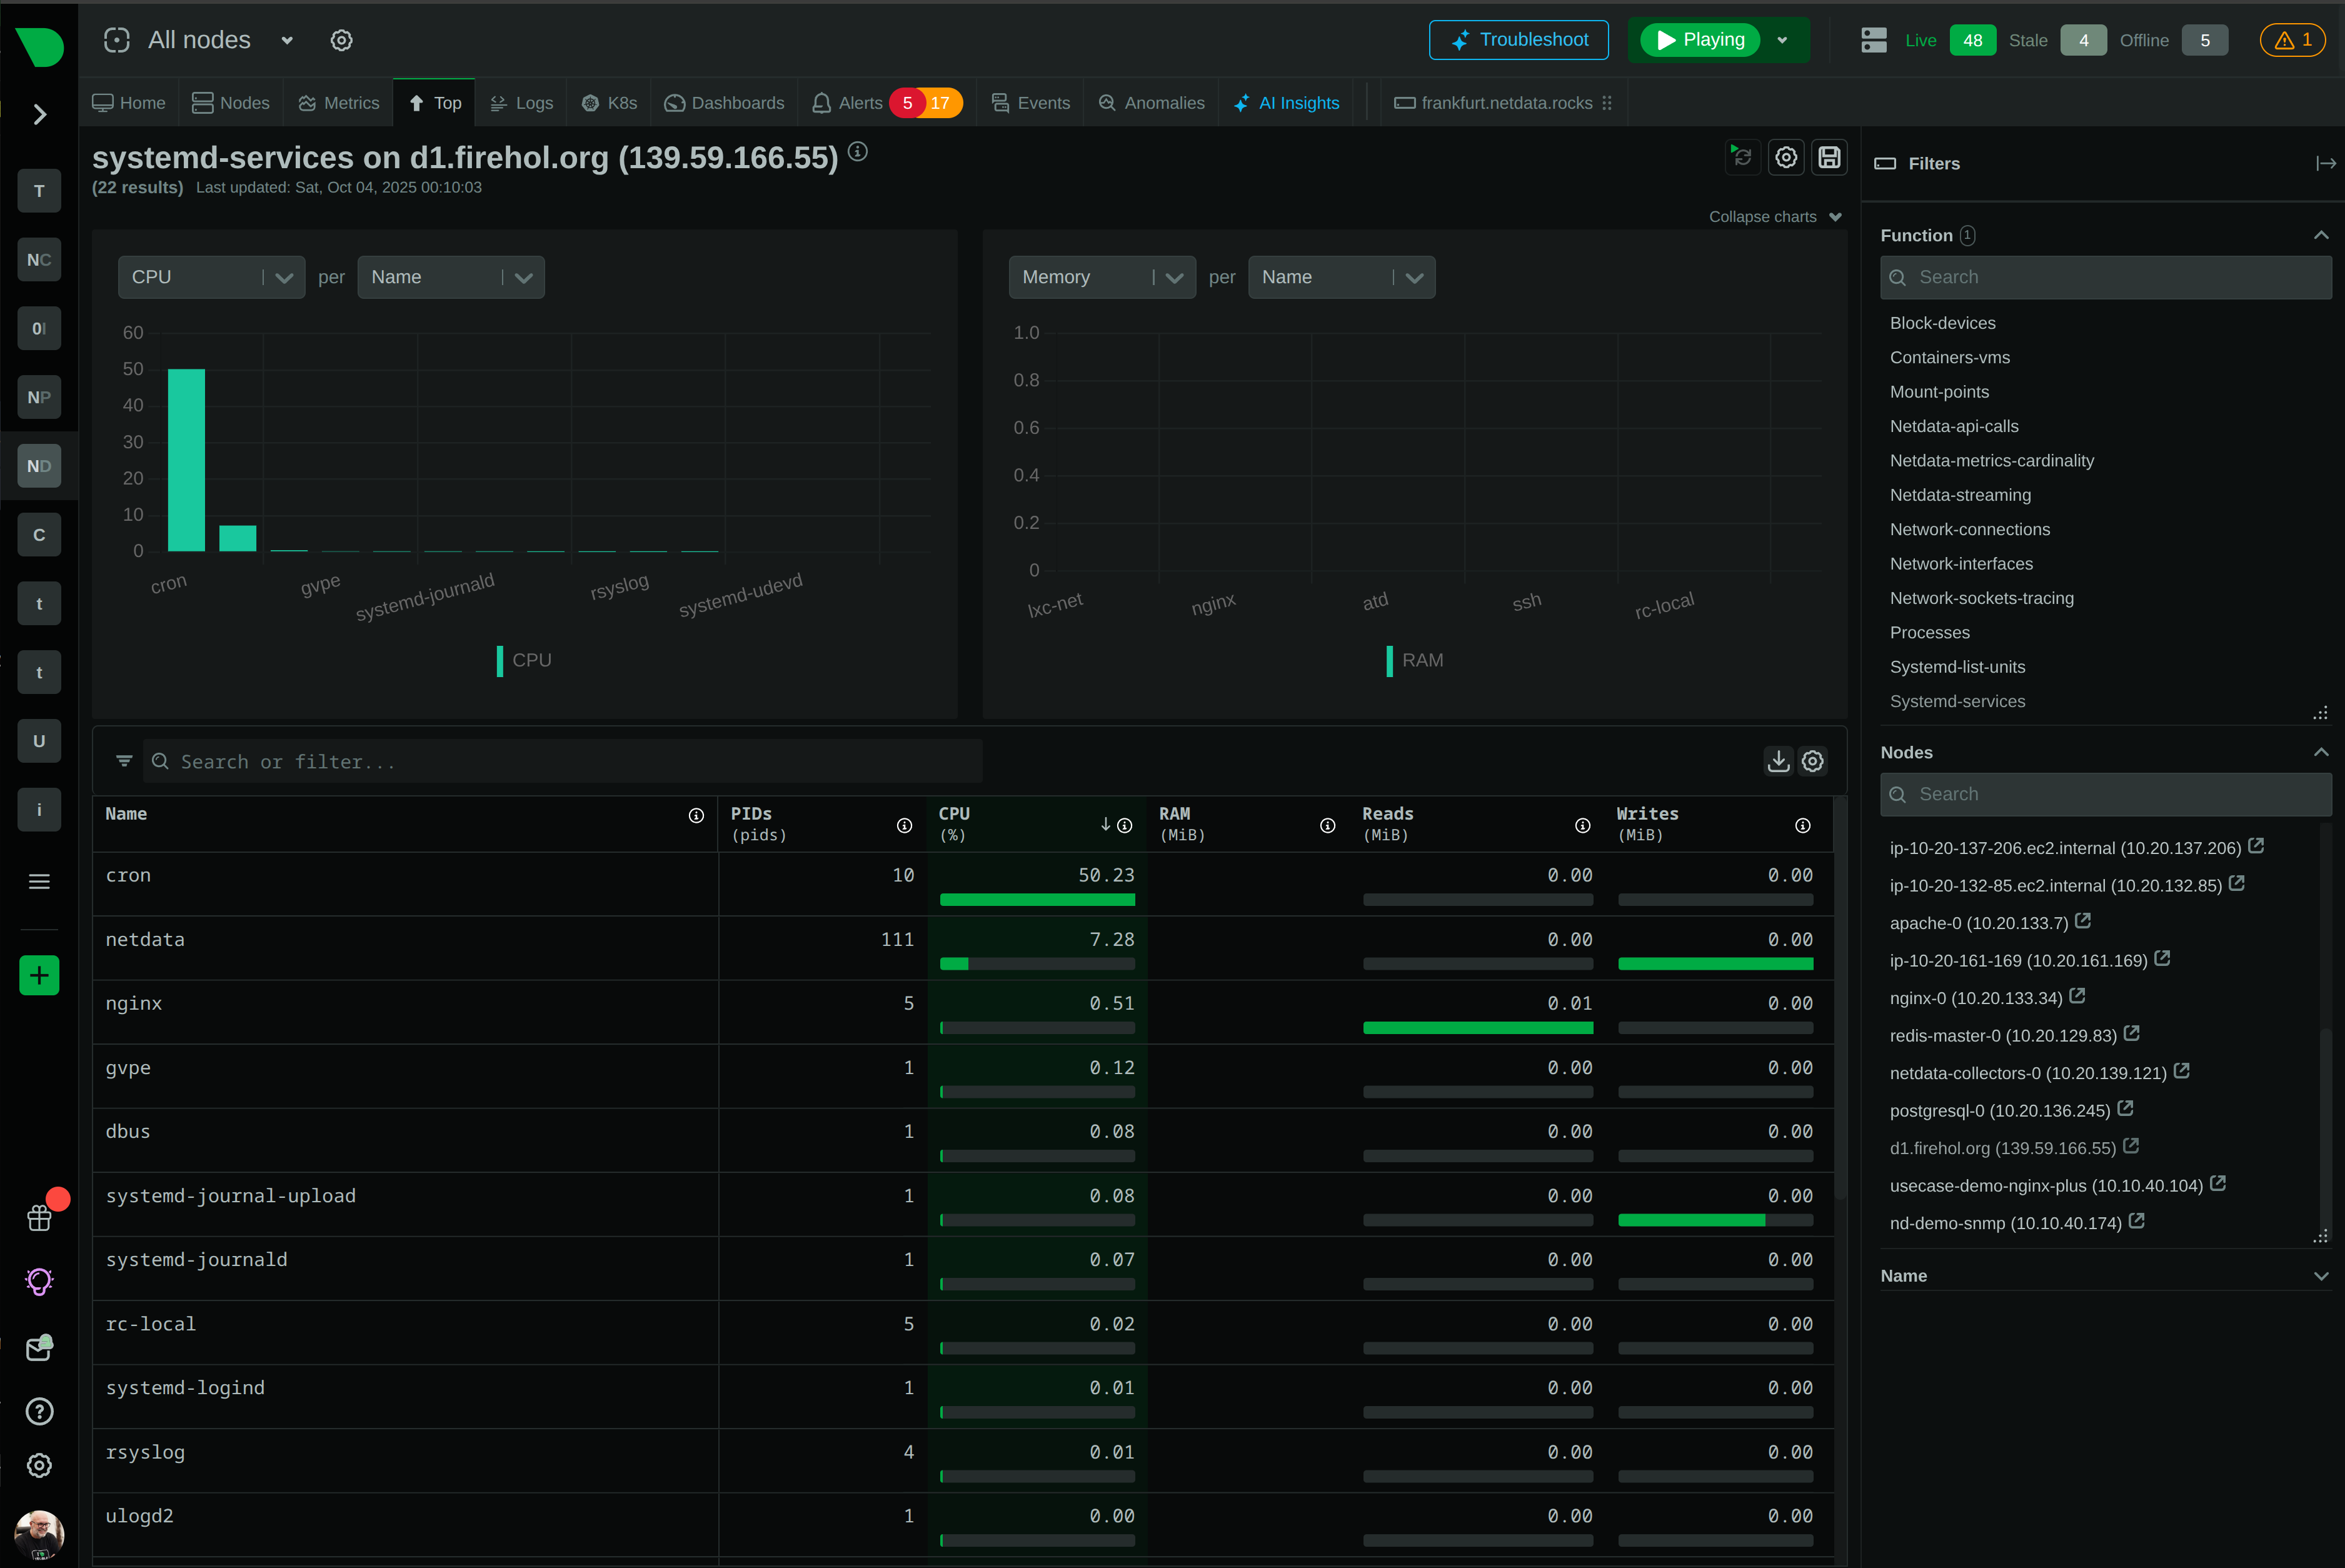
All systemd units with resource metrics. Track service CPU, memory, and I/O without manual configuration.
Every process, container, and service tracked from the moment it starts. Zero configuration, zero blind spots.
Retrieve extra diagnostic information and perform troubleshooting actions directly on the node - all from your browser.
Trusted by operations teams worldwide
top, htop, and ps with browser-based visibility. Sort by any metric, filter by category or user, and see historical data - not just current state. Give operations teams console-quality insights without infrastructure access.80% MTTR reduction
Learn about Troubleshooting
Per-second query insights
View Database Monitoring
Zero-config Kubernetes monitoring
View Kubernetes Integration
99% false positive reduction
Discover Anomaly Advisor
Why Netdata Wins
See how Netdata’s Live tab transforms troubleshooting from complex queries to instant insights
Capability
Netdata
Traditional Monitoring
Query Language Required
None
Point-and-click interactive dropdowns
PromQL/SQL Required
Complex syntax for simple questions
Time to First Insight
60 Seconds
From install to actionable data
Hours to Weeks
Configuration and dashboard building required
Data Granularity
Per-Second
Captures microbursts and transient spikes
Per-Minute
Averages hide critical patterns
Process Tracking
Automatic
Every PID discovered and grouped
Manual Config
Requires agent configuration
Container Monitoring
Native Integration
Zero-config Kubernetes support
Separate Tools
Additional components required
ML Anomaly Detection
Included
18 models per metric, automatic
Paid Add-On
Extra cost or not available
Live Functions on Nodes
Yes
Process explorer, top queries, network topology
No
SSH required for live diagnostics
Historical Process Data
Full History
See what happened during incidents
Current State Only
SSH tools show live data only
Pricing Model
Flat Per-Node
Unlimited metrics and processes
Volume-Based
Costs increase with data collected
Total Cost of Ownership
90% Cost Reduction
Predictable and transparent pricing
Exponential Scaling
Costs grow with metrics volume
Browser-based process explorer with sorting, filtering, and historical data. Replaces SSH and console tools with team-friendly collaboration.
Real-time process intelligence
Explore IntegrationsPer-container CPU, memory, I/O, and network metrics with automatic Kubernetes label integration. Monitor resource limits, throttling, and OOM risks.
Zero-config container monitoring
View Container MonitoringKubernetes cluster overview with pod, container, and node metrics. Drill down from namespace to specific PID without kubectl commands.
Complete K8s visibility
View Kubernetes SolutionActive network connections ranked by bandwidth with connection states and activity. Identify bandwidth hogs and unusual connection patterns instantly.
Per-connection visibility
Learn About Network MonitoringAll systemd units with resource metrics and unit-level consumption. Track service CPU, memory, and I/O without manual configuration.
Service-level insights
Explore IntegrationsSee which queries consume the most CPU, I/O, and time across PostgreSQL, MySQL, SQL Server, Oracle, ClickHouse, and MongoDB. Deadlock detection, error attribution, and running query visibility.
Per-second query insights
View Database MonitoringEverything the Live tab puts at your fingertips
Every process, container, and service tracked from creation without configuration or manual setup.
Thousands of PIDs organized into meaningful application categories with accumulated metrics from process families.
Eighteen unsupervised models per metric achieve 99% false positive reduction through consensus-based detection.
Interactive dropdowns with real-time statistics enable sorting and filtering without learning query languages.
Automatic correlation from Kubernetes cluster to specific PID reveals complete root cause paths.
Capture microbursts and transient spikes that minute-averaging hides with true real-time monitoring.
See what happened during incidents with full historical data, not just current state snapshots.
Flat per-node pricing with unlimited metrics eliminates anxiety about collecting comprehensive data.
Database query performance across PostgreSQL, MySQL, SQL Server, Oracle, ClickHouse, MongoDB - sorted by CPU, I/O, time.
Real-time deadlock metrics and graphs for SQL Server, PostgreSQL, and MySQL with immediate alerts.
Track query errors and failures with attribution to specific queries and error types.
June 24, 2026
Netdata has added NPM-class network monitoring: live topology maps, NetFlow and sFlow traffic analysis, SNMP device and trap monitoring, and a dedicated network dashboard, all unified with your full-stack observability and processed at the edge.
June 23, 2026
Discover the top SolarWinds alternatives for 2026. Compare modern monitoring platforms built for cloud-native infrastructure - now with NPM-class network monitoring - with transparent pricing and real-time insights.
June 23, 2026
Understanding SolarWinds' subscription-only pricing changes following the Turn/River Capital acquisition, and exploring your options for infrastructure monitoring.
The Live tab gives you real-time access to Netdata Functions that can be executed on any node running the Netdata Agent. These specialized routines, provided by various collectors, deliver live information from your monitored nodes - including process explorers, database monitoring functions, network topology maps, and more. You can use these Functions to retrieve extra diagnostic information and perform troubleshooting actions directly on the node.
The Live tab provides access to several built-in Functions: Process Explorer (replaces top/htop with browser-based process monitoring), Top Queries (database query performance for PostgreSQL, MySQL, SQL Server, Oracle, ClickHouse, MongoDB), Network Connections (active connections ranked by bandwidth), Systemd Services (service resource usage), Block Devices (disk I/O like iostat), and Mount Points (filesystem usage like df). Additional Functions are provided by individual collectors.
The Metrics tab shows time-series data collected and stored by the agent - historical charts you can scroll through. The Live tab executes Functions on your nodes in real-time to retrieve current diagnostic information that isn’t stored as time-series. Think of it as running console commands (top, netstat, iostat) from your browser, with the added benefits of ML context, filtering, and team collaboration.
Netdata tracks both running and exited processes, accumulating metrics from entire process families. This captures resource usage from short-lived subprocesses that traditional monitoring misses - critical for shell scripts, CI/CD pipelines, and automation jobs. Plus, PSS (Proportional Set Size) memory accounting reveals true memory consumers versus processes merely sharing libraries.
Yes. Deploy Netdata’s DaemonSet and every pod, container, and process appears automatically with full Kubernetes label integration (namespace, pod, deployment). Per-container CPU, memory, I/O, and network metrics reveal resource limit utilization, throttling, and OOM risks - with zero configuration or instrumentation required.
During incidents, highlight any timeframe on any chart (15 seconds minimum). Anomaly Advisor analyzes ALL metrics across ALL nodes simultaneously, ranking them by ML-powered relevance. The root cause typically surfaces in the top 30-50 results. You can then use Live tab Functions to dig deeper - examining specific processes, database queries, or network connections on the affected node.
The Process Explorer provides browser-based access with the same per-second precision as console tools, plus historical data, ML anomaly detection, and team collaboration. No SSH access required, works through firewalls, and shows what happened during incidents - not just current state. It’s console-quality debugging without infrastructure access.
Most resource issues last seconds, not minutes. A process spiking to 100% CPU for 5 seconds every 30 seconds appears as harmless 17% average in minute-level monitoring. Netdata’s per-second data captures microbursts, transient spikes, and brief resource hogs that averaging hides - revealing the truth, not statistical approximations.
Yes. Netdata automatically correlates from Kubernetes cluster to namespace to pod to container to process to PID. Click any resource spike and see the complete path: which pod, which container, which process category, which specific PID. No context switching between tools, no manual timestamp correlation - just instant visibility.
Yes. The Top Queries function retrieves query performance data directly from your database engines. PostgreSQL uses pg_stat_statements, MySQL uses performance_schema, SQL Server uses Extended Events, Oracle uses V$SQLSTATS, ClickHouse uses system.query_log, and MongoDB uses system.profile. Sort by CPU time, elapsed time, logical reads, physical reads, executions, or rows returned. See Database Monitoring for details.
Yes. Netdata provides real-time deadlock detection for SQL Server (deadlock graphs via Extended Events), PostgreSQL (via pg_stat_activity and pg_stat_database), and MySQL (InnoDB deadlock counts). Alerts fire immediately when deadlocks occur, not after users complain.
Install Netdata (60 seconds), and all Functions become available automatically. The Process Explorer, Network Connections, Systemd Services, and other Functions work immediately. Database Top Queries require the corresponding collector to be configured. No dashboard building, no query language learning - just instant access.
Yes. Netdata complements existing tools through OpenTelemetry support, Prometheus export, and Grafana integration. Use the Live tab for real-time diagnostics and detailed troubleshooting while maintaining your existing observability stack. Visit our integrations page for the complete list.
None. The Live tab is designed for operations teams of all skill levels. Junior engineers get senior-level insights through intuitive interfaces that require zero query language knowledge. Automatic discovery, interactive sorting and filtering, and ML-powered prioritization make every team member effective from day one.
Netdata tracks resources from creation to deletion, capturing complete lifecycle metrics even for containers lasting seconds. Accumulated metrics from exited children reveal total resource impact of ephemeral workloads. Historical data shows what happened during incidents, not just current state - critical for dynamic Kubernetes environments.