 |
VOOZH | about |
|
VOOZH | about |
The only agent that thinks for itself
Autonomous Monitoring with self-learning AI built-in, operating independently across your entire stack.
Centralized metrics streaming and storage
Aggregate metrics from multiple agents into centralized Parent nodes for unified monitoring across your infrastructure.
Fully managed cloud platform
Access your monitoring data from anywhere with our SaaS platform. No infrastructure to manage, automatic updates, and global availability.
Deploy Netdata Cloud in your infrastructure
Run the full Netdata Cloud platform on-premises for complete data sovereignty and compliance with your security policies.
Powerful, intuitive monitoring interface
Modern, responsive UI built for real-time troubleshooting with customizable dashboards and advanced visualization capabilities.
Monitor on the go
Native iOS and Android apps bring full monitoring capabilities to your mobile device with real-time alerts and notifications.
The future of infrastructure observability
See our strategic direction across AI-native observability, full-stack signals, operational intelligence, and enterprise platform maturity.
Best energy efficiency
True real-time per-second
100% automated zero config
Centralized observability
Multi-year retention
High availability built-in
Zero maintenance
Always up-to-date
Enterprise security
Complete data control
Air-gap ready
Compliance certified
Millisecond responsiveness
Infinite zoom & pan
Works on any device
Native performance
Instant alerts
Monitor anywhere
AI-native observability
Continuous delivery
Open source foundation
80% Faster Incident Resolution
True Real-Time and Simple, even at Scale
90% Cost Reduction, Full Fidelity
See and Map Your Entire Network
Single Pane of Glass
Control Without Surrender
Integrations
800+ collectors and notification channels, auto-discovered and ready out of the box.
Reduced monitoring costs by 46% while cutting staff overhead by 67%.
— Leonardo Antunez, Codyas
No data shipping. No central storage costs. Query at the edge.
So many out-of-the-box features! I mostly don't have to develop anything.
— Simon Beginn, LANCOM Systems
Point-and-click troubleshooting. No PromQL, no LogQL, no learning curve.
Enterprise efficiency without enterprise complexity—real ROI from day one.
— Leonardo Antunez, Codyas
Zero data egress. Only metadata reaches the cloud. Your metrics stay on your infrastructure.
Auto-discovered and configured. No manual setup required.
Slack, PagerDuty, Teams, email, webhooks—all built-in.
Built for the People Who Get Paged
Every Industry Has Rules. We Master Them.
Monitor Any Technology. Configure Nothing.
Complete Visibility. Total Control.
Don't Take Our Word for It
Netdata gives more than you invest in it. A rare unicorn that obeys the Pareto rule.
— Eduard Porquet Mateu, TMB Barcelona
Reduced website downtime by 99% and cloud bill by 30% using Netdata alerts.
— Falkland Islands Government
Optimized resource allocation based on Netdata alerts cut cloud spending by 30%.
— Falkland Islands Government
Reduced monitoring staff by 67% while cutting operational costs by 46%.
— Codyas
Netdata has agent capacity or a plugin for everything, including Windows and Kubernetes.
— Eduard Porquet Mateu, TMB Barcelona
So many out-of-the-box features! I mostly don't have to develop anything.
— Simon Beginn, LANCOM Systems
From 2-3 minutes to 30 seconds—instant visibility into any node issue.
— Matthew Artist, Nodecraft
20% less downtime and 40% budget optimization from out-of-the-box monitoring.
— Simon Beginn, LANCOM Systems
Pay per Node. Unlimited Everything Else.
One price per node. Unlimited metrics, logs, users, and retention. No per-GB surprises.
What's Your Monitoring Really Costing You?
Most teams overpay by 40-60%. Let's find out why.
Your Infrastructure Is Unique. Let's Talk.
Because monitoring 10 nodes is different from monitoring 10,000.
Monitoring That Sells Itself
Deploy in minutes. Impress clients in hours. Earn recurring revenue for years.
Per-Second Metrics at Homelab Prices
Same engine, same dashboards, same ML. Just priced for tinkerers.
$1,000 Per Referral. Unlimited Referrals.
Your colleagues get 10% off. You get 10% commission. Everyone wins.
"Netdata's significant positive impact" — LANCOM Systems
Compare vs Datadog, Grafana, Dynatrace
"Cut costs by 46%, staff by 67%" — Codyas
"Reduced cloud bill by 30%" — Falkland Islands Gov
"Better observability with Netdata than combining other tools." — TMB Barcelona
DPA, SLAs, on-prem, volume pricing
One command, 30 seconds, real data—no sandbox needed
Auto-config + per-node pricing = predictable profit
8-episode Netdata tutorial by LearnLinux.tv
3rd most starred monitoring project
Customers report 40-67% cost cuts, 99% downtime reduction
Free tier lets them try before they buy
AI Support Assistant, Available 24/7
Nedi has access to all official documentation, source code, and resources. Ask any question about Netdata—responds in your language.
Engineering Insights & Product Updates
Jun 2026
Network Monitoring, the Netdata Way: …
Interface counters tell you a port is busy. …
Jun 2026
5 Best SolarWinds Alternatives for 2026
As organizations modernize their …
Jun 2026
SolarWinds Price Increases 2026: What …
If you’re a SolarWinds customer facing …
May 2026
High-cardinality metrics at scale: why …
The “high cardinality is …
Never Fight Fires Alone
Docs, community, and expert help—pick your path to resolution.
60 Seconds to First Dashboard
One command to install. Zero config. 850+ integrations documented.
Level Up Your Monitoring
76,000+ Engineers Strong
Per-Second. 90% Cheaper. Data Stays Home.
See why teams switch from Datadog, Prometheus, Grafana, and more.
> Browse all comparisonsTrace issues directly in the source code
Get architecture recommendations
One of the most popular open-source monitoring projects
Enterprise-grade security and compliance
Your metrics stay on your infrastructure
"Most energy-efficient monitoring solution" — ICSOC 2023, peer-reviewed
"Doesn't miss alerts—mission-critical trust for safety software"
Global community improving monitoring for everyone
Trusted by teams worldwide
Free forever, fully open source agent
Work from anywhere, async-friendly culture
Your work helps millions of systems
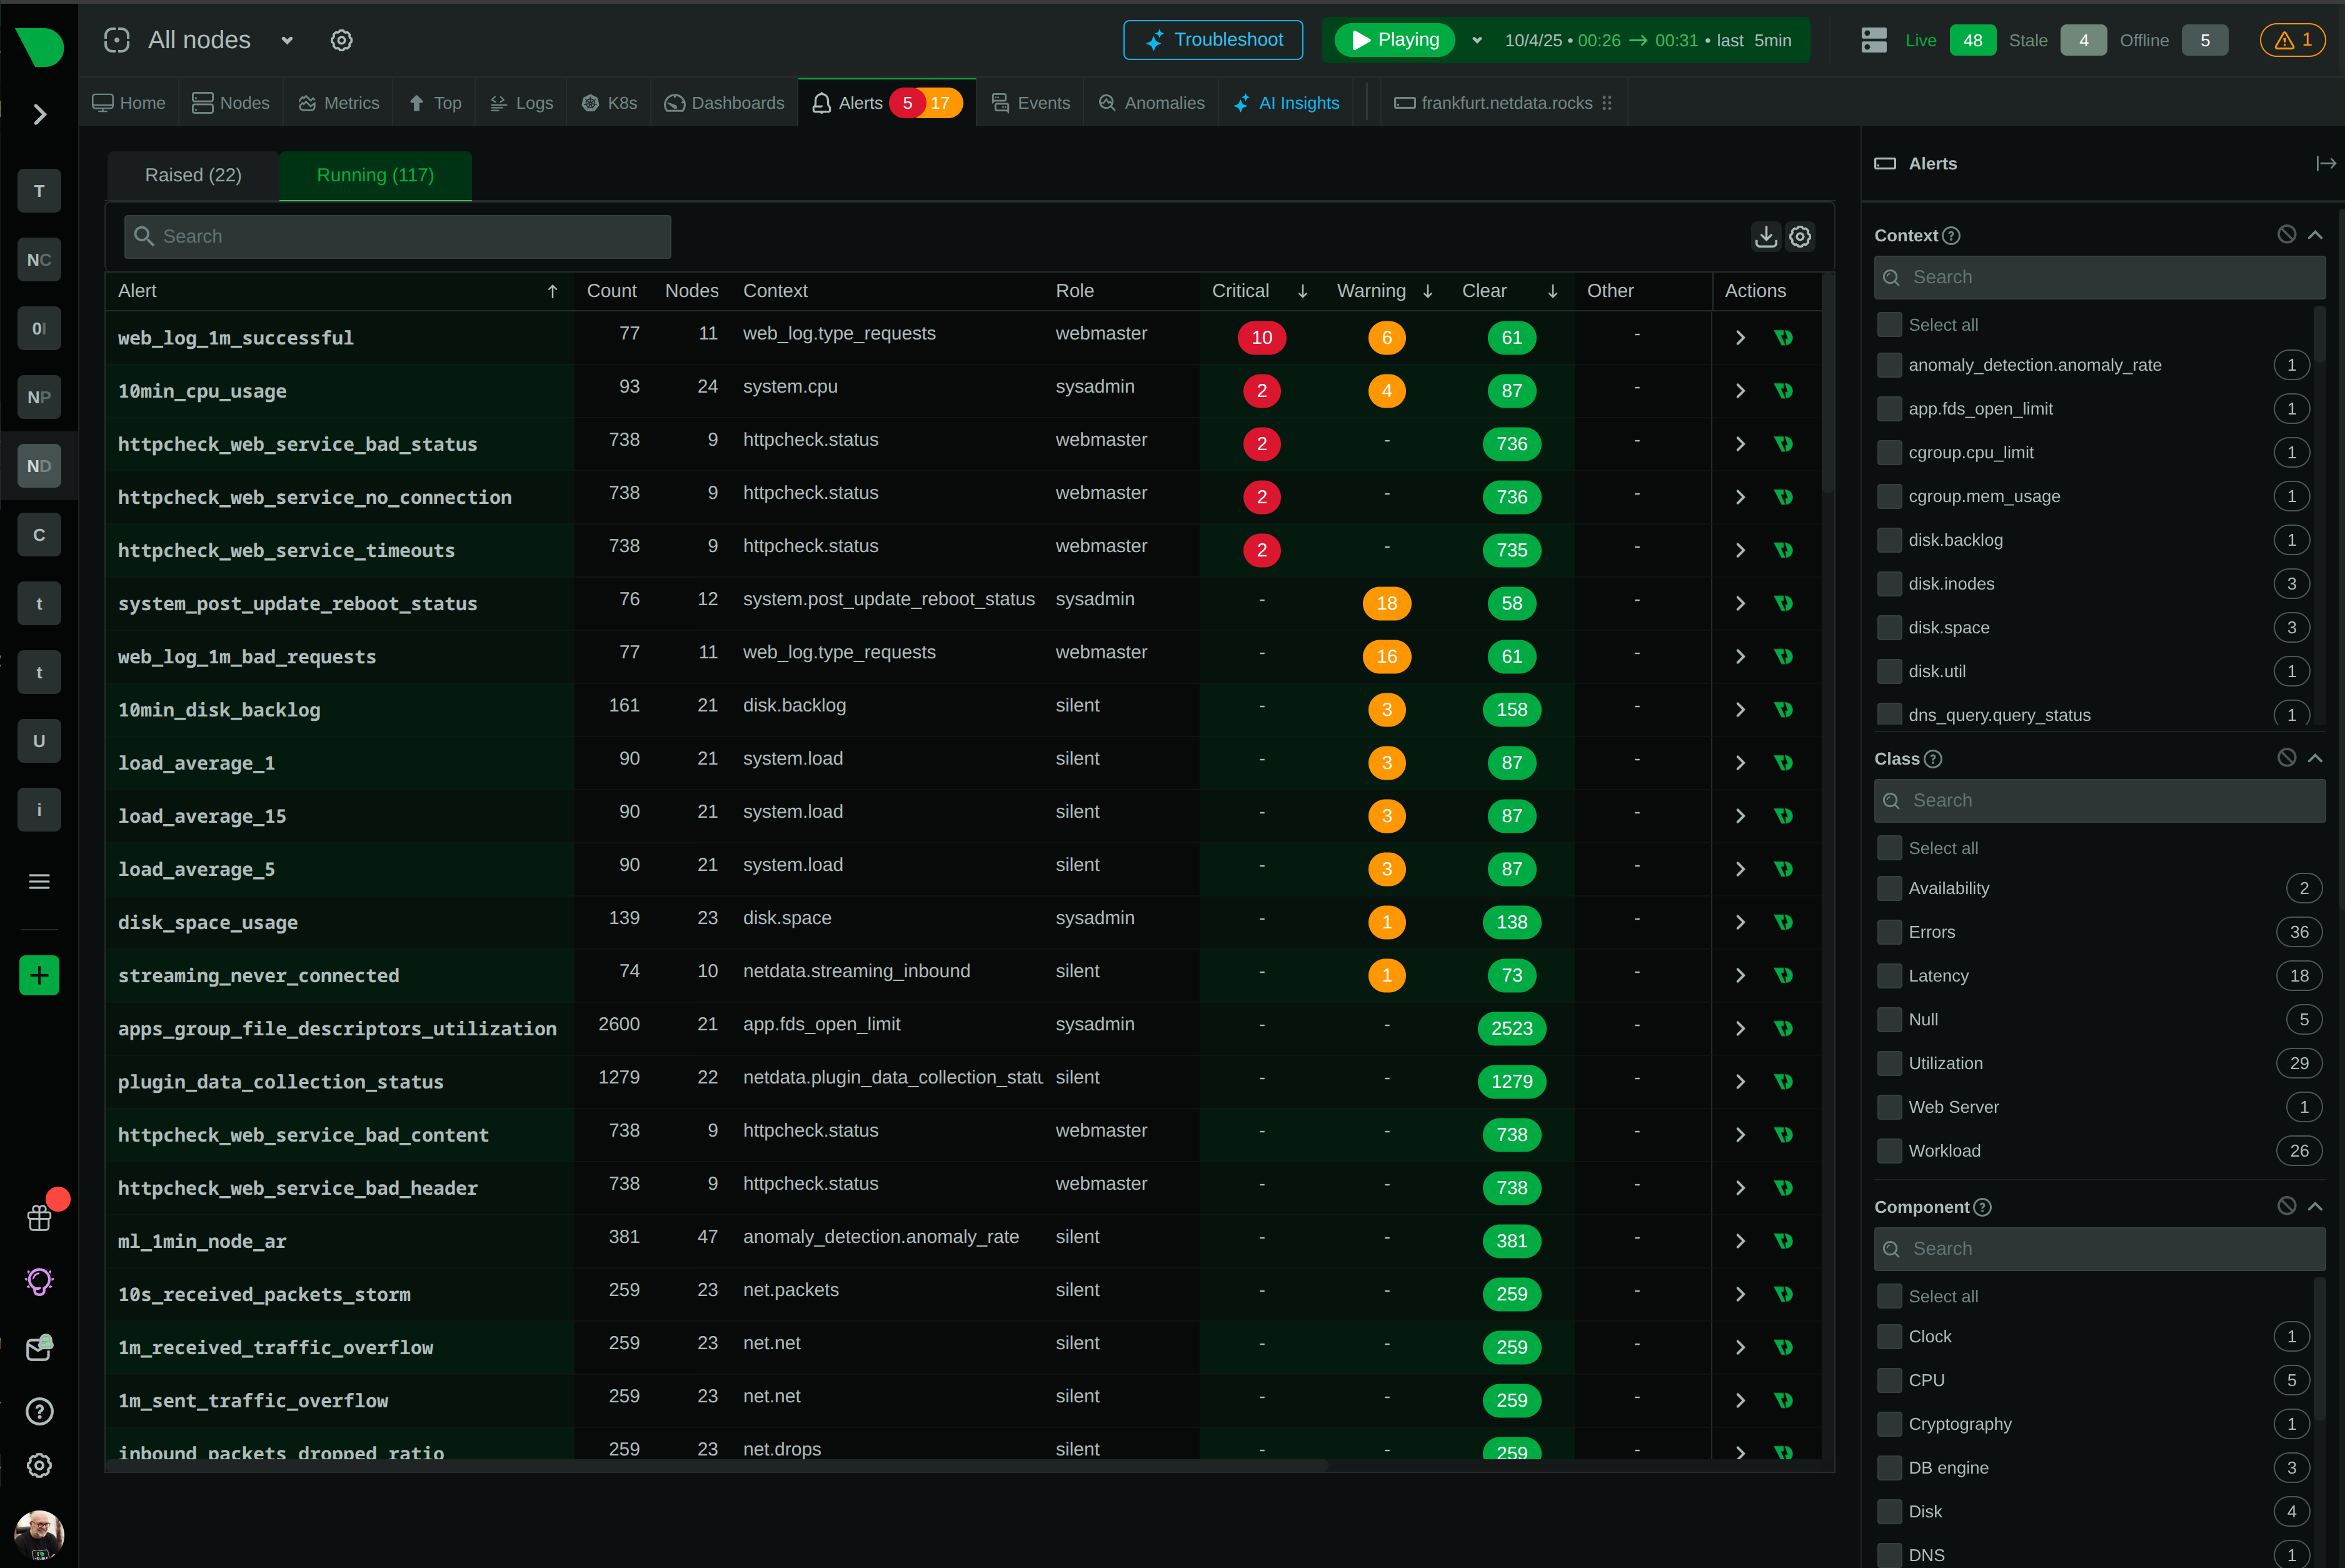
Get 400+ intelligent alerts working in 60 seconds - with component-level precision that pinpoints exactly what failed and where, plus edge-native evaluation that works even during network partitions.
From installation to insight in under a minute
400+ pre-configured alerts auto-apply to discovered services - from CPU and memory to databases and containers - with zero manual configuration required.
Know exactly what failed and where - per-disk alerts, per-interface monitoring, per-container tracking - eliminating investigation guesswork during incidents.
Alerts evaluate at the source with sub-2-second latency, working even during network partitions - no central bottleneck, no single point of failure.
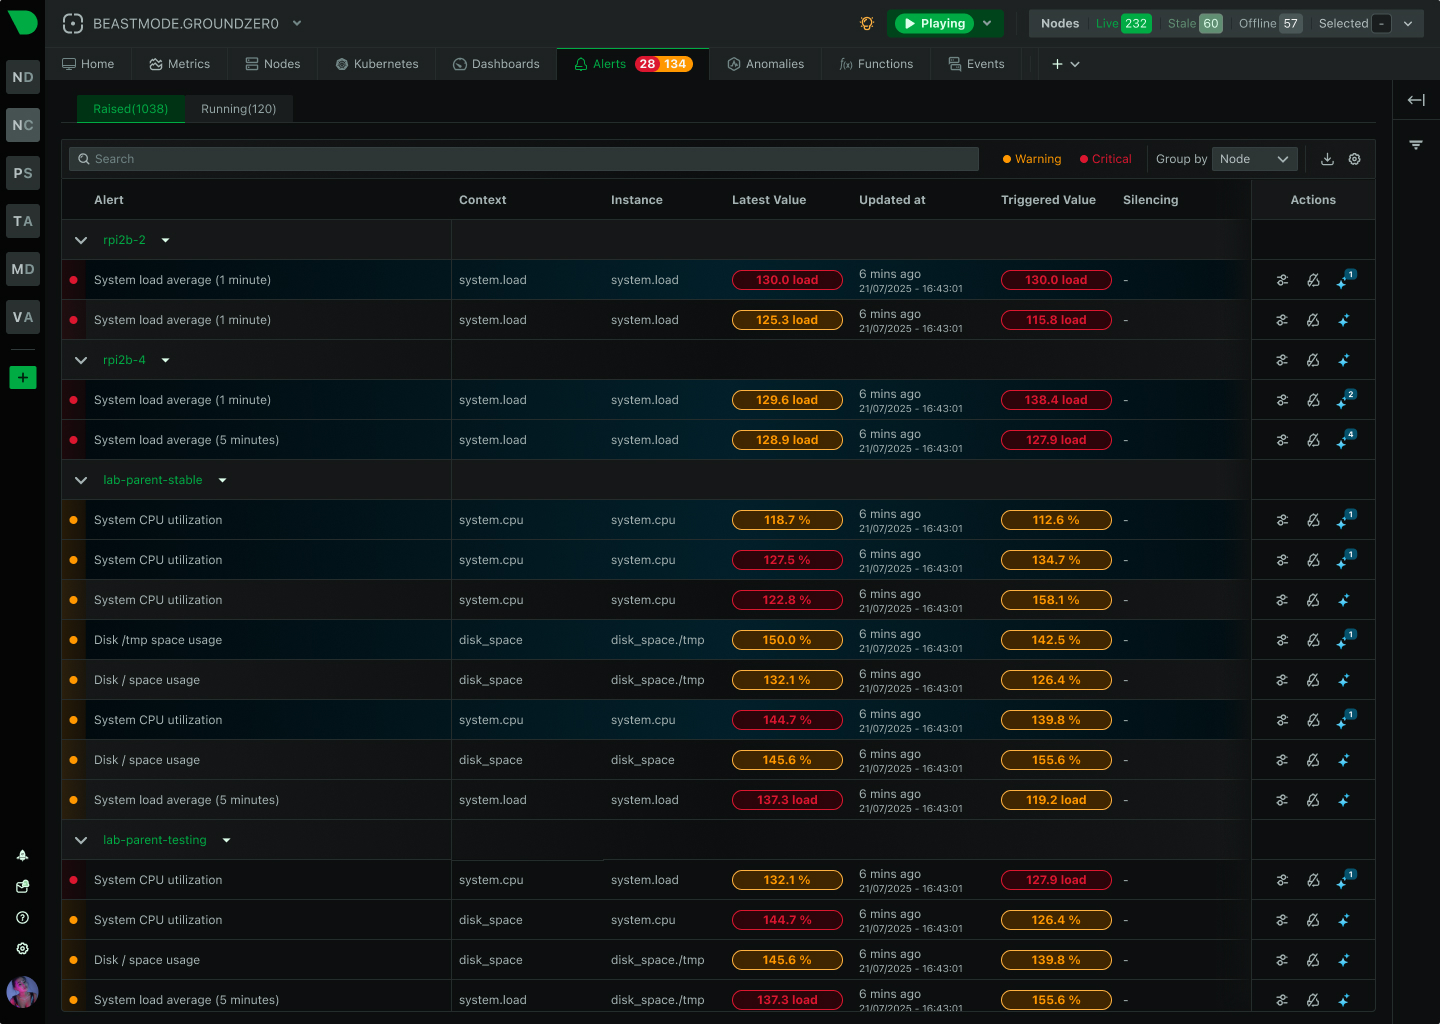
Route alerts to the right team through their preferred channel - from SMS and Slack to PagerDuty and custom webhooks - with automatic deduplication.
18-model consensus anomaly detection provides an additional signal for investigation - separate from alerts but invaluable for spotting unusual behavior.
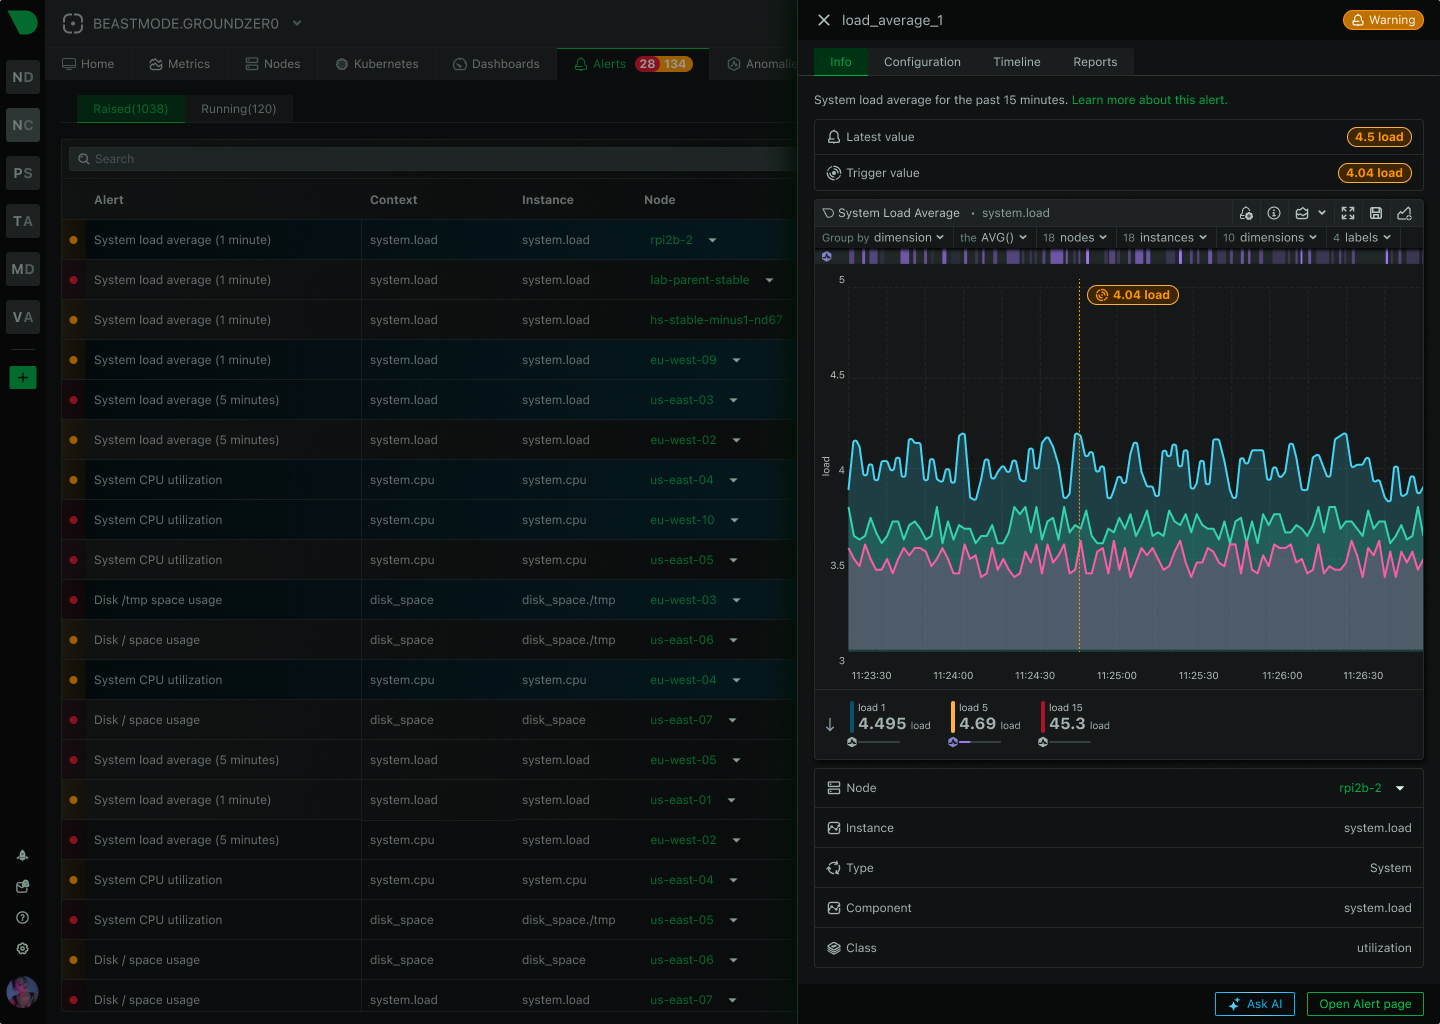
From alert to root cause in seconds - Anomaly Advisor correlates metrics across infrastructure, revealing cascading failures and blast radius automatically.
Trusted by DevOps teams worldwide
60 seconds to full protection
View Alert Templates
Component-level precision
See Alert Precision
29 native integrations
Configure Notifications
Zero central dependency
Explore Edge Architecture
18 models per metric
Learn About ML Architecture
80% MTTR reduction
See AI Investigation
How Netdata Compares
See how Netdata’s edge-native architecture delivers superior alerting compared to traditional centralized approaches.
Capability
Netdata
Traditional Monitoring
Time to First Alert
✅ 60 seconds
Zero-config, auto-discovery, instant coverage
⚠️ Days to weeks
Manual rule creation, threshold tuning required
Pre-Configured Alerts
✅ 400+ templates
Infrastructure, databases, services, containers
❌ Limited or none
Build most alerts from scratch
ML Anomaly Detection
✅ Included everywhere
18 models per metric, separate signal
❌ Not available
Or expensive enterprise add-on
Alert Evaluation
✅ Edge-native distributed
Sub-2-second latency, works offline
⚠️ Centralized server
Network dependency, single bottleneck
Component Precision
✅ Automatic per-component
Per-disk, per-interface, per-container
⚠️ Manual configuration
Infrastructure-level generic alerts
Query Language
✅ None required
Simple expressions, template system
⚠️ PromQL or custom DSL
Specialized skills mandatory
Notification Routing
✅ 29 integrations
Multi-channel, role-based, deduplication
⚠️ Limited channels
Basic email/webhook support
Scalability Model
✅ Linear edge-native
10 to 100,000 nodes, same performance
⚠️ Centralized bottleneck
Performance degrades with scale
Cost Structure
✅ Per-node pricing
No per-alert or per-metric charges
⚠️ Complex volume-based
Per-metric, per-monitor, unpredictable
Install Netdata and get comprehensive alert coverage immediately - infrastructure, databases, web services, containers, Kubernetes. Auto-discovery applies alerts to new instances automatically as infrastructure grows.
60 seconds to full coverage
View Alert TemplatesComponent-level alerts provide precise diagnostics - which disk is full, which interface is saturated, which container is consuming resources. Auto-apply to new instances as infrastructure grows.
Per-disk, per-interface, per-container
See Alert TemplatesRoute alerts based on severity, team, and service through 29 native integrations. Critical issues to PagerDuty and SMS, warnings to Slack, informational to email - with automatic deduplication across agents.
29 notification integrations
Configure NotificationsEdge-native architecture evaluates alerts on each monitored node, not a central server. Alerts work during network partitions, cloud outages, or connectivity problems - with local automation scripts executing without dependency.
Zero central dependency
Explore Edge ArchitectureAnomaly Advisor correlates metrics across infrastructure when alerts fire, ranking thousands of metrics to surface root cause in top 30-50 results. Reveals cascading failures and blast radius automatically.
80% MTTR reduction
See AI FeaturesKey advantages that transform alert management
400+ pre-configured alerts work in 60 seconds - infrastructure, databases, services, containers - with zero manual configuration required for 95% of use cases.
Know exactly which disk, interface, or container failed - eliminating investigation guesswork and enabling parallel triage across teams during incidents.
Alerts evaluate at the source with sub-2-second latency, working even during network partitions - no central bottleneck, no single point of failure.
Route alerts to the right team through their preferred channel with automatic deduplication - from SMS and Slack to PagerDuty and custom webhooks.
From alert to root cause in seconds - Anomaly Advisor correlates metrics across infrastructure, revealing cascading failures and blast radius automatically.
Auto-discovery applies alerts to new instances automatically as infrastructure grows - no manual per-host configuration, no query language to learn.
Per-second data collection with sub-2-second alert evaluation - catch transient issues and microbursts that minute-based monitoring misses entirely.
Alerts, metrics, logs, and AI investigation in single platform - eliminate tool sprawl and context switching during incidents for faster resolution.
18-model anomaly detection provides additional investigation signal - spot unusual patterns that complement traditional alert thresholds.
June 24, 2026
Netdata has added NPM-class network monitoring: live topology maps, NetFlow and sFlow traffic analysis, SNMP device and trap monitoring, and a dedicated network dashboard, all unified with your full-stack observability and processed at the edge.
June 23, 2026
Discover the top SolarWinds alternatives for 2026. Compare modern monitoring platforms built for cloud-native infrastructure - now with NPM-class network monitoring - with transparent pricing and real-time insights.
June 23, 2026
Understanding SolarWinds' subscription-only pricing changes following the Turn/River Capital acquisition, and exploring your options for infrastructure monitoring.
ML anomaly detection and alerts are separate but complementary signals in Netdata. Alerts evaluate conditions you define (thresholds, expressions), while ML anomaly detection identifies unusual behavior based on learned patterns. The 18-model consensus achieves 99% false positive reduction in anomaly detection specifically. During investigation, both signals help - alerts tell you what threshold was crossed, anomalies show unusual patterns that may not have triggered alerts yet. They work together but are evaluated independently.
Traditional monitoring provides infrastructure-level alerts like “Disk space low on server-prod-01” without specifying which disk. Netdata provides component-level precision like “Disk /data at 95% on server-prod-01, will fill in 4 hours” - exact mount point, exact server, clear timeline. This applies to all resources - per-disk, per-interface, per-container, per-database instance - eliminating investigation guesswork during incidents.
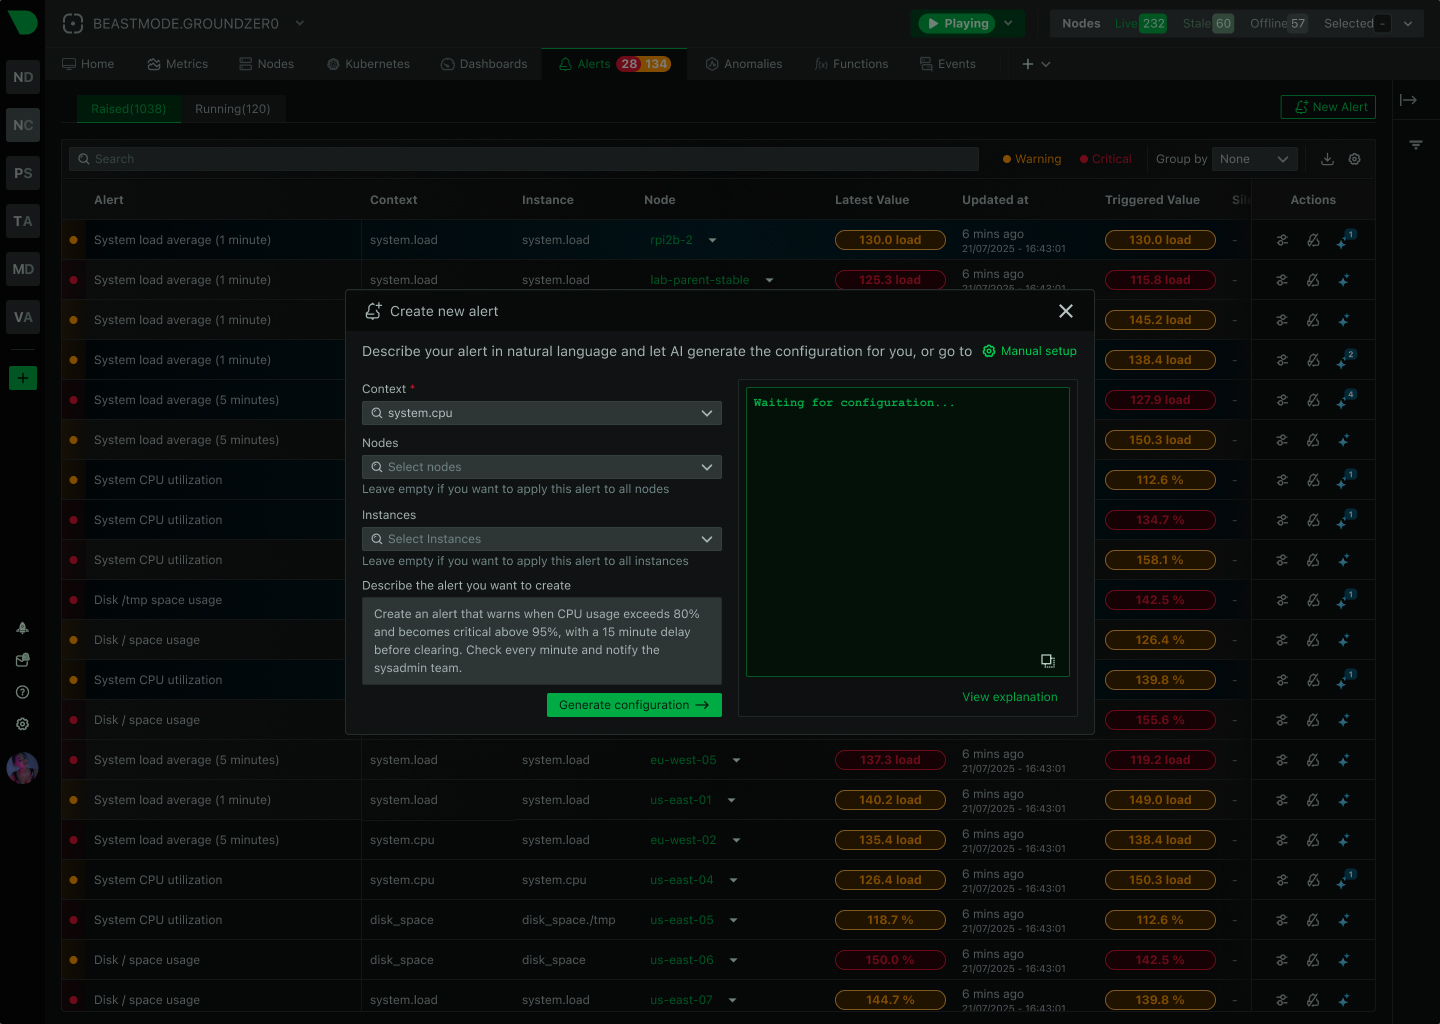
No. Netdata’s 400+ alert templates auto-apply to discovered services instantly. Install Netdata, and within 60 seconds you have production-ready alerts for CPU, memory, disks, network, databases, web services, containers, and Kubernetes components. Configuration is only needed for services requiring authentication (database credentials) or custom application-specific thresholds - typically 5% of use cases.
Netdata’s edge-native architecture evaluates alerts on each monitored node, not a central server. Alerts work during network partitions, cloud outages, or connectivity problems. Local notifications (email, scripts) execute without network dependency. When connectivity returns, alert transitions stream to Cloud for deduplication and centralized routing - but local alerting never stops working.
Yes. Netdata supports 29 native integrations including PagerDuty, Opsgenie, Slack, Teams, Discord, SMS (Twilio, MessageBird), email, webhooks, and custom scripts. Configure severity-based routing (critical→PagerDuty, warning→Slack), role-based distribution (DBA team, web team), and multi-channel fanout. Cloud provides additional deduplication across 100+ agents reporting the same issue.
Component-level alerts eliminate the “which one?” question during incidents. Instead of “high disk usage on server-prod-01” requiring you to SSH in and check each mount point, you get “disk /var/log at 92% on server-prod-01.” This precision enables parallel triage - different team members can investigate different components simultaneously, and you know exactly where to look first.
Prometheus requires manual PromQL alert rules (limited out-of-box), centralized evaluation on Prometheus server, and external Alertmanager for routing. Netdata provides 400+ pre-configured alerts, edge-native evaluation (distributed, no central bottleneck), and integrated notification routing - all working in 60 seconds without query language expertise. Many teams use both - Netdata for infrastructure basics, Prometheus for custom application metrics.
Netdata collects metrics every 1 second and evaluates alerts in real-time at the source. Total latency from issue occurrence to notification is sub-2-seconds (worst case). This is 10-60× faster than traditional minute-based monitoring, enabling detection of transient issues, microbursts, and cascading failures that averaged data hides completely.
Yes. Netdata’s template system allows customization without starting from scratch. Adjust thresholds, evaluation windows, hysteresis values, and notification delays via simple YAML/INI configuration. Configure role-based routing (different teams, different channels), severity-based escalation (warning→Slack, critical→PagerDuty), and maintenance window silencing. Changes sync via Cloud or configuration management tools (Ansible, Terraform).
Cloud-level deduplication consolidates alerts across multiple agents. If 100 agents report the same issue (e.g., parent failure affecting children), Cloud identifies same alert name + instance + node, selects highest severity, and sends 1 notification instead of 100. Flood protection detects alert storms (>100 transitions/hour) and sends single summary notification. This prevents notification overload during infrastructure-wide incidents.
Netdata’s auto-discovery automatically applies alert templates to new instances. Add a disk - disk space alert applies automatically. Launch 10 containers - 10 container memory alerts appear instantly. Deploy Kubernetes - K8s component alerts activate immediately. No manual per-host configuration required. Alert coverage scales automatically as infrastructure grows, eliminating blind spots during expansion.
When an alert fires, Anomaly Advisor correlates metrics across your infrastructure, ranking thousands of metrics by how much they deviated during the alert timeframe. Root cause typically appears in the top 30-50 results. It reveals cascading failure sequences (which component failed first), blast radius (what else was affected), and time-synchronized correlation - transforming investigation from hours of manual correlation to seconds of guided analysis.
Yes. Netdata supports custom script execution when alerts fire, enabling automated remediation at the edge. Examples - restart service when API endpoint fails, scale containers when memory threshold reached, rotate logs when disk fills. Scripts execute locally without network dependency, providing immediate response during incidents. Combine with webhooks for integration with external automation platforms (Ansible Tower, Jenkins, custom orchestration).