 |
VOOZH | about |
|
VOOZH | about |
The only agent that thinks for itself
Autonomous Monitoring with self-learning AI built-in, operating independently across your entire stack.
Centralized metrics streaming and storage
Aggregate metrics from multiple agents into centralized Parent nodes for unified monitoring across your infrastructure.
Fully managed cloud platform
Access your monitoring data from anywhere with our SaaS platform. No infrastructure to manage, automatic updates, and global availability.
Deploy Netdata Cloud in your infrastructure
Run the full Netdata Cloud platform on-premises for complete data sovereignty and compliance with your security policies.
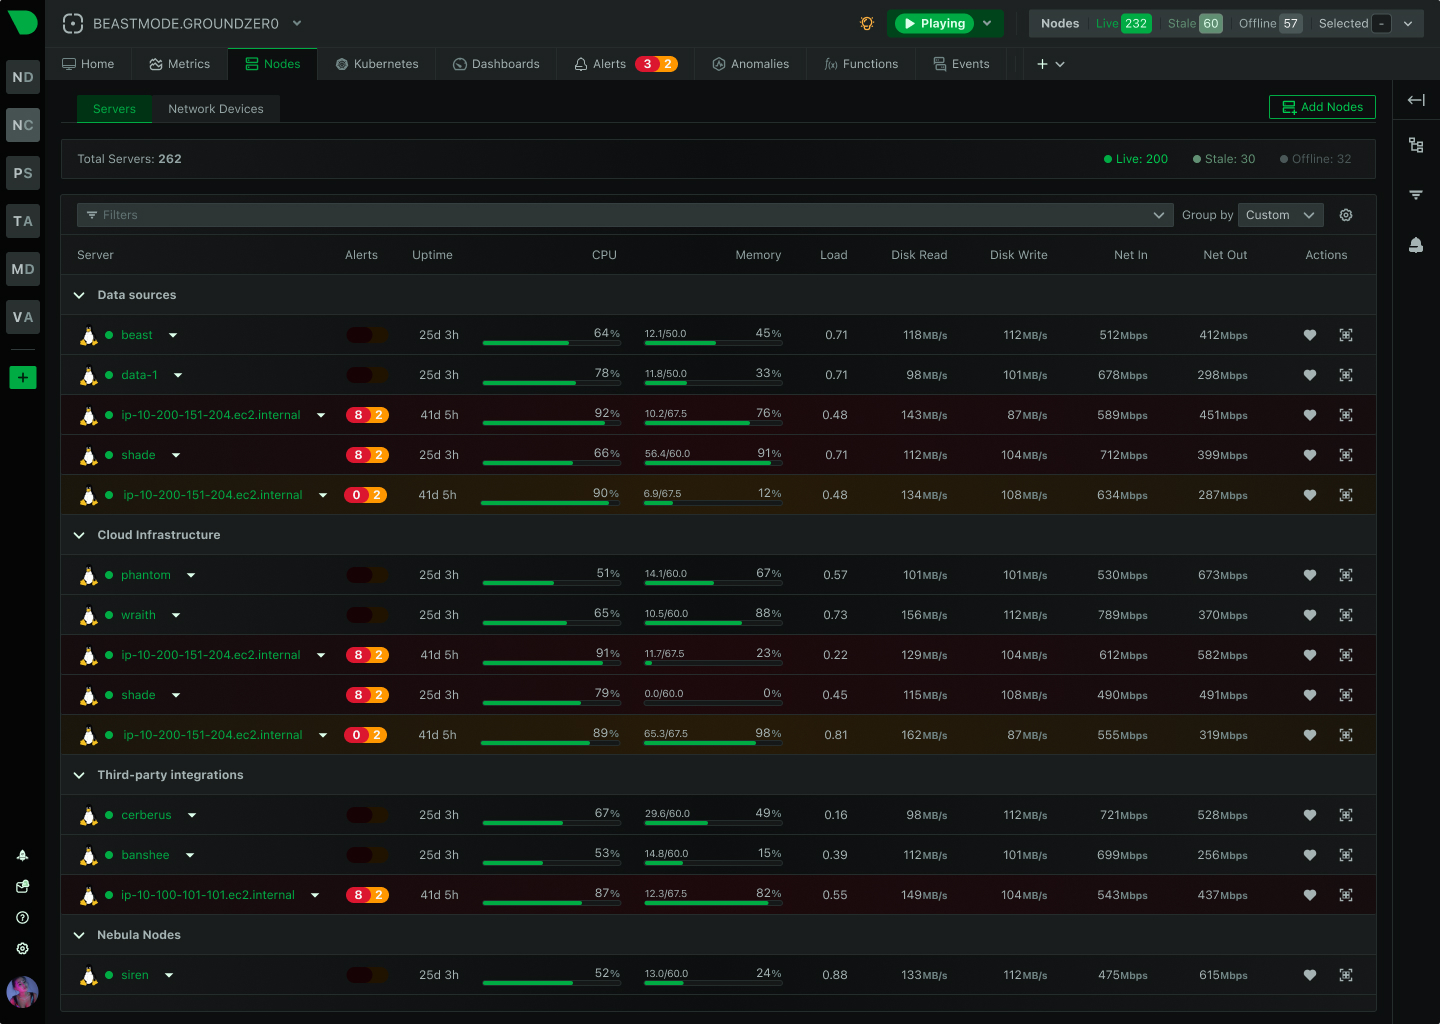
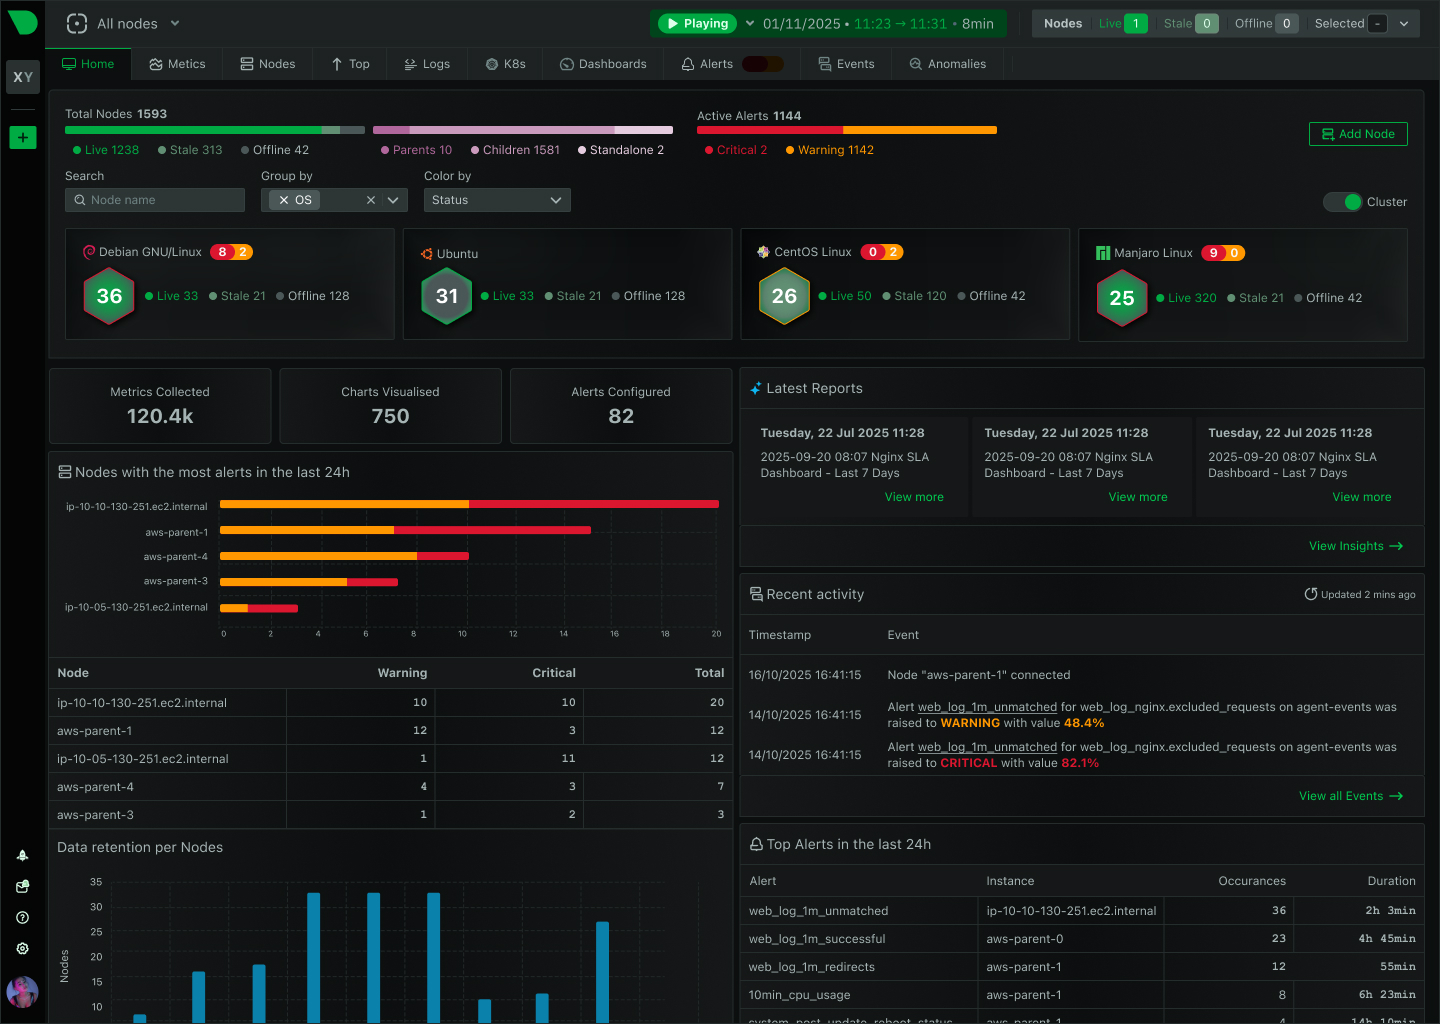
Powerful, intuitive monitoring interface
Modern, responsive UI built for real-time troubleshooting with customizable dashboards and advanced visualization capabilities.
Monitor on the go
Native iOS and Android apps bring full monitoring capabilities to your mobile device with real-time alerts and notifications.
The future of infrastructure observability
See our strategic direction across AI-native observability, full-stack signals, operational intelligence, and enterprise platform maturity.
Best energy efficiency
True real-time per-second
100% automated zero config
Centralized observability
Multi-year retention
High availability built-in
Zero maintenance
Always up-to-date
Enterprise security
Complete data control
Air-gap ready
Compliance certified
Millisecond responsiveness
Infinite zoom & pan
Works on any device
Native performance
Instant alerts
Monitor anywhere
AI-native observability
Continuous delivery
Open source foundation
80% Faster Incident Resolution
True Real-Time and Simple, even at Scale
90% Cost Reduction, Full Fidelity
See and Map Your Entire Network
Single Pane of Glass
Control Without Surrender
Integrations
800+ collectors and notification channels, auto-discovered and ready out of the box.
Reduced monitoring costs by 46% while cutting staff overhead by 67%.
— Leonardo Antunez, Codyas
No data shipping. No central storage costs. Query at the edge.
So many out-of-the-box features! I mostly don't have to develop anything.
— Simon Beginn, LANCOM Systems
Point-and-click troubleshooting. No PromQL, no LogQL, no learning curve.
Enterprise efficiency without enterprise complexity—real ROI from day one.
— Leonardo Antunez, Codyas
Zero data egress. Only metadata reaches the cloud. Your metrics stay on your infrastructure.
Auto-discovered and configured. No manual setup required.
Slack, PagerDuty, Teams, email, webhooks—all built-in.
Built for the People Who Get Paged
Every Industry Has Rules. We Master Them.
Monitor Any Technology. Configure Nothing.
Complete Visibility. Total Control.
Don't Take Our Word for It
Netdata gives more than you invest in it. A rare unicorn that obeys the Pareto rule.
— Eduard Porquet Mateu, TMB Barcelona
Reduced website downtime by 99% and cloud bill by 30% using Netdata alerts.
— Falkland Islands Government
Optimized resource allocation based on Netdata alerts cut cloud spending by 30%.
— Falkland Islands Government
Reduced monitoring staff by 67% while cutting operational costs by 46%.
— Codyas
Netdata has agent capacity or a plugin for everything, including Windows and Kubernetes.
— Eduard Porquet Mateu, TMB Barcelona
So many out-of-the-box features! I mostly don't have to develop anything.
— Simon Beginn, LANCOM Systems
From 2-3 minutes to 30 seconds—instant visibility into any node issue.
— Matthew Artist, Nodecraft
20% less downtime and 40% budget optimization from out-of-the-box monitoring.
— Simon Beginn, LANCOM Systems
Pay per Node. Unlimited Everything Else.
One price per node. Unlimited metrics, logs, users, and retention. No per-GB surprises.
What's Your Monitoring Really Costing You?
Most teams overpay by 40-60%. Let's find out why.
Your Infrastructure Is Unique. Let's Talk.
Because monitoring 10 nodes is different from monitoring 10,000.
Monitoring That Sells Itself
Deploy in minutes. Impress clients in hours. Earn recurring revenue for years.
Per-Second Metrics at Homelab Prices
Same engine, same dashboards, same ML. Just priced for tinkerers.
$1,000 Per Referral. Unlimited Referrals.
Your colleagues get 10% off. You get 10% commission. Everyone wins.
"Netdata's significant positive impact" — LANCOM Systems
Compare vs Datadog, Grafana, Dynatrace
"Cut costs by 46%, staff by 67%" — Codyas
"Reduced cloud bill by 30%" — Falkland Islands Gov
"Better observability with Netdata than combining other tools." — TMB Barcelona
DPA, SLAs, on-prem, volume pricing
One command, 30 seconds, real data—no sandbox needed
Auto-config + per-node pricing = predictable profit
8-episode Netdata tutorial by LearnLinux.tv
3rd most starred monitoring project
Customers report 40-67% cost cuts, 99% downtime reduction
Free tier lets them try before they buy
AI Support Assistant, Available 24/7
Nedi has access to all official documentation, source code, and resources. Ask any question about Netdata—responds in your language.
Engineering Insights & Product Updates
Jun 2026
Network Monitoring, the Netdata Way: …
Interface counters tell you a port is busy. …
Jun 2026
5 Best SolarWinds Alternatives for 2026
As organizations modernize their …
Jun 2026
SolarWinds Price Increases 2026: What …
If you’re a SolarWinds customer facing …
May 2026
High-cardinality metrics at scale: why …
The “high cardinality is …
Never Fight Fires Alone
Docs, community, and expert help—pick your path to resolution.
60 Seconds to First Dashboard
One command to install. Zero config. 850+ integrations documented.
Level Up Your Monitoring
76,000+ Engineers Strong
Per-Second. 90% Cheaper. Data Stays Home.
See why teams switch from Datadog, Prometheus, Grafana, and more.
> Browse all comparisonsTrace issues directly in the source code
Get architecture recommendations
One of the most popular open-source monitoring projects
Enterprise-grade security and compliance
Your metrics stay on your infrastructure
"Most energy-efficient monitoring solution" — ICSOC 2023, peer-reviewed
"Doesn't miss alerts—mission-critical trust for safety software"
Global community improving monitoring for everyone
Trusted by teams worldwide
Free forever, fully open source agent
Work from anywhere, async-friendly culture
Your work helps millions of systems
Complete observability with 100% data sovereignty. Netdata Cloud On-Premises runs entirely within your infrastructure - delivering cloud-scale benefits while keeping all metrics and logs under your control. SOC 2 Type 2 certified, air-gap capable, and ready for the most regulated environments.
Architecture-level compliance meets operational excellence
100% of metrics and logs stay on your infrastructure. Control plane runs in your datacenter. Zero external dependencies. Data is never centralized.
SOC 2 Type 2 certified. DORA, NIS2, HIPAA, GDPR, PCI DSS aligned. 6-year audit log retention. Forward Secure Sealing for tamper detection.
Complete offline operation. Image mirroring for isolated networks. Data diodes supported. FedRAMP and FISMA aligned for defense and critical infrastructure.
Per-second granularity at any scale. Sub-2-second latency from event to insight. Linear scalability from 1 to 100,000+ nodes.
Natural language troubleshooting via Model Context Protocol. Bring your own LLM or use managed AI. Root cause analysis while data stays local.
Transparent per-node pricing starting at 200 nodes. No charges for metrics volume, logs, or users. 90% cost reduction vs traditional platforms.
Trusted by organizations managing critical infrastructure worldwide
Zero external dependencies
View deployment architecture
SOC 2 Type 2 certified
Learn about enterprise features
100% offline capable
Read air-gap deployment guide
Linear scalability proven
Explore scalability architecture
How Netdata Cloud On-Premises Compares
Traditional platforms force you to choose between cloud convenience and data sovereignty. Netdata delivers both through distributed edge-native architecture.
Capability
Netdata On-Premises
Traditional Platforms
Data Residency
✅ Complete
All metrics and logs stay on-premises
❌ Centralized
Data must leave infrastructure for processing
Air-Gap Support
✅ Full Offline
Complete operation without external connectivity
❌ Not Available
Requires internet access for functionality
Real-Time Granularity
✅ Per-Second
Sub-2-second latency from event to insight
⚠️ Per-Minute
30-60 second delays miss transient issues
Machine Learning
✅ Edge-Based
18 models per metric trained locally
⚠️ Cloud-Based
Requires data centralization for ML processing
Deployment Time
✅ Days Not Months
Complete enterprise deployment operational quickly
⚠️ Weeks to Months
Complex configuration and integration required
Pricing Model
✅ Per-Node
Transparent pricing with no volume charges
⚠️ Per-Volume
Unpredictable costs based on data ingestion
Compliance Certification
✅ SOC 2 Type 2
Third-party validated security controls
⚠️ Varies
May require additional compliance work
High Availability
✅ Built-In
Active-active clustering with automatic failover
⚠️ Paid Add-On
Expensive enterprise tier required
Full Netdata Cloud control plane within your Kubernetes cluster. Every component runs on your infrastructure. Zero external dependencies. Ideal for air-gapped environments, defense contractors, and critical infrastructure.
100% self-contained
View deployment guideNetdata Cloud SaaS control plane with all observability data on your infrastructure. Agents and Parents store metrics and logs locally. Cloud provides unified dashboards and RBAC without touching your data.
Best of both worlds
Explore hybrid deploymentDeploy independent Netdata Parent clusters per region or jurisdiction. French records in Paris, Brazilian data in São Paulo, US data in Virginia. Each region operates autonomously while Cloud unifies the view.
Compliance by geography
Design your topologySpaces provide physical isolation with separate billing, users, and infrastructure per customer. Rooms enable logical isolation within each Space. MSPs manage multiple customers with zero cross-visibility.
True multi-tenancy
Learn about MSP solutionsEverything you need for secure, compliant, high-performance observability
Helm charts with RBAC, network policies, and pod security. Runs on any Kubernetes distribution. Supports multi-cluster deployments with unified visibility.
SSO via OIDC, Okta, Azure AD. SCIM for automatic user provisioning. Five role levels with granular permissions. Complete audit logging of all actions.
Per-second granularity from 1 to 100,000+ nodes. Sub-2-second latency guaranteed. Linear scalability without architectural changes. Proven at global scale.
Natural language investigation via Model Context Protocol. Bring your own LLM or use managed AI. Root cause analysis while data stays local.
TLS 1.2+ encryption everywhere. Certificate-based authentication. Outbound-only connections. Zero-trust architecture. SOC 2 Type 2 validated controls.
Active-active Parent clustering. Automatic failover without data loss. Circular replication topology. Zero downtime during maintenance. Resilient by design.
6-year retention for HIPAA compliance. Immutable logs with Forward Secure Sealing. Complete user action tracking. Exportable for SIEM integration.
Deploy Parents per geographic region. Data stays within jurisdiction. Unified view across all regions. Compliance with data localization requirements.
36% less CPU, 88% less RAM vs Prometheus at scale. Minimal disk I/O. Suitable for resource-constrained environments. Validated in Netdata benchmark.
October 16, 2025
Netdata achieves SOC 2 Type 2 attestation, demonstrating that our security controls work consistently in practice over a five-month audit period.
June 18, 2025
Revolutionize how you interact with your monitoring data!
May 27, 2025
Netdata Insights transforms raw infrastructure metrics into synthesized analysis with AI.
Every component runs within your infrastructure. The control plane (Netdata Cloud) operates in your Kubernetes cluster. All Agents and Parents store metrics and logs locally on your servers. Zero data ever leaves your premises. This isn’t a feature - it’s our fundamental architecture. We can prove it: our control plane queries your infrastructure in real-time, streaming results without persistence.
A Kubernetes cluster (version 1.23+) with sufficient resources. For 2,000 nodes: 20+ CPU cores, 45+ GB RAM, 500+ GB storage. For 10,000 nodes: 100+ cores, 200+ GB RAM, 2+ TB storage. You’ll need image mirroring capability for air-gapped deployments. We provide Helm charts with pre-configured RBAC, network policies, and security contexts. Deployment typically takes 2-3 weeks including full Agent rollout across infrastructure.
Yes. Mirror images from Netdata ECR to your internal registry. Deploy Helm charts within your isolated network. Configure Agents and Parents to connect only to on-premises Cloud. No external connectivity required. We support data diodes for unidirectional telemetry flow. Complete feature parity with SaaS including SSO, RBAC, ML, and AI (bring your own LLM via Model Context Protocol).
Enterprise On-Premises starts at 200 nodes with custom pricing based on scale. Contact our sales team for detailed quotes. Pricing includes all features: unlimited metrics, logs, users, dashboards, ML, AI, SSO, RBAC, and support. No per-metric or per-volume charges. Costs scale linearly with infrastructure size. Typical deployments achieve 90% cost reduction vs traditional platforms.
SOC 2 Type 2 certified (Security & Availability) with annual recertification. Architecture aligns with GDPR, HIPAA, PCI DSS, DORA, NIS2, and FedRAMP requirements. We provide 6-year audit log retention for HIPAA. Forward Secure Sealing for tamper detection. Complete audit trails of all user actions. Certificate available for vendor reviews. Our architecture satisfies compliance by design - not configuration.
Netdata provides what Prometheus/Grafana provides plus ML, AI, logs, and automation in one platform. Key differences: (1) Real-time: 1-second vs 10-30 seconds, (2) Zero config: Auto-discovery vs manual, (3) ML included: 18 models per metric vs add-ons, (4) No query language: Point-and-click vs PromQL, (5) Performance: 36% less CPU, 88% less RAM at scale in Netdata benchmark, (6) Logs: Direct journal access vs separate Loki. If you want DIY flexibility, Netdata Agent is open source - but with better out-of-box experience.
Active-active Parent clustering with 2+ nodes in circular topology. Automatic failover when Parents fail. Complete data replication between all Parents. Agents buffer locally during Parent outage with automatic replay. Zero data loss architecture. Cloud fails → Agents continue monitoring, local dashboards accessible. Network partition → Each side operates independently. HA is built-in, not an expensive add-on.
Yes. Your observability data already lives on your infrastructure (Agents and Parents). Migration involves deploying on-premises Cloud and reconfiguring Agents to connect to it instead of SaaS. No data migration required because data never centralized. We provide migration guides and professional services. Most organizations complete migration in 1-2 weeks. Zero downtime during transition.
Multiple options: (1) Cloud MCP at your on-premises Cloud instance - infrastructure-wide access with your own LLM. (2) Agent/Parent MCP - direct local access to individual nodes, free and open-source. (3) Managed AI - Netdata-optimized playbooks with your choice of LLM, queries stream through Cloud without persistence. All approaches keep data on-premises during AI analysis.
24/7 availability with dedicated support team. Phone support for critical issues. Custom SLAs available. Implementation assistance including architecture design and deployment. Migration support from existing platforms. Training programs for administrators and users. Regular health checks and optimization recommendations. Direct access to engineering team for complex issues.
Typical timeline: Week 1: Design topology and size infrastructure. Week 2: Deploy Cloud in Kubernetes, install Agents on first 100 nodes. Week 3: Roll out to remaining infrastructure, configure SSO/RBAC. Most organizations achieve full production deployment in 2-3 weeks. We provide professional services to accelerate. Compare to months for traditional platforms requiring extensive configuration and dashboard building.