 |
VOOZH | about |
|
VOOZH | about |
The only agent that thinks for itself
Autonomous Monitoring with self-learning AI built-in, operating independently across your entire stack.
Centralized metrics streaming and storage
Aggregate metrics from multiple agents into centralized Parent nodes for unified monitoring across your infrastructure.
Fully managed cloud platform
Access your monitoring data from anywhere with our SaaS platform. No infrastructure to manage, automatic updates, and global availability.
Deploy Netdata Cloud in your infrastructure
Run the full Netdata Cloud platform on-premises for complete data sovereignty and compliance with your security policies.
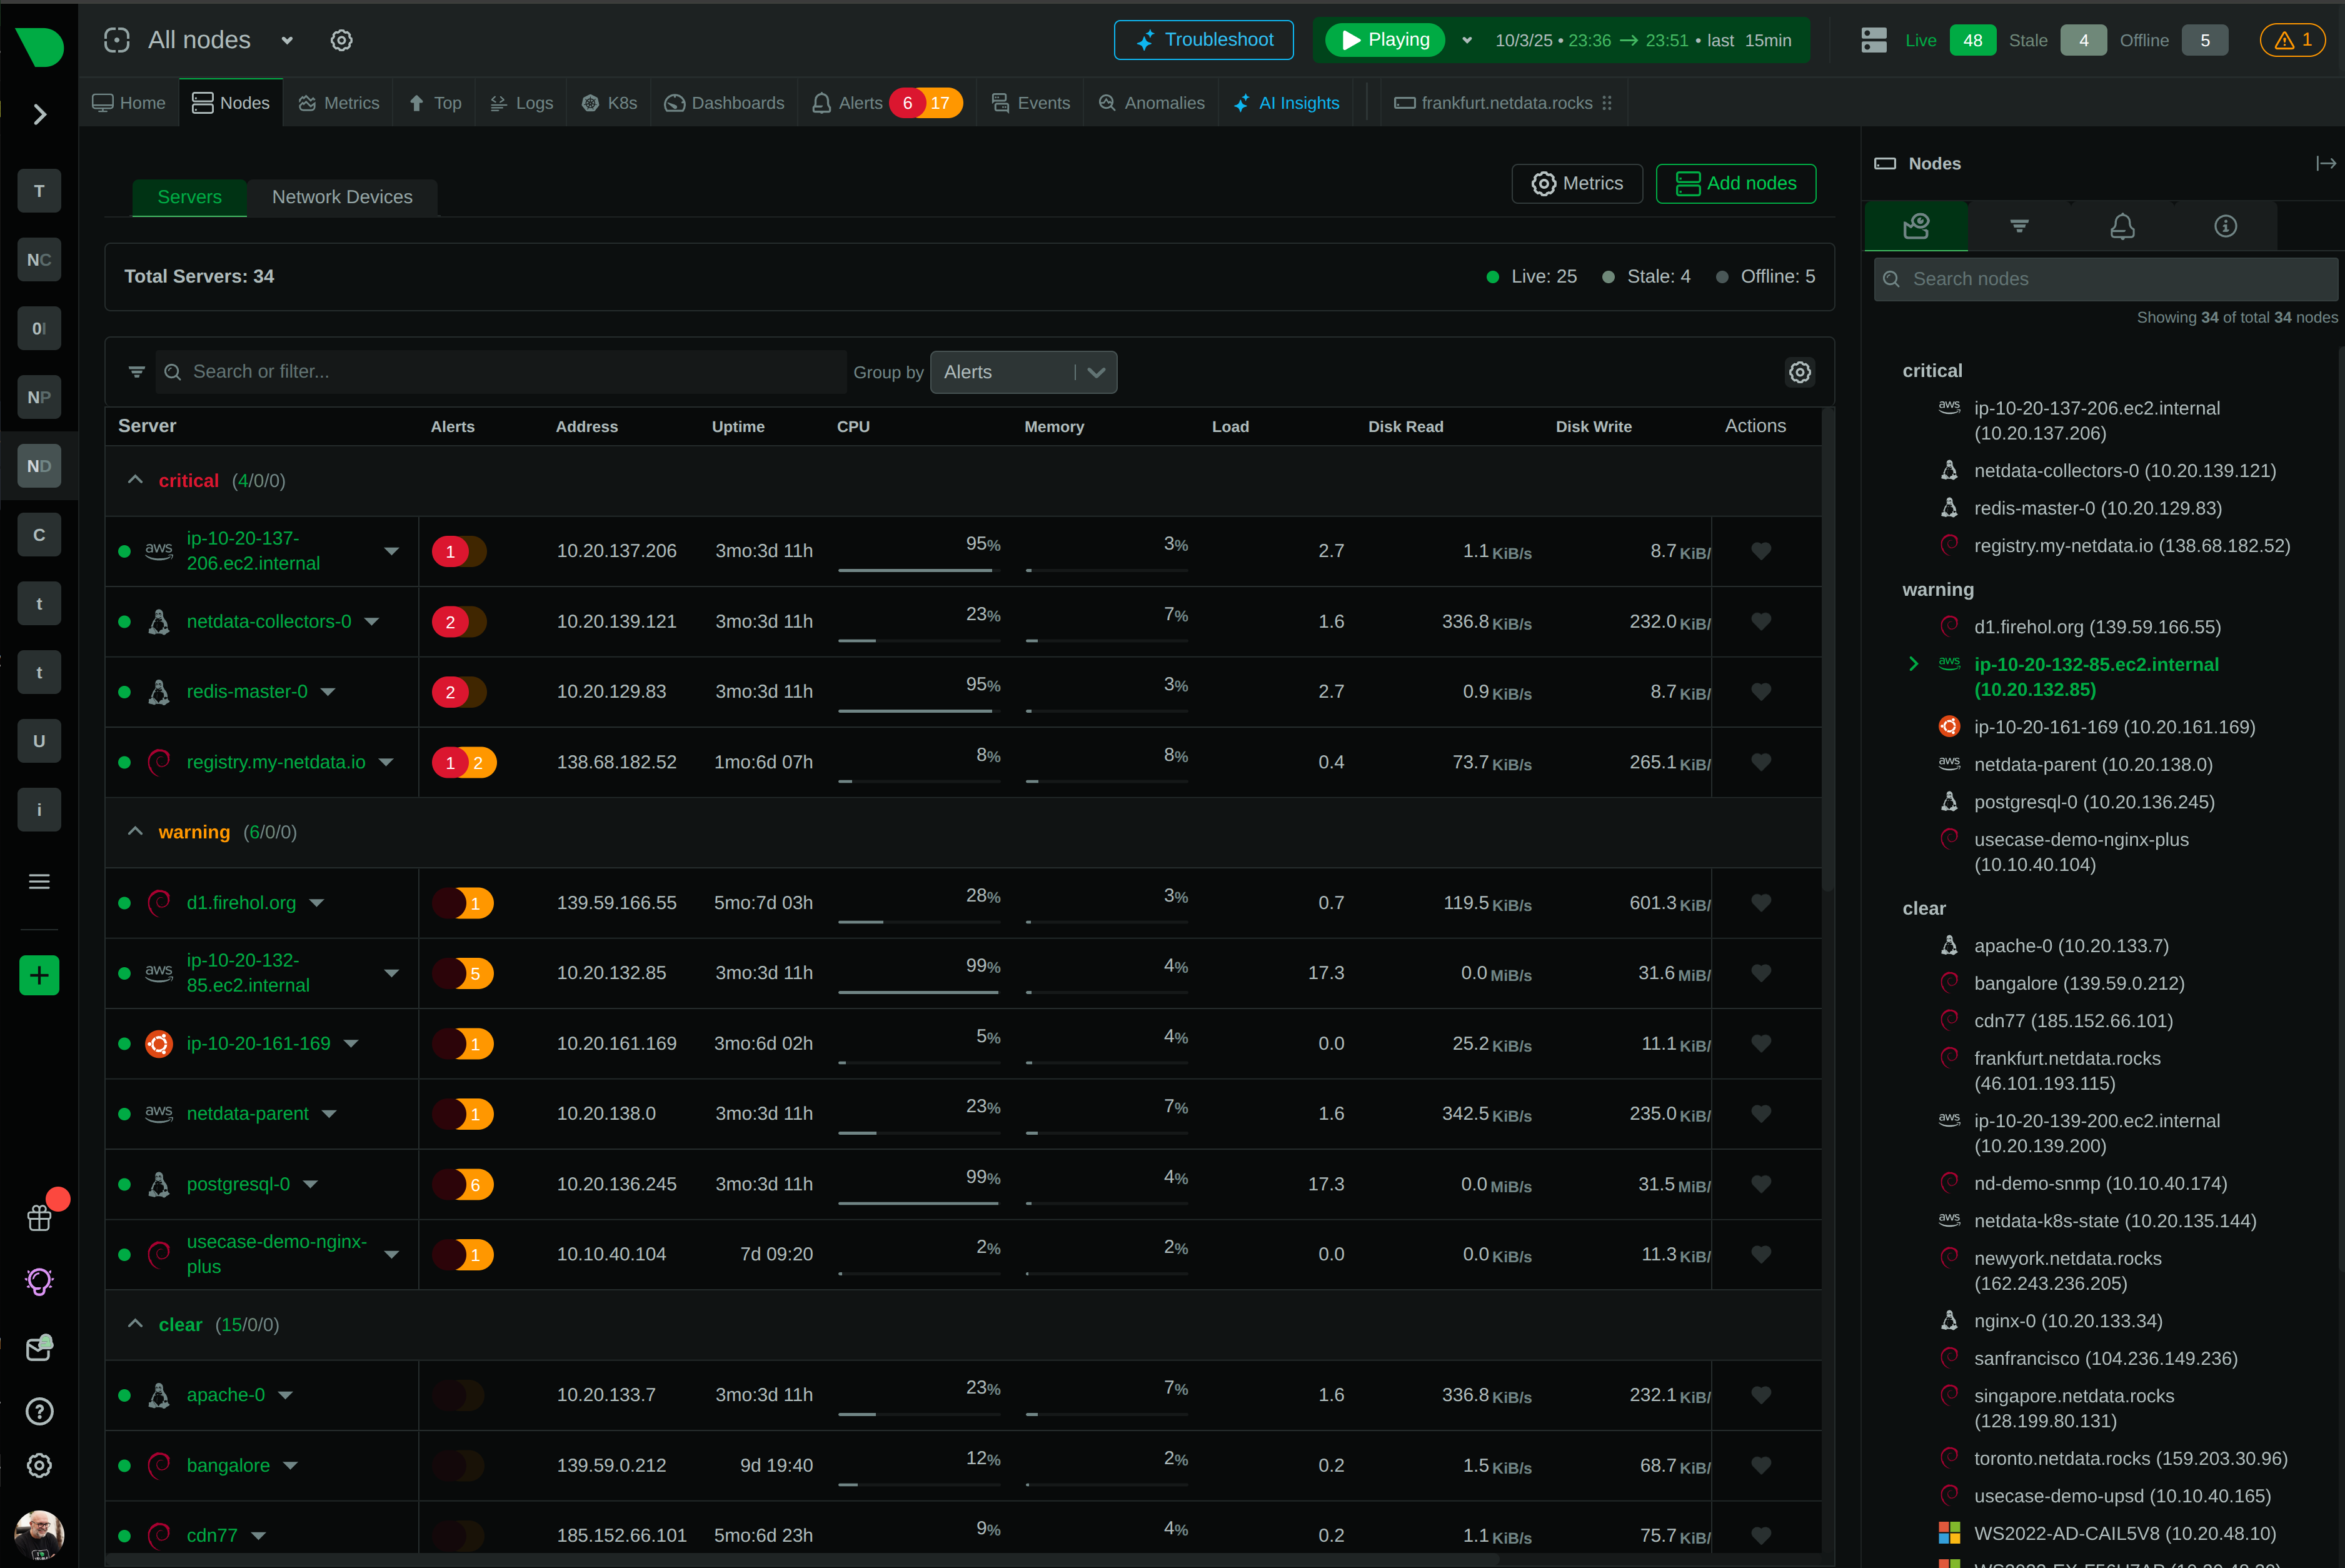
Powerful, intuitive monitoring interface
Modern, responsive UI built for real-time troubleshooting with customizable dashboards and advanced visualization capabilities.
Monitor on the go
Native iOS and Android apps bring full monitoring capabilities to your mobile device with real-time alerts and notifications.
The future of infrastructure observability
See our strategic direction across AI-native observability, full-stack signals, operational intelligence, and enterprise platform maturity.
Best energy efficiency
True real-time per-second
100% automated zero config
Centralized observability
Multi-year retention
High availability built-in
Zero maintenance
Always up-to-date
Enterprise security
Complete data control
Air-gap ready
Compliance certified
Millisecond responsiveness
Infinite zoom & pan
Works on any device
Native performance
Instant alerts
Monitor anywhere
AI-native observability
Continuous delivery
Open source foundation
80% Faster Incident Resolution
True Real-Time and Simple, even at Scale
90% Cost Reduction, Full Fidelity
See and Map Your Entire Network
Single Pane of Glass
Control Without Surrender
Integrations
800+ collectors and notification channels, auto-discovered and ready out of the box.
Reduced monitoring costs by 46% while cutting staff overhead by 67%.
— Leonardo Antunez, Codyas
No data shipping. No central storage costs. Query at the edge.
So many out-of-the-box features! I mostly don't have to develop anything.
— Simon Beginn, LANCOM Systems
Point-and-click troubleshooting. No PromQL, no LogQL, no learning curve.
Enterprise efficiency without enterprise complexity—real ROI from day one.
— Leonardo Antunez, Codyas
Zero data egress. Only metadata reaches the cloud. Your metrics stay on your infrastructure.
Auto-discovered and configured. No manual setup required.
Slack, PagerDuty, Teams, email, webhooks—all built-in.
Built for the People Who Get Paged
Every Industry Has Rules. We Master Them.
Monitor Any Technology. Configure Nothing.
Complete Visibility. Total Control.
Don't Take Our Word for It
Netdata gives more than you invest in it. A rare unicorn that obeys the Pareto rule.
— Eduard Porquet Mateu, TMB Barcelona
Reduced website downtime by 99% and cloud bill by 30% using Netdata alerts.
— Falkland Islands Government
Optimized resource allocation based on Netdata alerts cut cloud spending by 30%.
— Falkland Islands Government
Reduced monitoring staff by 67% while cutting operational costs by 46%.
— Codyas
Netdata has agent capacity or a plugin for everything, including Windows and Kubernetes.
— Eduard Porquet Mateu, TMB Barcelona
So many out-of-the-box features! I mostly don't have to develop anything.
— Simon Beginn, LANCOM Systems
From 2-3 minutes to 30 seconds—instant visibility into any node issue.
— Matthew Artist, Nodecraft
20% less downtime and 40% budget optimization from out-of-the-box monitoring.
— Simon Beginn, LANCOM Systems
Pay per Node. Unlimited Everything Else.
One price per node. Unlimited metrics, logs, users, and retention. No per-GB surprises.
What's Your Monitoring Really Costing You?
Most teams overpay by 40-60%. Let's find out why.
Your Infrastructure Is Unique. Let's Talk.
Because monitoring 10 nodes is different from monitoring 10,000.
Monitoring That Sells Itself
Deploy in minutes. Impress clients in hours. Earn recurring revenue for years.
Per-Second Metrics at Homelab Prices
Same engine, same dashboards, same ML. Just priced for tinkerers.
$1,000 Per Referral. Unlimited Referrals.
Your colleagues get 10% off. You get 10% commission. Everyone wins.
"Netdata's significant positive impact" — LANCOM Systems
Compare vs Datadog, Grafana, Dynatrace
"Cut costs by 46%, staff by 67%" — Codyas
"Reduced cloud bill by 30%" — Falkland Islands Gov
"Better observability with Netdata than combining other tools." — TMB Barcelona
DPA, SLAs, on-prem, volume pricing
One command, 30 seconds, real data—no sandbox needed
Auto-config + per-node pricing = predictable profit
8-episode Netdata tutorial by LearnLinux.tv
3rd most starred monitoring project
Customers report 40-67% cost cuts, 99% downtime reduction
Free tier lets them try before they buy
AI Support Assistant, Available 24/7
Nedi has access to all official documentation, source code, and resources. Ask any question about Netdata—responds in your language.
Engineering Insights & Product Updates
Jun 2026
Network Monitoring, the Netdata Way: …
Interface counters tell you a port is busy. …
Jun 2026
5 Best SolarWinds Alternatives for 2026
As organizations modernize their …
Jun 2026
SolarWinds Price Increases 2026: What …
If you’re a SolarWinds customer facing …
May 2026
High-cardinality metrics at scale: why …
The “high cardinality is …
Never Fight Fires Alone
Docs, community, and expert help—pick your path to resolution.
60 Seconds to First Dashboard
One command to install. Zero config. 850+ integrations documented.
Level Up Your Monitoring
76,000+ Engineers Strong
Per-Second. 90% Cheaper. Data Stays Home.
See why teams switch from Datadog, Prometheus, Grafana, and more.
> Browse all comparisonsTrace issues directly in the source code
Get architecture recommendations
One of the most popular open-source monitoring projects
Enterprise-grade security and compliance
Your metrics stay on your infrastructure
"Most energy-efficient monitoring solution" — ICSOC 2023, peer-reviewed
"Doesn't miss alerts—mission-critical trust for safety software"
Global community improving monitoring for everyone
Trusted by teams worldwide
Free forever, fully open source agent
Work from anywhere, async-friendly culture
Your work helps millions of systems
Deploy complete infrastructure observability in 60 seconds. Zero configuration. Instant visibility. ML-powered insights from day one. Trusted by millions of engineers worldwide.
Get the flexibility you love with the simplicity you need
One-line install. Auto-discovery. Instant dashboards. From installation to insights before your coffee gets cold.
Per-second data collection with 1-second visualization latency. See what’s happening now, not what happened 30 seconds ago.
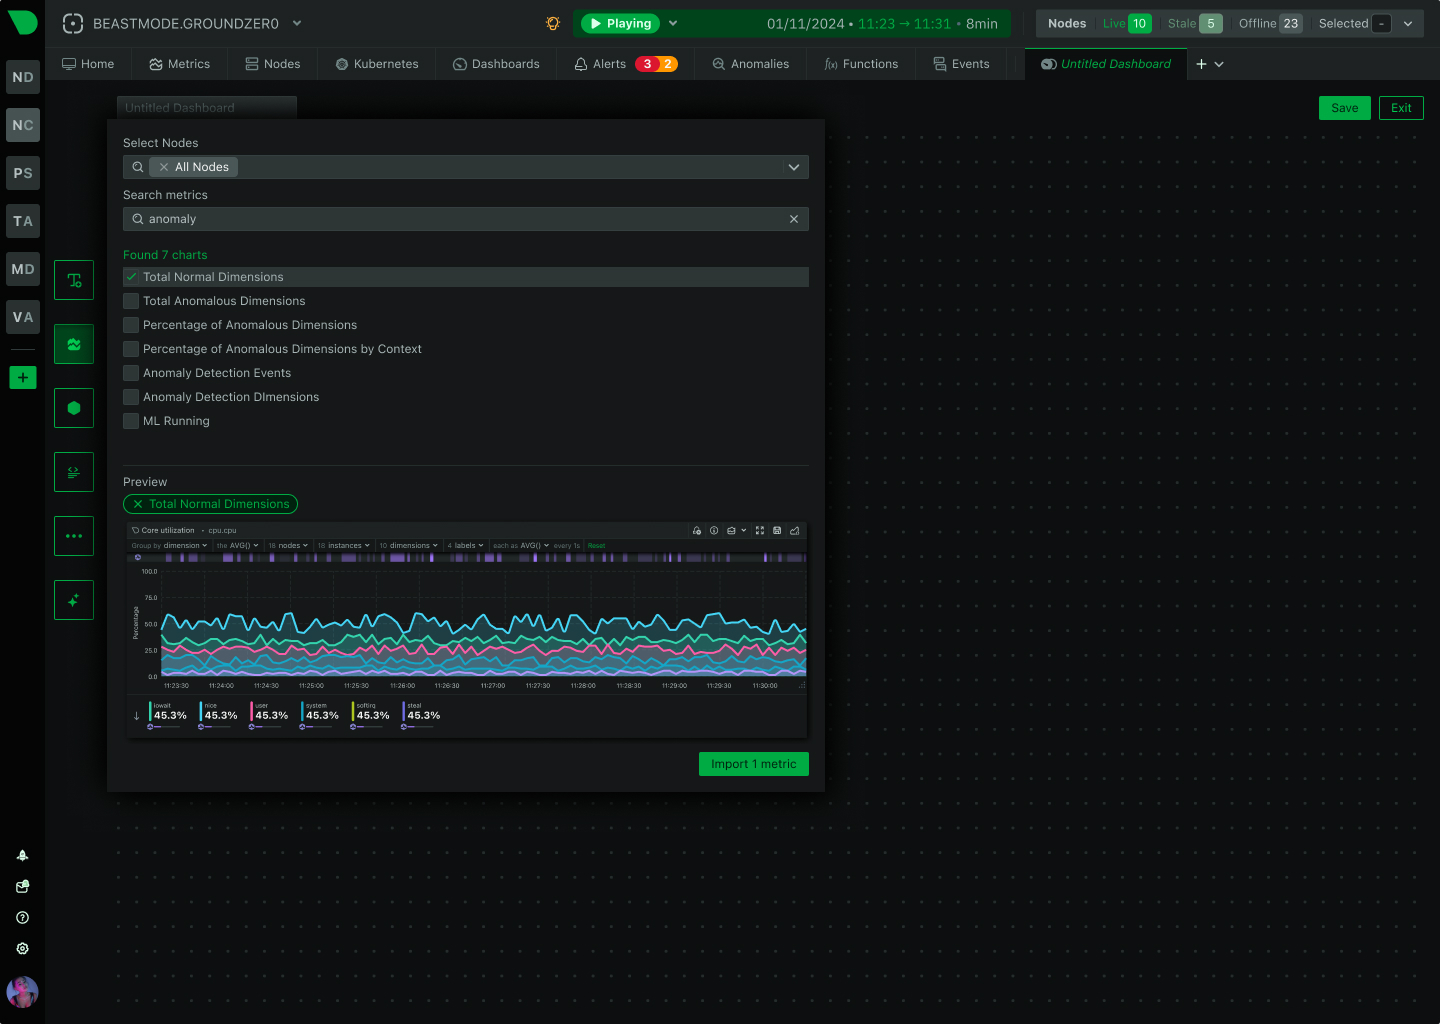
18 unsupervised models train automatically per metric. 99% false positive reduction through consensus-based anomaly detection.
Metrics, logs, processes, connections - all in one interface. No context switching between fragmented tools.
800+ integrations auto-discovered. Algorithmic dashboards. No PromQL, no manual building, no query languages required.
Per-node pricing with no hidden costs. Unlimited metrics, logs, users. 90% cost reduction vs commercial solutions.
Trusted by DevOps teams worldwide
60 seconds to first dashboard vs days/weeks for LGTM stack
See Quick Start Guide
10-30× more granular than standard monitoring
Learn About Real-Time
80% MTTR reduction through unified visibility
Explore AI Features
100,000+ node deployments in production
Understand Scalability
Replaces 20+ console tools with unified interface
See Netdata Functions
90% cost reduction vs Datadog/New Relic
View Pricing
Open Source Observability Comparison
See why millions choose Netdata over fragmented open source solutions
Capability
Netdata
Prometheus + Grafana + ELK
Time to First Dashboard
✅ 60 seconds
One-line install, instant visibility
⚠️ Days to weeks
Manual configuration, dashboard building
Data Granularity
✅ Per-second
True real-time, no sampling
⚠️ 10-30 seconds
Near real-time, misses transients
Configuration Required
✅ Zero
Auto-discovery, algorithmic dashboards
❌ Extensive
Collectors, exporters, dashboards
Query Language
✅ None
Point-and-click analysis
❌ PromQL + LogQL
Steep learning curve
ML Anomaly Detection
✅ Automatic
18 models per metric, edge-based
❌ Manual
Requires configuration and tuning
Unified Platform
✅ Metrics + Logs
Single interface, instant correlation
❌ Fragmented
3+ tools, context switching
Operational Overhead
✅ Zero
Self-managing, no maintenance
❌ Dedicated FTE
Constant tuning and scaling
Storage Efficiency
✅ 0.6 bytes/sample
Industry-leading compression
⚠️ 2-16 bytes/sample
Higher storage costs
AI Troubleshooting
✅ Included
Natural language via MCP
❌ Not Available
Manual investigation only
76,300+ GitHub stars. 615+ contributors. 1.5M downloads per day. Active Discord community. Transparent development. Your voice shapes the roadmap.
Join millions of engineers worldwide
View on GitHubEach agent is a complete observability engine. Process data where it's generated. Scale linearly without bottlenecks. Proven at 100,000+ nodes.
4.5+ billion metrics/second globally
Learn ArchitectureUniversity of Amsterdam study confirms: most energy-efficient monitoring solution with lowest CPU, RAM, and application impact - even at per-second collection.
Independently validated efficiency
Read ResearchSOC 2 Type 2 certified. Data sovereignty - all metrics stay on-premises. TLS everywhere. RBAC. SSO integration. Audit logging. Air-gapped deployment options.
GDPR, HIPAA, PCI DSS aligned
View SecurityAgent licensed under GPLv3+. Dashboard under NCUL1 (free with Netdata). No proprietary lock-in. Fork-friendly. Community-driven development. Transparent roadmap.
Free forever for unlimited nodes
Read LicenseThe benefits that matter most to engineering teams
One-line install. Auto-discovery. Instant dashboards. From installation to insights before your coffee gets cold.
Junior engineers get senior-level visibility automatically. No query language expertise required. Same powerful tools for everyone.
Transparent per-node pricing. Unlimited metrics, logs, users. No surprise bills based on data volume.
All metrics stay on-premises. Only metadata travels to Cloud. GDPR, HIPAA, PCI DSS aligned by design.
Per-second data collection with 1-second visualization latency. See what’s happening now, not 30 seconds ago.
18 unsupervised models train automatically. 99% false positive reduction in anomaly detection. Root cause in top 30-50 results.
Metrics, logs, processes, connections - all in one interface. No context switching between fragmented tools.
Grow from 10 to 10,000 nodes without changing architecture. Proven at 100,000+ node deployments.
Natural language queries via Model Context Protocol. Bring your own LLM. Root cause analysis in seconds.
June 24, 2026
Netdata has added NPM-class network monitoring: live topology maps, NetFlow and sFlow traffic analysis, SNMP device and trap monitoring, and a dedicated network dashboard, all unified with your full-stack observability and processed at the edge.
June 23, 2026
Discover the top SolarWinds alternatives for 2026. Compare modern monitoring platforms built for cloud-native infrastructure - now with NPM-class network monitoring - with transparent pricing and real-time insights.
June 23, 2026
Understanding SolarWinds' subscription-only pricing changes following the Turn/River Capital acquisition, and exploring your options for infrastructure monitoring.
Yes. The Netdata Agent is licensed under GPLv3+ and free forever for unlimited nodes. The dashboard is licensed under NCUL1 (Netdata Cloud UI License), which is free to use with Netdata Agents and Parents. You can deploy, modify, and distribute Netdata without restrictions. Netdata Cloud (SaaS) offers additional features with a free Community tier (5 nodes, personal use only) and paid plans for larger deployments and commercial use.
Netdata provides 10-30× more granular data (per-second vs 10-30 seconds), requires zero configuration (vs days/weeks of setup), includes ML anomaly detection automatically (vs manual threshold tuning), and unifies metrics + logs in one platform (vs separate tools). Netdata benchmark testing shows 36% less CPU, 88% less RAM, and 97% less disk I/O at 4.6 million metrics/second. Prometheus excels at long-term storage and PromQL standardization; Netdata excels at real-time troubleshooting and zero-configuration deployment.
No. Unlike traditional open source stacks (Prometheus + Grafana + ELK) that require dedicated FTEs for configuration, tuning, and scaling, Netdata is largely self-managing. Auto-discovery finds services automatically, algorithmic dashboards generate instantly, ML models train without tuning, and the WORM storage design eliminates maintenance windows. Users need to configure retention based on preference, set up collectors requiring credentials, and monitor resources for scaling Parents as infrastructure grows.
Yes. Netdata is proven at 100,000+ node deployments processing 4.5+ billion metrics per second globally. The distributed edge-native architecture scales linearly - adding nodes adds observability without affecting existing performance. Each agent operates independently while Parents aggregate without bottlenecks. We’re SOC 2 Type 2 certified with enterprise features including RBAC, SSO, audit logging, and on-premises deployment options.
There is no catch. The Netdata Agent is GPLv3+ licensed and free forever. We monetize through Netdata Cloud (SaaS) which provides centralized management, team collaboration, infrastructure-level dashboards, and managed AI features. The free Community tier supports 5 nodes (personal use only). Larger deployments and commercial use require paid plans (with volume discounts) or on-premises deployment. Your observability data always stays on your infrastructure - only metadata travels to Cloud.
Netdata’s architecture is optimized for efficiency: (1) Edge processing keeps data local, (2) Industry-leading compression (0.6 bytes/sample), (3) WORM storage eliminates compaction overhead, (4) ML runs as low-priority background tasks, (5) Intelligent spreading of work over time. The University of Amsterdam study validated Netdata as the most energy-efficient monitoring solution with lowest CPU, RAM, and application impact - even at per-second collection.
Yes. Netdata integrates with existing observability stacks through multiple paths: (1) Export metrics to Prometheus, InfluxDB, Graphite, OpenTSDB, TimescaleDB, (2) Ingest metrics via OpenTelemetry, Prometheus, StatsD, (3) Use Grafana datasource plugin for visualization, (4) Stream data to Parents for centralization. Many organizations use Netdata for real-time troubleshooting while keeping existing tools for long-term storage or compliance.
Netdata provides comprehensive log management through direct systemd-journal (Linux) and Windows Event Log access - eliminating expensive pipelines and centralized clusters. This achieves 90% cost reduction vs Elasticsearch/Splunk while providing 200× more accurate analysis (1M entries analyzed vs 5K). For organizations requiring centralized log storage or advanced search, Netdata complements ELK by providing real-time log access and correlation with metrics.
Deploy in 60 seconds with one command: wget -O /tmp/netdata-kickstart.sh https://get.netdata.cloud/kickstart.sh && sh /tmp/netdata-kickstart.sh. The installer auto-discovers your infrastructure, generates dashboards instantly, and begins ML training within 15 minutes. For Kubernetes, use our Helm chart. For Docker, run docker run -d --name=netdata -p 19999:19999 netdata/netdata. Access dashboards at http://localhost:19999 or connect to Netdata Cloud for centralized management.
Community support is available through GitHub Discussions, Discord, and Community Forums. Paid plans include email/ticket support (Business) or 24/7 availability with dedicated teams (Enterprise). We also offer professional services for implementation, architecture design, migration support, and training. The documentation is comprehensive with guides, tutorials, and troubleshooting resources.
Yes. Netdata Agents operate completely offline with local dashboards at http://localhost:19999. For centralized dashboards in air-gapped environments, deploy Netdata Parents (same software as Agents, configured as aggregation points) or use Netdata Cloud On-Premises - a complete control plane hosted in your datacenter. All observability data stays within your security perimeter. Only Netdata Cloud SaaS requires internet connectivity.
Netdata is SOC 2 Type 2 certified with architecture designed for compliance: (1) All metrics stay on-premises (data sovereignty), (2) TLS encryption everywhere, (3) Zero-trust architecture, (4) RBAC with granular permissions, (5) SSO integration (LDAP/AD, Okta, OIDC), (6) Comprehensive audit logging, (7) Forward Secure Sealing for logs. We align with GDPR, CCPA, HIPAA (BAA available), and PCI DSS requirements. Air-gapped deployment options available for maximum security isolation.
Netdata Agent is the open source monitoring software (GPLv3+) installed on each system. It collects metrics, stores data locally, runs ML, evaluates alerts, and serves local dashboards. Agents work completely offline. Netdata Cloud is a SaaS control plane that unifies multiple Agents/Parents, providing centralized management, team collaboration, infrastructure-level dashboards, RBAC, SSO, and managed AI features. Cloud never stores your metrics - only metadata (hostnames, chart titles). Queries are distributed to Agents/Parents in real-time.
Absolutely! Netdata thrives on community contributions. We welcome code contributions, documentation improvements, bug reports, feature requests, and community support. Visit our GitHub repository to get started. We have 615+ contributors and maintain transparent development with public roadmaps. Join our Discord to connect with the community and core team.
Open Source Agent: Free forever for unlimited nodes. Netdata Cloud Community: Free for 5 nodes (personal use only). Homelab: Unlimited nodes for personal use only. Business: Per-node pricing (billed yearly or monthly) with volume discounts, includes unlimited metrics/logs/users, ML, AI sessions, RBAC, SSO - for freelancers, professionals, and businesses. Enterprise On-Premises: Custom pricing for air-gapped deployments. All plans use transparent per-node pricing - no charges for data volume, metrics, logs, or users. See full pricing details.