 |
VOOZH | about |
|
VOOZH | about |
The only agent that thinks for itself
Autonomous Monitoring with self-learning AI built-in, operating independently across your entire stack.
Centralized metrics streaming and storage
Aggregate metrics from multiple agents into centralized Parent nodes for unified monitoring across your infrastructure.
Fully managed cloud platform
Access your monitoring data from anywhere with our SaaS platform. No infrastructure to manage, automatic updates, and global availability.
Deploy Netdata Cloud in your infrastructure
Run the full Netdata Cloud platform on-premises for complete data sovereignty and compliance with your security policies.
Powerful, intuitive monitoring interface
Modern, responsive UI built for real-time troubleshooting with customizable dashboards and advanced visualization capabilities.
Monitor on the go
Native iOS and Android apps bring full monitoring capabilities to your mobile device with real-time alerts and notifications.
The future of infrastructure observability
See our strategic direction across AI-native observability, full-stack signals, operational intelligence, and enterprise platform maturity.
Best energy efficiency
True real-time per-second
100% automated zero config
Centralized observability
Multi-year retention
High availability built-in
Zero maintenance
Always up-to-date
Enterprise security
Complete data control
Air-gap ready
Compliance certified
Millisecond responsiveness
Infinite zoom & pan
Works on any device
Native performance
Instant alerts
Monitor anywhere
AI-native observability
Continuous delivery
Open source foundation
80% Faster Incident Resolution
True Real-Time and Simple, even at Scale
90% Cost Reduction, Full Fidelity
See and Map Your Entire Network
Single Pane of Glass
Control Without Surrender
Integrations
800+ collectors and notification channels, auto-discovered and ready out of the box.
Reduced monitoring costs by 46% while cutting staff overhead by 67%.
— Leonardo Antunez, Codyas
No data shipping. No central storage costs. Query at the edge.
So many out-of-the-box features! I mostly don't have to develop anything.
— Simon Beginn, LANCOM Systems
Point-and-click troubleshooting. No PromQL, no LogQL, no learning curve.
Enterprise efficiency without enterprise complexity—real ROI from day one.
— Leonardo Antunez, Codyas
Zero data egress. Only metadata reaches the cloud. Your metrics stay on your infrastructure.
Auto-discovered and configured. No manual setup required.
Slack, PagerDuty, Teams, email, webhooks—all built-in.
Built for the People Who Get Paged
Every Industry Has Rules. We Master Them.
Monitor Any Technology. Configure Nothing.
Complete Visibility. Total Control.
Don't Take Our Word for It
Netdata gives more than you invest in it. A rare unicorn that obeys the Pareto rule.
— Eduard Porquet Mateu, TMB Barcelona
Reduced website downtime by 99% and cloud bill by 30% using Netdata alerts.
— Falkland Islands Government
Optimized resource allocation based on Netdata alerts cut cloud spending by 30%.
— Falkland Islands Government
Reduced monitoring staff by 67% while cutting operational costs by 46%.
— Codyas
Netdata has agent capacity or a plugin for everything, including Windows and Kubernetes.
— Eduard Porquet Mateu, TMB Barcelona
So many out-of-the-box features! I mostly don't have to develop anything.
— Simon Beginn, LANCOM Systems
From 2-3 minutes to 30 seconds—instant visibility into any node issue.
— Matthew Artist, Nodecraft
20% less downtime and 40% budget optimization from out-of-the-box monitoring.
— Simon Beginn, LANCOM Systems
Pay per Node. Unlimited Everything Else.
One price per node. Unlimited metrics, logs, users, and retention. No per-GB surprises.
What's Your Monitoring Really Costing You?
Most teams overpay by 40-60%. Let's find out why.
Your Infrastructure Is Unique. Let's Talk.
Because monitoring 10 nodes is different from monitoring 10,000.
Monitoring That Sells Itself
Deploy in minutes. Impress clients in hours. Earn recurring revenue for years.
Per-Second Metrics at Homelab Prices
Same engine, same dashboards, same ML. Just priced for tinkerers.
$1,000 Per Referral. Unlimited Referrals.
Your colleagues get 10% off. You get 10% commission. Everyone wins.
"Netdata's significant positive impact" — LANCOM Systems
Compare vs Datadog, Grafana, Dynatrace
"Cut costs by 46%, staff by 67%" — Codyas
"Reduced cloud bill by 30%" — Falkland Islands Gov
"Better observability with Netdata than combining other tools." — TMB Barcelona
DPA, SLAs, on-prem, volume pricing
One command, 30 seconds, real data—no sandbox needed
Auto-config + per-node pricing = predictable profit
8-episode Netdata tutorial by LearnLinux.tv
3rd most starred monitoring project
Customers report 40-67% cost cuts, 99% downtime reduction
Free tier lets them try before they buy
AI Support Assistant, Available 24/7
Nedi has access to all official documentation, source code, and resources. Ask any question about Netdata—responds in your language.
Engineering Insights & Product Updates
Jun 2026
Network Monitoring, the Netdata Way: …
Interface counters tell you a port is busy. …
Jun 2026
5 Best SolarWinds Alternatives for 2026
As organizations modernize their …
Jun 2026
SolarWinds Price Increases 2026: What …
If you’re a SolarWinds customer facing …
May 2026
High-cardinality metrics at scale: why …
The “high cardinality is …
Never Fight Fires Alone
Docs, community, and expert help—pick your path to resolution.
60 Seconds to First Dashboard
One command to install. Zero config. 850+ integrations documented.
Level Up Your Monitoring
76,000+ Engineers Strong
Per-Second. 90% Cheaper. Data Stays Home.
See why teams switch from Datadog, Prometheus, Grafana, and more.
> Browse all comparisonsTrace issues directly in the source code
Get architecture recommendations
One of the most popular open-source monitoring projects
Enterprise-grade security and compliance
Your metrics stay on your infrastructure
"Most energy-efficient monitoring solution" — ICSOC 2023, peer-reviewed
"Doesn't miss alerts—mission-critical trust for safety software"
Global community improving monitoring for everyone
Trusted by teams worldwide
Free forever, fully open source agent
Work from anywhere, async-friendly culture
Your work helps millions of systems
Netdata is evolving from infrastructure monitoring into a complete, AI-native observability platform. This page outlines our strategic direction and the investments we are making across the product.
The four pillars guiding product development, engineering priorities, and platform decisions
Extending unsupervised ML toward proactive anomaly surfacing, automated root cause analysis, and autonomous AI SRE capabilities that triage incidents and recommend remediation.
Building toward a single platform covering infrastructure metrics, application traces, network topology, and cloud service health with OpenTelemetry compliance across all signal types.
Investing in richer custom dashboards, cloud-evaluated alert aggregation, SLO/SLA compliance reporting, and deeper integration with incident management workflows.
Deepening support for external secret stores, expanding ITSM integrations (ServiceNow, PagerDuty), strengthening access controls, and hardening for air-gapped environments.
Expanding OpenTelemetry compatibility, Prometheus remote write, Grafana plugin capabilities, and third-party integrations so Netdata fits into any existing monitoring stack.
Continuing to push compute to the edge for predictable costs, low latency, and full data sovereignty while improving streaming protocols and parent scalability.
Trusted by organizations worldwide
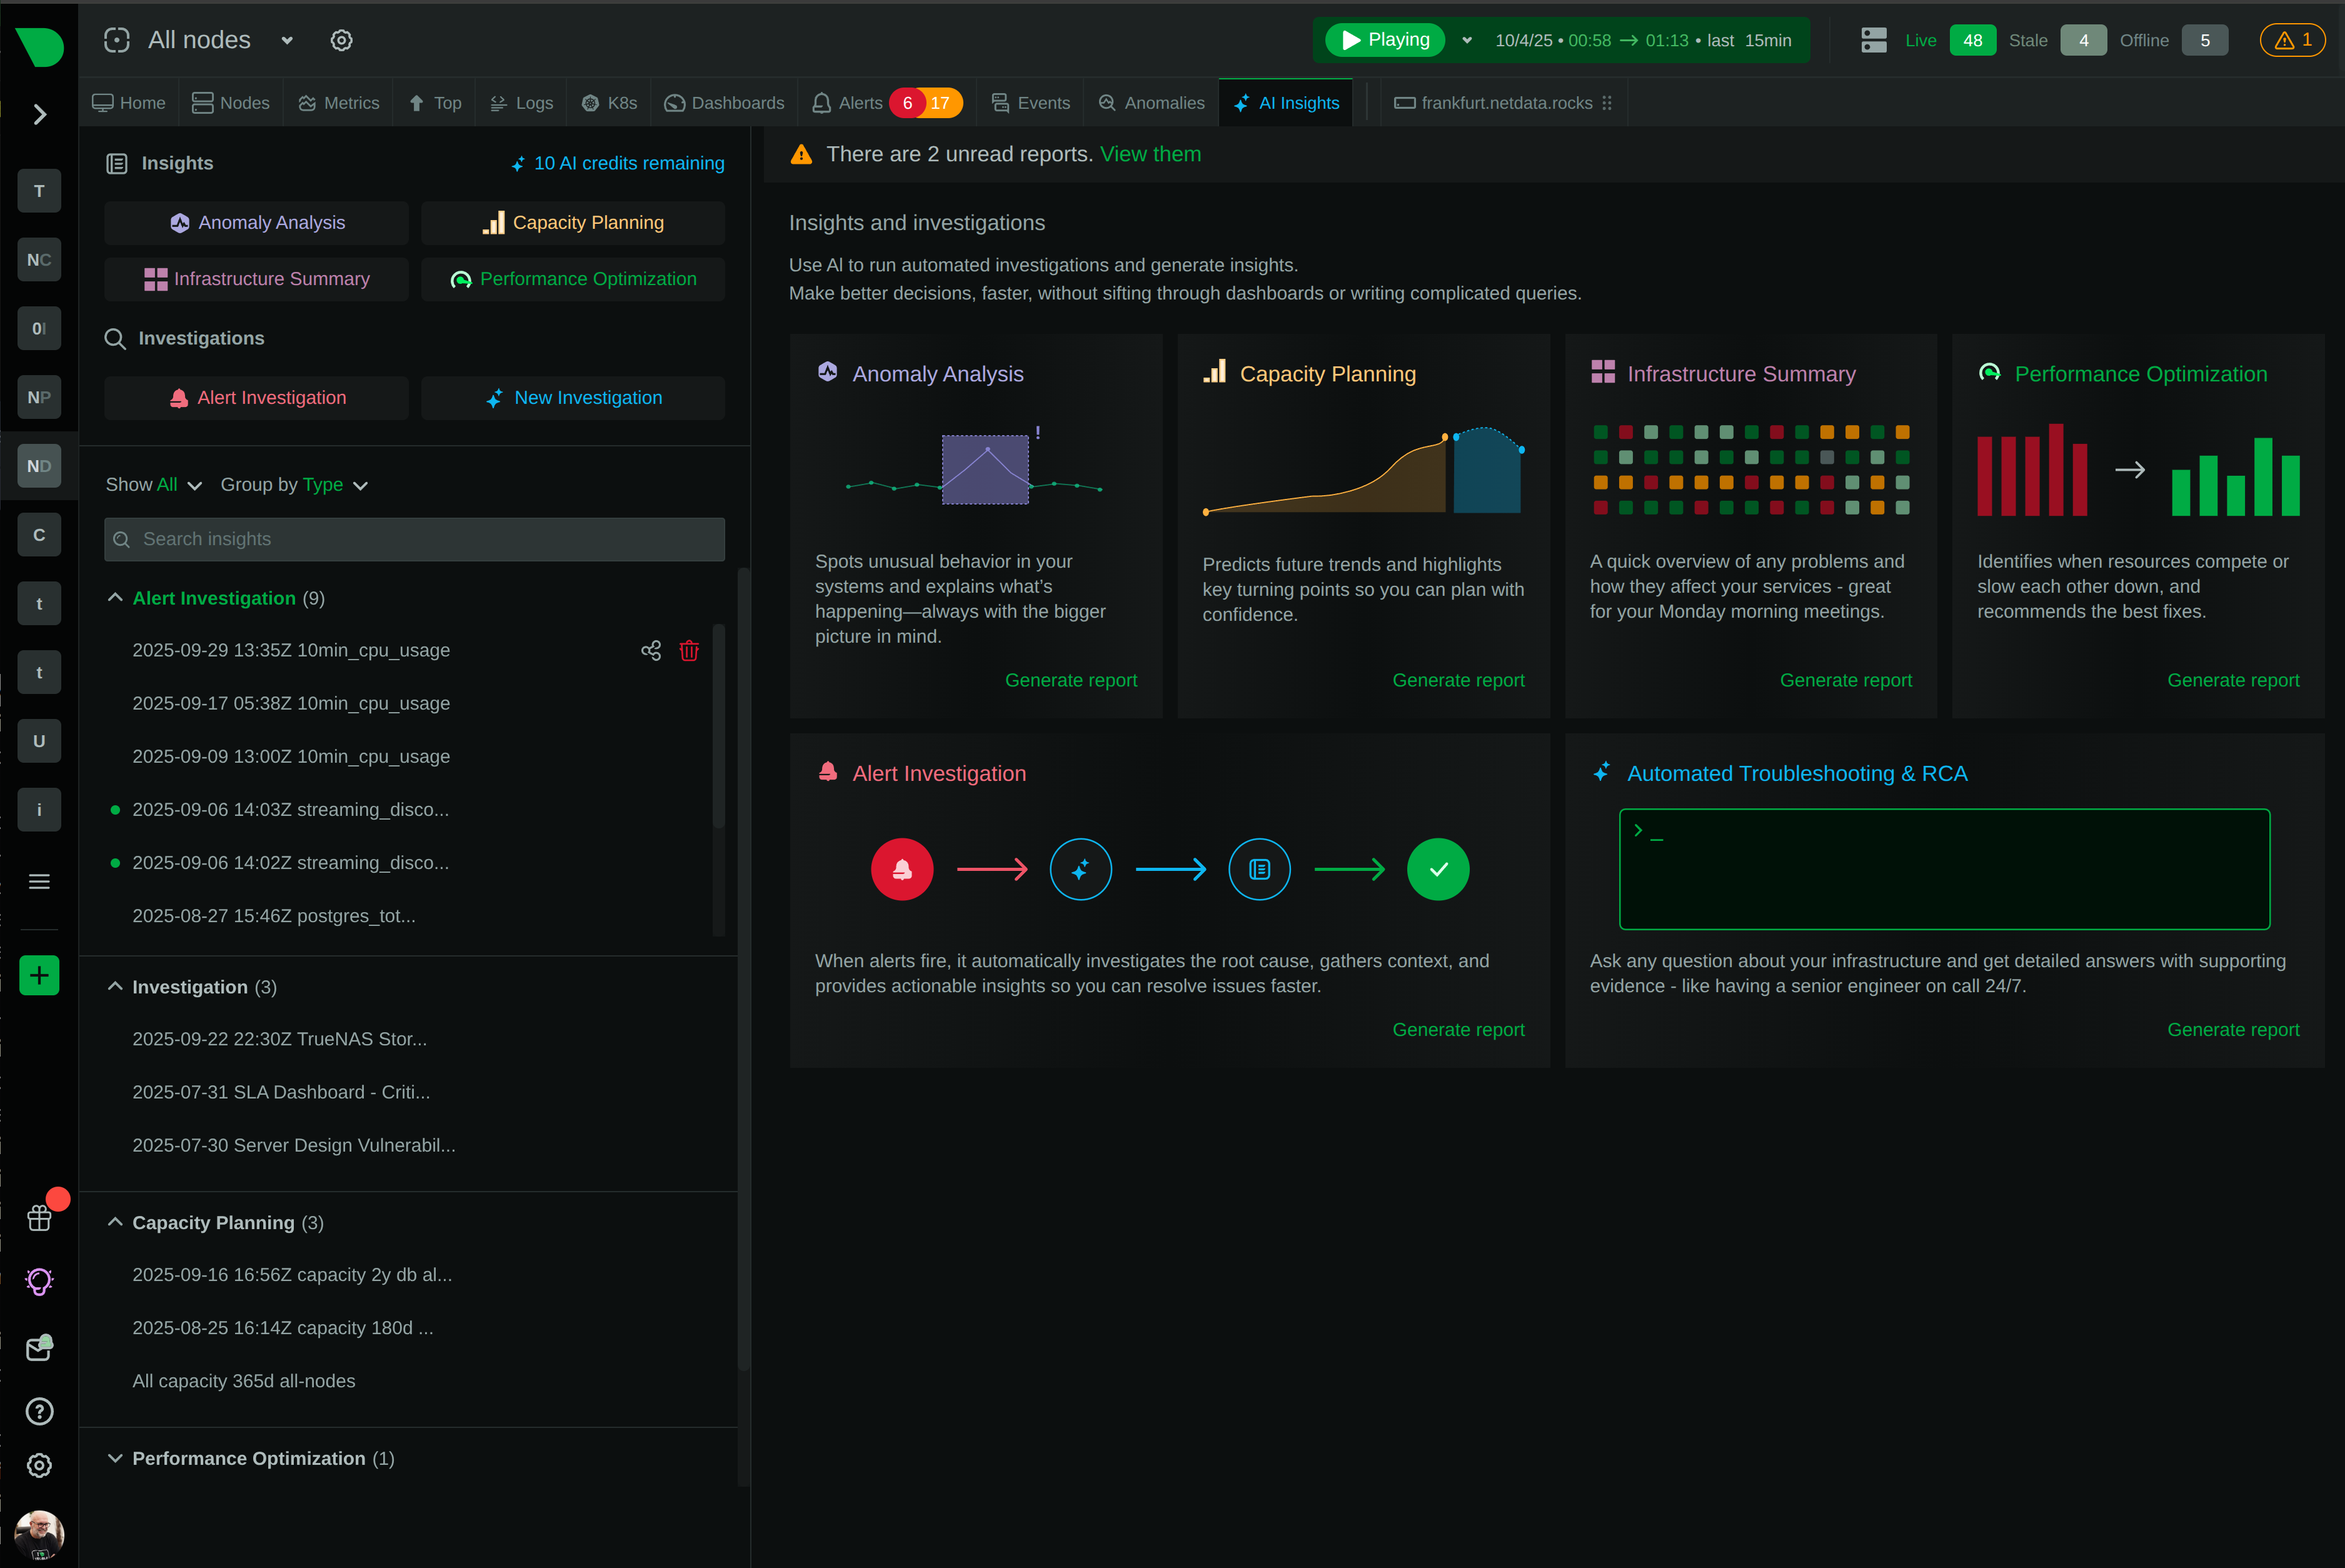
Netdata already runs unsupervised ML on every collected metric. We are extending this foundation toward proactive anomaly surfacing, automated root cause analysis, and autonomous AI SRE capabilities.
18 ML models per metric, trained every 3 hours
Explore AI FeaturesWe are building toward a single platform covering all signal types. OpenTelemetry compliance, network flow analysis, distributed tracing, and service dependency mapping are active areas of investment.
One platform for all observability signals
See IntegrationsEnterprise teams need views tailored to their role and workflow. We are investing in richer custom dashboards, drag-and-drop chart composition, and configurable views per team.
Custom dashboards for every team
View Dashboard FeaturesAlert aggregation, SLO/SLA compliance reporting, deeper incident management integration, and centrally managed alert configurations are key focus areas.
Smarter alerts, less noise
Explore AlertingExternal secret stores, ITSM integrations (ServiceNow, PagerDuty), strengthened RBAC, and hardened support for air-gapped and compliance-sensitive environments.
Built for regulated environments
Enterprise FeaturesAgent every 6 weeks, Cloud continuous
GitHub Releases
78,000+ GitHub stars, 615+ contributors
Join the Community
Direct access to the product team
Request a Briefing
The commitments that inform every product decision at Netdata
Every new capability auto-discovers, auto-configures, and delivers value out of the box. No setup wizards, no manual instrumentation.
We distribute compute to the edge instead of centralizing data. This keeps costs predictable, latency low, and data under your control.
The Netdata Agent, including the ML engine, database, and query engine, is licensed under GPLv3+. That commitment is permanent.
Monitoring should cost a fraction of the infrastructure it monitors. Our architecture eliminates the data pipelines and storage costs that make observability expensive.
Virtualized infrastructure demands high-resolution data. We collect at per-second granularity as a standard, available to every user.
Metrics stay on your infrastructure. Only dashboard metadata reaches the cloud. This is a design decision, built into the architecture.
We share strategic direction and investment areas publicly on this page. Specific timelines and feature-level detail are shared with enterprise and channel partners under NDA through roadmap briefings. We believe in shipping working software over publishing speculative timelines.
The Netdata Agent ships stable releases on a six-week cadence, with nightly builds available for users who want the latest improvements. Netdata Cloud operates on continuous delivery, with updates shipping as soon as they are ready. You can track all agent releases on our GitHub Releases page.
There are several ways to shape Netdata’s direction: open a GitHub Discussion or issue, participate in community forums, or provide feedback through the product. Enterprise customers have direct access to the product team for prioritization discussions. We also analyze usage telemetry to understand which capabilities deliver the most value.
Yes, distributed tracing with native OpenTelemetry support is an active area of investment. This will allow Netdata to provide end-to-end visibility from infrastructure metrics through application traces in a single platform.
Yes. The Netdata Agent, including the database (DBENGINE), query engine, health engine, and machine learning engine, is licensed under GPLv3+. Every new agent capability ships as open source. This is a permanent commitment.
We are building an AI SRE that runs proactively, 24/7, across your entire infrastructure. It pulls context from other tools in your environment and works like a teammate: triaging incidents, correlating signals across the stack, and recommending remediation autonomously. The AI Co-Engineer already provides natural language troubleshooting, automated incident reports, and root cause analysis. We are extending this toward proactive anomaly surfacing and fully automated root cause analysis.
Enterprise and channel partners can schedule a briefing with our product team. These sessions cover specific timelines, upcoming capabilities relevant to your environment, and the opportunity to provide input on prioritization.
Enterprise customers have a direct line to our product team. Feature requests are evaluated based on customer impact, strategic alignment, and technical feasibility. High-priority requests can be expedited, and design partners often get early access to validate new capabilities before general availability.