 |
VOOZH | about |
|
VOOZH | about |
The only agent that thinks for itself
Autonomous Monitoring with self-learning AI built-in, operating independently across your entire stack.
Centralized metrics streaming and storage
Aggregate metrics from multiple agents into centralized Parent nodes for unified monitoring across your infrastructure.
Fully managed cloud platform
Access your monitoring data from anywhere with our SaaS platform. No infrastructure to manage, automatic updates, and global availability.
Deploy Netdata Cloud in your infrastructure
Run the full Netdata Cloud platform on-premises for complete data sovereignty and compliance with your security policies.
Powerful, intuitive monitoring interface
Modern, responsive UI built for real-time troubleshooting with customizable dashboards and advanced visualization capabilities.
Monitor on the go
Native iOS and Android apps bring full monitoring capabilities to your mobile device with real-time alerts and notifications.
The future of infrastructure observability
See our strategic direction across AI-native observability, full-stack signals, operational intelligence, and enterprise platform maturity.
Best energy efficiency
True real-time per-second
100% automated zero config
Centralized observability
Multi-year retention
High availability built-in
Zero maintenance
Always up-to-date
Enterprise security
Complete data control
Air-gap ready
Compliance certified
Millisecond responsiveness
Infinite zoom & pan
Works on any device
Native performance
Instant alerts
Monitor anywhere
AI-native observability
Continuous delivery
Open source foundation
80% Faster Incident Resolution
True Real-Time and Simple, even at Scale
90% Cost Reduction, Full Fidelity
See and Map Your Entire Network
Single Pane of Glass
Control Without Surrender
Integrations
800+ collectors and notification channels, auto-discovered and ready out of the box.
Reduced monitoring costs by 46% while cutting staff overhead by 67%.
— Leonardo Antunez, Codyas
No data shipping. No central storage costs. Query at the edge.
So many out-of-the-box features! I mostly don't have to develop anything.
— Simon Beginn, LANCOM Systems
Point-and-click troubleshooting. No PromQL, no LogQL, no learning curve.
Enterprise efficiency without enterprise complexity—real ROI from day one.
— Leonardo Antunez, Codyas
Zero data egress. Only metadata reaches the cloud. Your metrics stay on your infrastructure.
Auto-discovered and configured. No manual setup required.
Slack, PagerDuty, Teams, email, webhooks—all built-in.
Built for the People Who Get Paged
Every Industry Has Rules. We Master Them.
Monitor Any Technology. Configure Nothing.
Complete Visibility. Total Control.
Don't Take Our Word for It
Netdata gives more than you invest in it. A rare unicorn that obeys the Pareto rule.
— Eduard Porquet Mateu, TMB Barcelona
Reduced website downtime by 99% and cloud bill by 30% using Netdata alerts.
— Falkland Islands Government
Optimized resource allocation based on Netdata alerts cut cloud spending by 30%.
— Falkland Islands Government
Reduced monitoring staff by 67% while cutting operational costs by 46%.
— Codyas
Netdata has agent capacity or a plugin for everything, including Windows and Kubernetes.
— Eduard Porquet Mateu, TMB Barcelona
So many out-of-the-box features! I mostly don't have to develop anything.
— Simon Beginn, LANCOM Systems
From 2-3 minutes to 30 seconds—instant visibility into any node issue.
— Matthew Artist, Nodecraft
20% less downtime and 40% budget optimization from out-of-the-box monitoring.
— Simon Beginn, LANCOM Systems
Pay per Node. Unlimited Everything Else.
One price per node. Unlimited metrics, logs, users, and retention. No per-GB surprises.
What's Your Monitoring Really Costing You?
Most teams overpay by 40-60%. Let's find out why.
Your Infrastructure Is Unique. Let's Talk.
Because monitoring 10 nodes is different from monitoring 10,000.
Monitoring That Sells Itself
Deploy in minutes. Impress clients in hours. Earn recurring revenue for years.
Per-Second Metrics at Homelab Prices
Same engine, same dashboards, same ML. Just priced for tinkerers.
$1,000 Per Referral. Unlimited Referrals.
Your colleagues get 10% off. You get 10% commission. Everyone wins.
"Netdata's significant positive impact" — LANCOM Systems
Compare vs Datadog, Grafana, Dynatrace
"Cut costs by 46%, staff by 67%" — Codyas
"Reduced cloud bill by 30%" — Falkland Islands Gov
"Better observability with Netdata than combining other tools." — TMB Barcelona
DPA, SLAs, on-prem, volume pricing
One command, 30 seconds, real data—no sandbox needed
Auto-config + per-node pricing = predictable profit
8-episode Netdata tutorial by LearnLinux.tv
3rd most starred monitoring project
Customers report 40-67% cost cuts, 99% downtime reduction
Free tier lets them try before they buy
AI Support Assistant, Available 24/7
Nedi has access to all official documentation, source code, and resources. Ask any question about Netdata—responds in your language.
Engineering Insights & Product Updates
Jun 2026
Network Monitoring, the Netdata Way: …
Interface counters tell you a port is busy. …
Jun 2026
5 Best SolarWinds Alternatives for 2026
As organizations modernize their …
Jun 2026
SolarWinds Price Increases 2026: What …
If you’re a SolarWinds customer facing …
May 2026
High-cardinality metrics at scale: why …
The “high cardinality is …
Never Fight Fires Alone
Docs, community, and expert help—pick your path to resolution.
60 Seconds to First Dashboard
One command to install. Zero config. 850+ integrations documented.
Level Up Your Monitoring
76,000+ Engineers Strong
Per-Second. 90% Cheaper. Data Stays Home.
See why teams switch from Datadog, Prometheus, Grafana, and more.
> Browse all comparisonsTrace issues directly in the source code
Get architecture recommendations
One of the most popular open-source monitoring projects
Enterprise-grade security and compliance
Your metrics stay on your infrastructure
"Most energy-efficient monitoring solution" — ICSOC 2023, peer-reviewed
"Doesn't miss alerts—mission-critical trust for safety software"
Global community improving monitoring for everyone
Trusted by teams worldwide
Free forever, fully open source agent
Work from anywhere, async-friendly culture
Your work helps millions of systems
Eliminate traditional log pipelines entirely. Netdata’s edge-first architecture queries logs directly from native system formats - no shipping, parsing, or indexing required. Achieve 90% cost reduction with sub-2-second latency at any scale.
Six breakthrough capabilities that redefine what’s possible
Flat per-node pricing replaces unpredictable per-GB charges. Keep 100% of your logs without budget anxiety or forced sampling.
Query logs instantly where they live. Direct file access with OS caching delivers console-quality speed without pipeline delays.
Leverage systemd-journal and Windows Event Log already running on every system. No clusters to manage, no indexes to maintain.
Logs appear alongside metrics for the same timeframe. Automatic correlation eliminates manual timestamp matching and context switching.
Each agent operates independently. Adding 1,000 nodes doesn’t affect existing performance - proven at 100,000+ node deployments.
All logs stay on your infrastructure. Zero data egress, native access control, and Forward Secure Sealing for tamper detection.
Trusted by operations teams worldwide
60 seconds from install to full log visibility
View Installation Guide
80% reduction in MTTR through automatic correlation
Explore Troubleshooting Features
Proven at 100,000+ node scale with consistent performance
Learn About Scalability
Zero data egress - 100% data sovereignty
Review Security Design
Architecture Comparison
Fundamental architectural differences that deliver superior economics and performance
Capability
Netdata Zero Pipeline
Traditional Pipelines
Cost Model
✅ Flat per-node pricing
Unlimited logs, predictable budget
❌ Variable per-GB charges
Unpredictable bills, forced sampling
Query Latency
✅ Sub-2 seconds
Direct file access, OS caching
⚠️ 5-60 seconds
Pipeline processing, network round-trips
Infrastructure Required
✅ Zero additional components
Leverages native system formats
❌ 5+ components to manage
Agents, aggregators, processors, storage, query
Data Movement
✅ None - query in place
Zero egress, instant access
❌ All logs travel centrally
Bandwidth costs, ingestion delays
Storage Efficiency
✅ Native format - no overhead
Native compression, inline indexing
❌ 200-500% overhead
Inverted indexes, replicas, metadata
Scalability Pattern
✅ Horizontal - add agents
Linear cost, no bottlenecks
⚠️ Vertical - bigger clusters
Exponential complexity and cost
Single Point of Failure
✅ None - fully distributed
Each agent operates independently
❌ Central pipeline required
Cluster failure affects all
Time to Value
✅ 60 seconds
Auto-discovery, zero configuration
⚠️ Days to weeks
Pipeline setup, tuning, testing
Operational Burden
✅ Minimal - self-managing
No clusters, no tuning
❌ High - constant attention
Scaling, upgrades, performance tuning
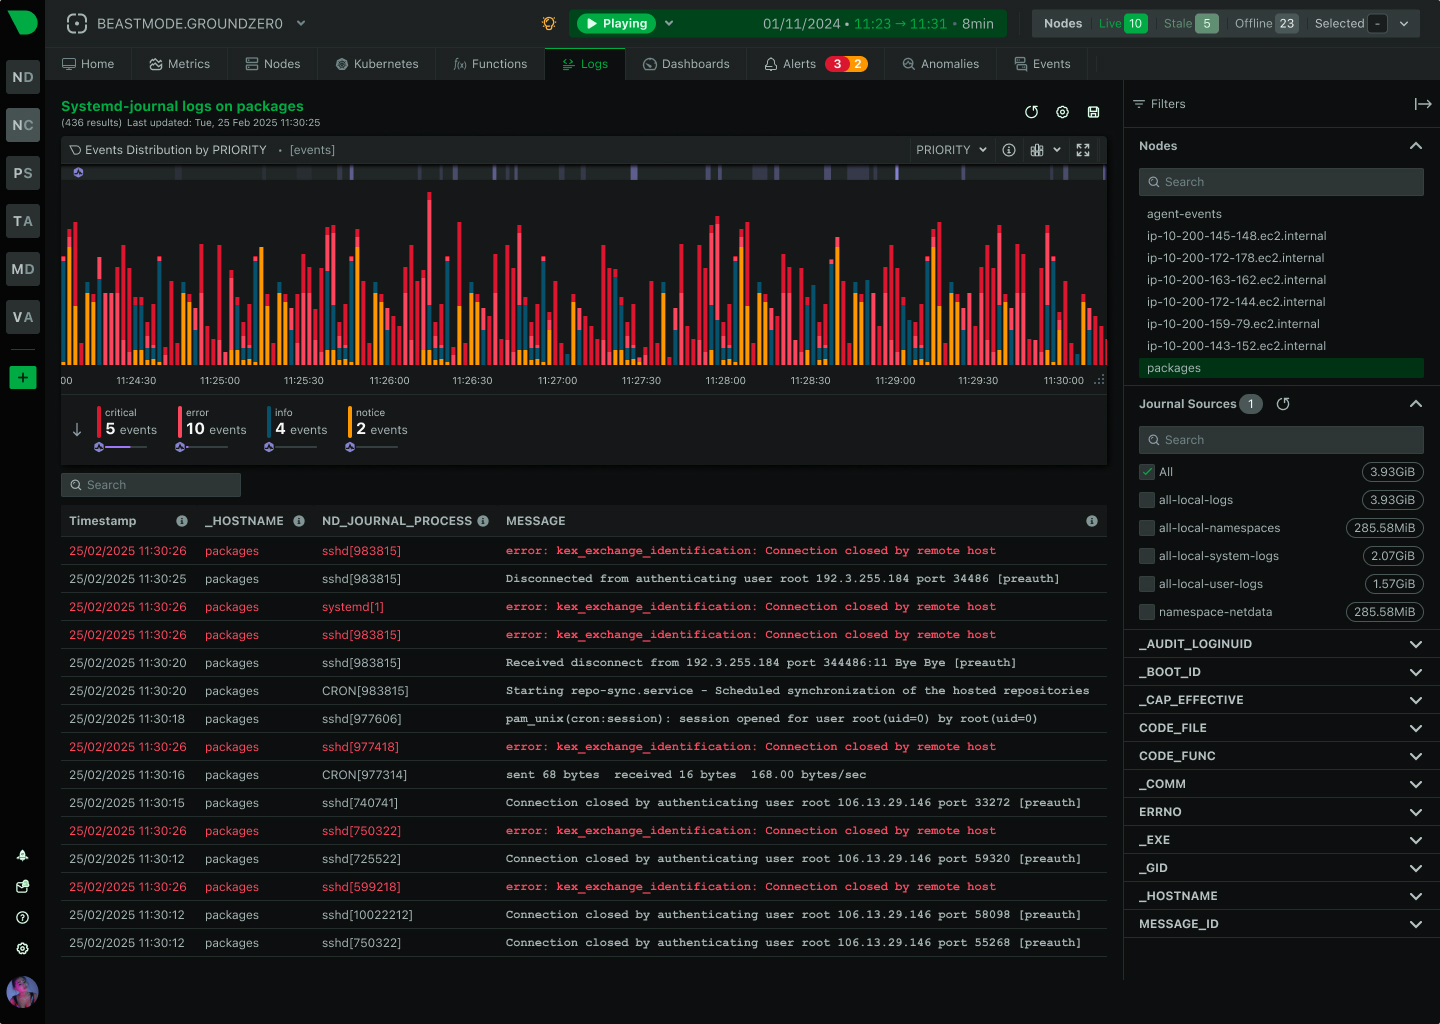
Every field in every log entry automatically indexed by systemd-journal. Query any field instantly with full-text search, field statistics, and histogram breakdowns. Forward Secure Sealing provides tamper detection for compliance. Native OS caching delivers blazing-fast repeated queries.
200× more accurate field statistics than traditional tools
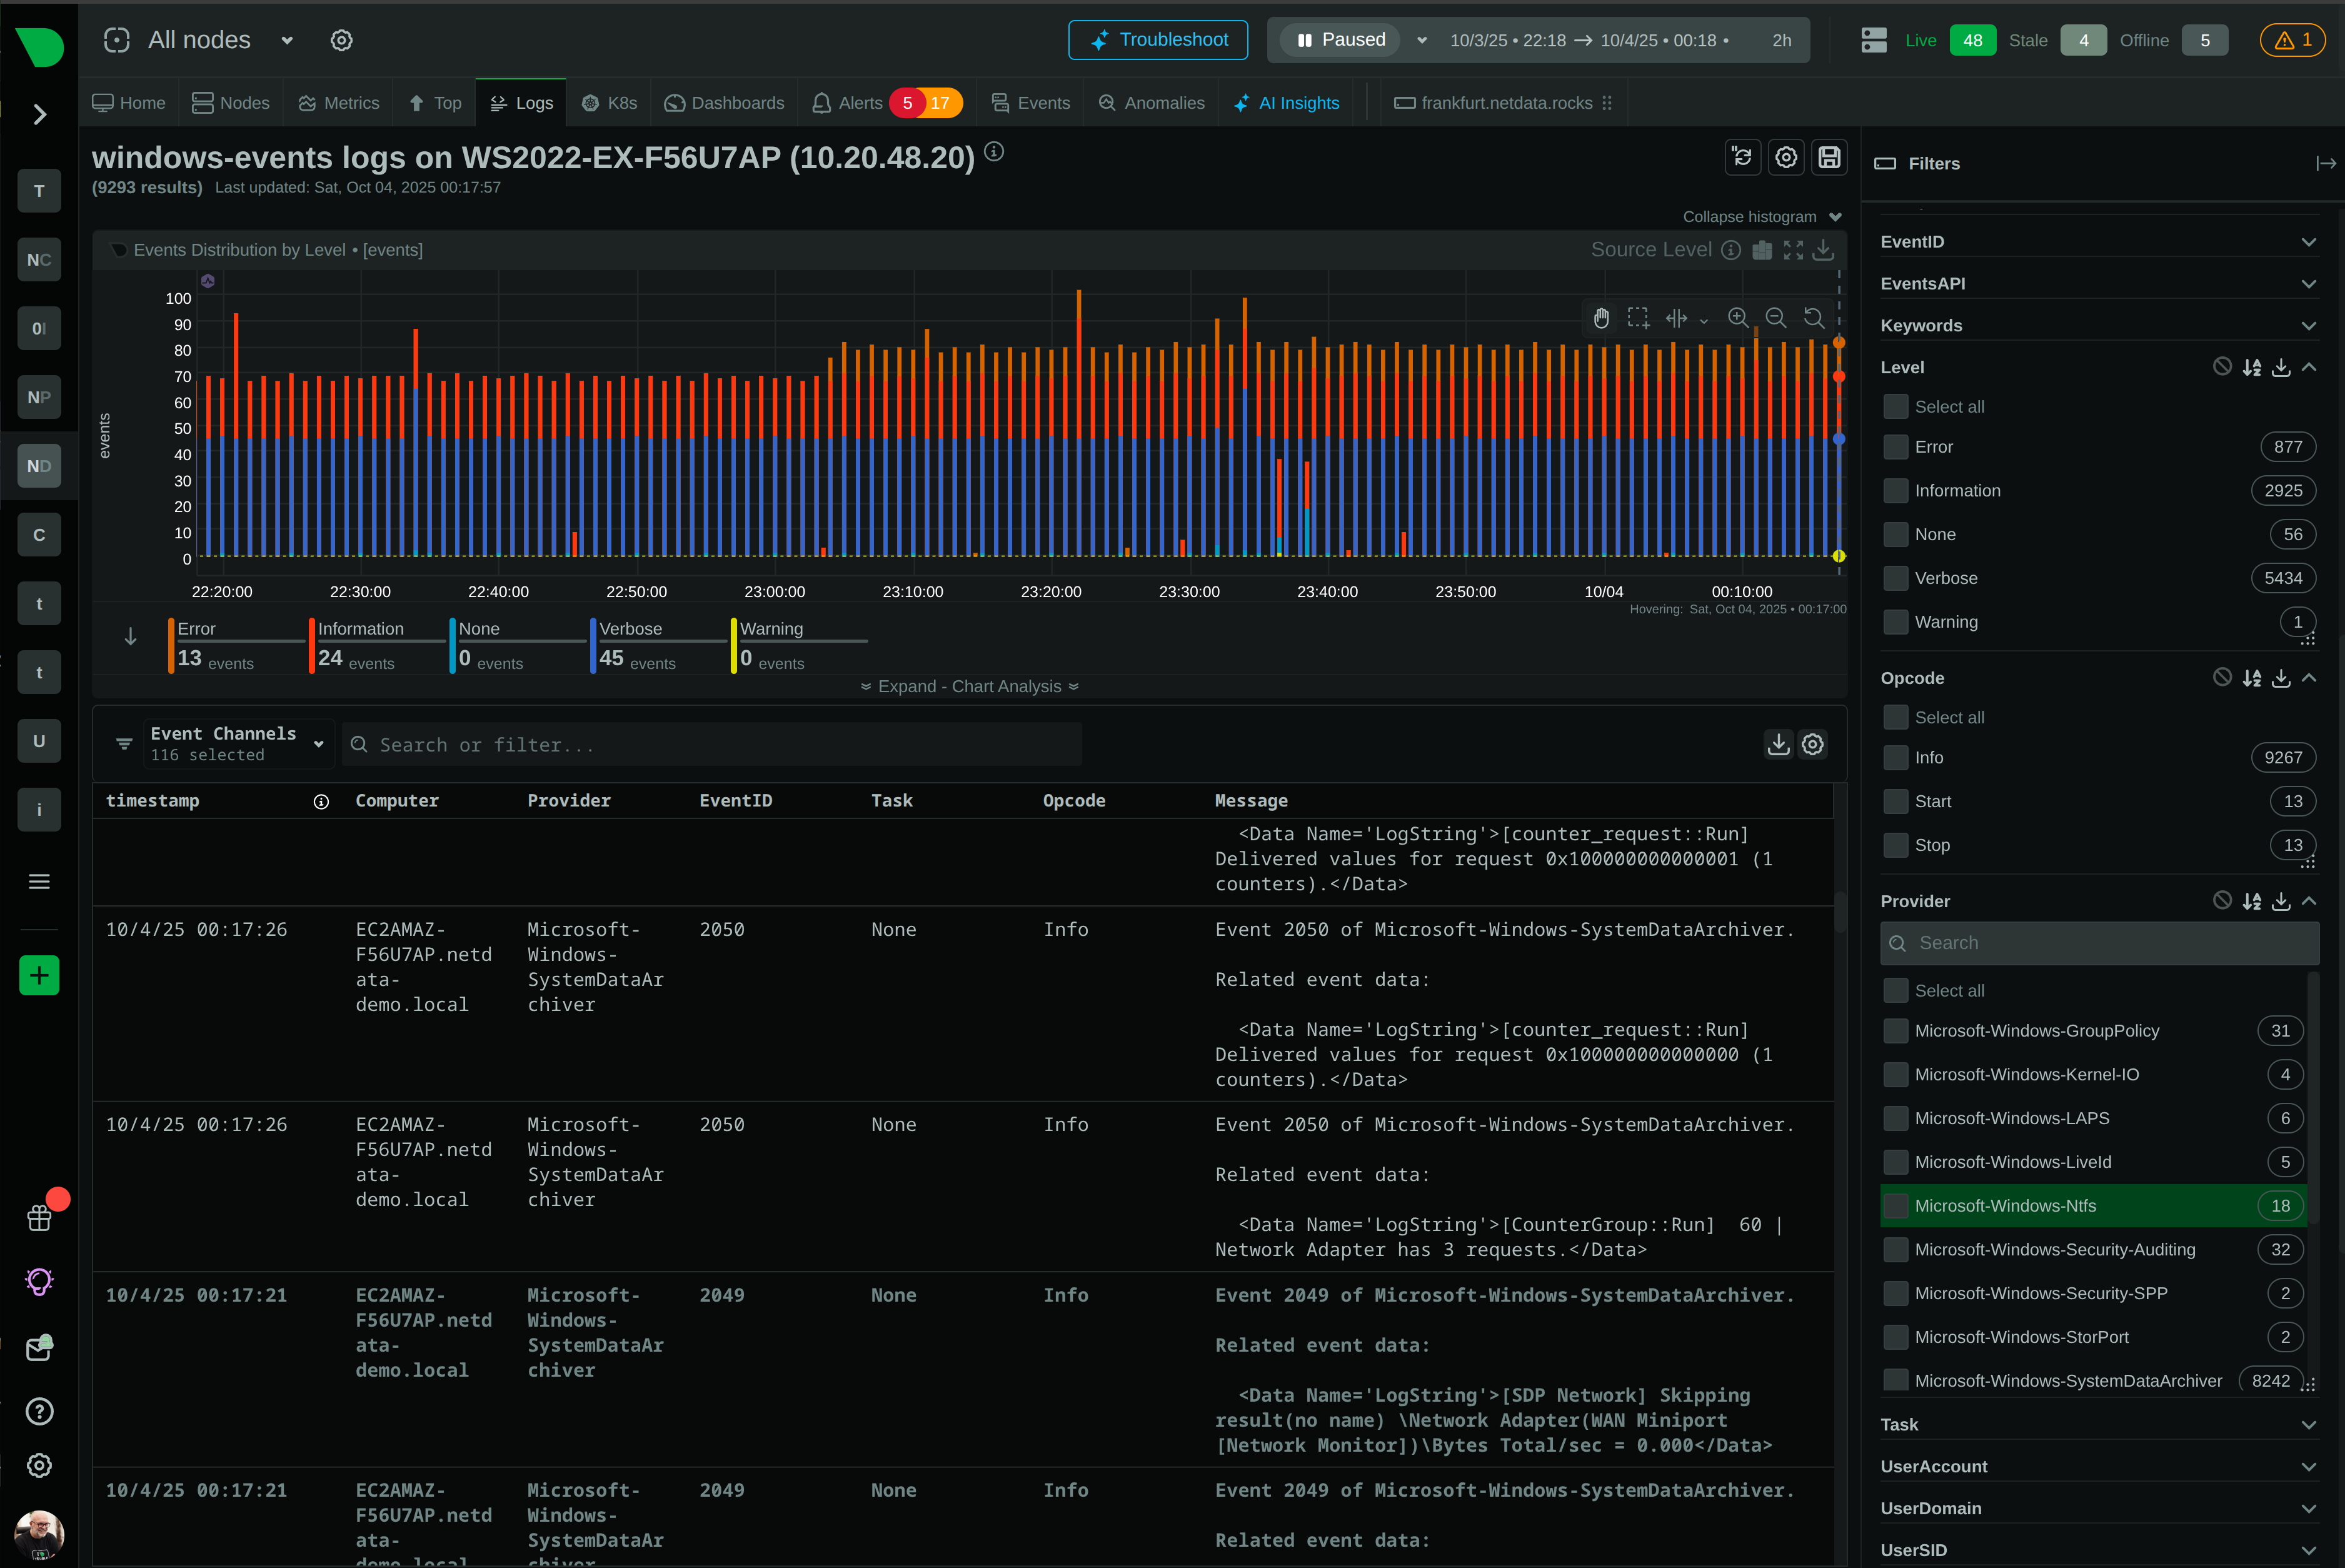
Explore systemd-journal IntegrationDirect queries to Windows Event Log, Event Tracing for Windows (ETW), and TraceLogging. Monitor Application, Security, System, and custom channels with severity-based filtering. Full metadata display including event IDs, sources, and detailed messages. Real-time streaming with historical analysis.
No additional log shipping agents required
View Windows MonitoringPer-second visibility into ephemeral containers without pipeline lag. Automatic discovery of pods, containers, and services. Logs correlate with container metrics for complete context. Native integration with systemd-journal on nodes and container runtime logs. Zero configuration required.
Monitor containers at the speed of Kubernetes
Learn Kubernetes Monitoringlog2journal transforms text, JSON, or logfmt logs into fully structured, indexed systemd-journal entries. Field extraction, renaming, injection, and rewriting without complex parsing rules. Enables structured logging for any application while maintaining native format benefits.
Unify all log formats with native indexing
View log2journal DocumentationIngest OpenTelemetry logs via otelcol.plugin and otel-plugin. Logs are stored in native systemd-journal format - an open standard you can access with any compatible tool. Complement OTel standardization with Netdata's native optimizations and zero-pipeline architecture. Best of both worlds.
OpenTelemetry compatible with edge intelligence
Explore OpenTelemetry SupportFundamental benefits that transform log management economics and operations
Flat per-node pricing eliminates unpredictable per-GB charges. Keep 100% of logs without forced sampling or budget anxiety. Typical 90% cost reduction versus traditional solutions.
Sub-2-second query latency through direct file access and OS caching. Real-time ’tail’ mode provides live streaming. No pipeline processing delays or network round-trips.
Leverage systemd-journal and Windows Event Log already running on every system. No clusters to manage, no indexes to maintain, no components to scale or upgrade.
Logs and metrics from same agent appear in synchronized views. Anomaly Advisor correlates unusual patterns automatically. No manual timestamp matching or tool switching.
Each agent operates independently. Adding nodes doesn’t create bottlenecks or require architectural changes. Proven at 100,000+ node deployments with consistent performance.
All logs stay on your infrastructure in native formats. Zero data egress, native access control, Forward Secure Sealing for tamper detection. Export anywhere using standard tools.
60 seconds from installation to full log visibility. Automatic discovery of systemd-journal and Windows Event Logs. Zero configuration, no schemas, no pipeline setup required.
Analyzes 1 million log entries before sampling versus 5,000 for traditional tools. Every field automatically indexed. Full-text search across all fields with field statistics and histograms.
Netdata Cloud federates queries across all agents in parallel. Results aggregate in milliseconds. No central bottleneck or single point of failure. Infinite read scalability.
June 24, 2026
Netdata has added NPM-class network monitoring: live topology maps, NetFlow and sFlow traffic analysis, SNMP device and trap monitoring, and a dedicated network dashboard, all unified with your full-stack observability and processed at the edge.
June 23, 2026
Discover the top SolarWinds alternatives for 2026. Compare modern monitoring platforms built for cloud-native infrastructure - now with NPM-class network monitoring - with transparent pricing and real-time insights.
June 23, 2026
Understanding SolarWinds' subscription-only pricing changes following the Turn/River Capital acquisition, and exploring your options for infrastructure monitoring.
Zero pipeline means eliminating traditional log aggregation infrastructure entirely. Instead of shipping logs through agents → aggregators → processors → storage → query engines, Netdata queries logs directly where they live using native system formats (systemd-journal on Linux, Windows Event Log on Windows). No data movement, no intermediate processing, no pipeline components to manage.
Direct-to-backend still requires centralized storage infrastructure (Elasticsearch clusters) and suffers from performance bottlenecks during traffic spikes. Netdata leverages systemd-journal’s native capabilities - which already provides indexing, compression, and querying - eliminating the need for separate storage infrastructure. This delivers better performance, lower costs, and zero operational overhead.
systemd-journal provides native structured logging with automatic field indexing. For applications generating text logs, our log2journal tool converts any format (text, JSON, logfmt) into fully structured journal entries. Most ‘complex transformations’ exist to compensate for poor indexing - with native journal support, 90% become unnecessary.
Yes. Netdata supports distributed (logs on each node), centralized (Netdata Parents aggregate logs), and hybrid architectures. Use systemd-journal-upload for native centralization, or configure Netdata Parents to aggregate logs from multiple agents. All approaches maintain edge processing advantages while satisfying compliance requirements. Your data never leaves your infrastructure.
Netdata ingests OpenTelemetry logs via otelcol.plugin and otel-plugin and writes them to systemd-journal format for native indexing. Since systemd-journal is an open standard, logs are accessible with any compatible tool - no export needed. Use OTel for application instrumentation, Netdata for zero-pipeline log management.
systemd-journal handles 80-90% of operational log use cases brilliantly - structured logging, native indexing, compliance (FSS), retention, and performance. For specialized needs like complex cross-system analytics or years of hot centralized storage, integrate Netdata with your existing backend. We support OpenTelemetry ingestion, Grafana integration, and REST API access. Logs are stored in native systemd-journal format - an open standard accessible with any compatible tool.
Netdata provides sub-2-second query latency through direct file access and OS disk caching. Elasticsearch requires network round-trips, query planning, and aggregation across cluster nodes. For operational troubleshooting (recent logs, specific nodes), Netdata is significantly faster. For complex analytics across years of data, specialized backends may be more appropriate.
Netdata queries Windows Event Log, Event Tracing for Windows (ETW), and TraceLogging directly via native Windows APIs. The Netdata Agent queries logs in place - no additional log shipping agents, no exporters, no data movement to external systems. Monitor Application, Security, System, and custom channels with full metadata and real-time streaming. Learn more about Windows monitoring.
Each Netdata Agent operates independently - adding nodes doesn’t create central bottlenecks. Netdata Cloud federates queries across distributed agents in parallel, returning aggregated results in milliseconds. The architecture is proven at 100,000+ node deployments with consistent performance. See Infinite Scalability for details.
Yes. Netdata provides multiple access methods: native Netdata UI (zero-configuration), Grafana integration via datasource plugin, REST API for custom tools, and systemd-journal CLI (journalctl). Most teams run Netdata alongside existing tools initially, then gradually shift high-volume operational logs to Netdata while keeping specialized tools for specific use cases.
Organizations typically achieve 90% cost reduction by eliminating per-GB ingestion charges, storage multiplication, and pipeline infrastructure. Netdata uses flat per-node pricing with volume discounts - no charges for log volume, queries, or users. Traditional centralized log management solutions with per-GB pricing create unpredictable costs that grow exponentially with scale, while Netdata’s predictable per-node model keeps budgets under control. See Pricing for details.
60 seconds from installation to full log visibility. Single-command installation automatically discovers systemd-journal on Linux and Windows Event Logs on Windows. Zero configuration required - logs appear immediately with full-text search, field statistics, and real-time streaming. No schemas to define, no indexes to build, no pipelines to configure. See Installation Guide.
All logs stay on your infrastructure in native formats. systemd-journal provides Forward Secure Sealing (FSS) for tamper detection. Access control uses native OS filesystem permissions - no additional authentication layers. Logs are stored in native systemd-journal format - an open standard accessible with any compatible tool. SOC 2 Type 2 certified. See Security Design for details.
Netdata’s ML-based anomaly detection runs on metrics, and logs appear alongside metrics for the same timeframe. Anomaly Advisor automatically correlates unusual log patterns with metric anomalies, surfacing root cause in top 30-50 results. AI Co-Engineer provides natural language troubleshooting across both logs and metrics.
Yes. Most organizations run Netdata alongside existing tools initially, moving high-volume operational logs to Netdata while keeping specialized tools for specific use cases. This phased approach minimizes disruption while immediately reducing costs. Netdata integrates with existing infrastructure via OpenTelemetry, Grafana, and REST API. Contact sales for migration assistance.
Linux (systemd-journal), Windows (Event Log, ETW, TraceLogging), Kubernetes (container logs), cloud platforms (AWS, Azure, GCP), and hybrid environments. Netdata runs on physical servers, VMs, containers, and edge devices. See Integrations for complete list.
Observability pipelines process data in transit between sources and destinations - adding complexity, latency, and cost. Netdata eliminates the pipeline entirely by processing at the edge and querying in place. No intermediate infrastructure, no data movement, no processing delays. Different architectural philosophy optimized for operational simplicity and cost efficiency.
Netdata Agent uses <5% CPU and 150-200MB RAM while collecting thousands of metrics per second AND querying logs. systemd-journal is already running on every Linux system - Netdata simply queries it. No additional daemons, no separate log collectors, no performance impact. See Resource Utilization for details.
Start with a free trial or install the open-source agent with a single command. Logs appear automatically within 60 seconds. No configuration required. See Getting Started or contact sales for enterprise deployments.