 |
VOOZH | about |
|
VOOZH | about |
The only agent that thinks for itself
Autonomous Monitoring with self-learning AI built-in, operating independently across your entire stack.
Centralized metrics streaming and storage
Aggregate metrics from multiple agents into centralized Parent nodes for unified monitoring across your infrastructure.
Fully managed cloud platform
Access your monitoring data from anywhere with our SaaS platform. No infrastructure to manage, automatic updates, and global availability.
Deploy Netdata Cloud in your infrastructure
Run the full Netdata Cloud platform on-premises for complete data sovereignty and compliance with your security policies.
Powerful, intuitive monitoring interface
Modern, responsive UI built for real-time troubleshooting with customizable dashboards and advanced visualization capabilities.
Monitor on the go
Native iOS and Android apps bring full monitoring capabilities to your mobile device with real-time alerts and notifications.
The future of infrastructure observability
See our strategic direction across AI-native observability, full-stack signals, operational intelligence, and enterprise platform maturity.
Best energy efficiency
True real-time per-second
100% automated zero config
Centralized observability
Multi-year retention
High availability built-in
Zero maintenance
Always up-to-date
Enterprise security
Complete data control
Air-gap ready
Compliance certified
Millisecond responsiveness
Infinite zoom & pan
Works on any device
Native performance
Instant alerts
Monitor anywhere
AI-native observability
Continuous delivery
Open source foundation
80% Faster Incident Resolution
True Real-Time and Simple, even at Scale
90% Cost Reduction, Full Fidelity
See and Map Your Entire Network
Single Pane of Glass
Control Without Surrender
Integrations
800+ collectors and notification channels, auto-discovered and ready out of the box.
Reduced monitoring costs by 46% while cutting staff overhead by 67%.
— Leonardo Antunez, Codyas
No data shipping. No central storage costs. Query at the edge.
So many out-of-the-box features! I mostly don't have to develop anything.
— Simon Beginn, LANCOM Systems
Point-and-click troubleshooting. No PromQL, no LogQL, no learning curve.
Enterprise efficiency without enterprise complexity—real ROI from day one.
— Leonardo Antunez, Codyas
Zero data egress. Only metadata reaches the cloud. Your metrics stay on your infrastructure.
Auto-discovered and configured. No manual setup required.
Slack, PagerDuty, Teams, email, webhooks—all built-in.
Built for the People Who Get Paged
Every Industry Has Rules. We Master Them.
Monitor Any Technology. Configure Nothing.
Complete Visibility. Total Control.
Don't Take Our Word for It
Netdata gives more than you invest in it. A rare unicorn that obeys the Pareto rule.
— Eduard Porquet Mateu, TMB Barcelona
Reduced website downtime by 99% and cloud bill by 30% using Netdata alerts.
— Falkland Islands Government
Optimized resource allocation based on Netdata alerts cut cloud spending by 30%.
— Falkland Islands Government
Reduced monitoring staff by 67% while cutting operational costs by 46%.
— Codyas
Netdata has agent capacity or a plugin for everything, including Windows and Kubernetes.
— Eduard Porquet Mateu, TMB Barcelona
So many out-of-the-box features! I mostly don't have to develop anything.
— Simon Beginn, LANCOM Systems
From 2-3 minutes to 30 seconds—instant visibility into any node issue.
— Matthew Artist, Nodecraft
20% less downtime and 40% budget optimization from out-of-the-box monitoring.
— Simon Beginn, LANCOM Systems
Pay per Node. Unlimited Everything Else.
One price per node. Unlimited metrics, logs, users, and retention. No per-GB surprises.
What's Your Monitoring Really Costing You?
Most teams overpay by 40-60%. Let's find out why.
Your Infrastructure Is Unique. Let's Talk.
Because monitoring 10 nodes is different from monitoring 10,000.
Monitoring That Sells Itself
Deploy in minutes. Impress clients in hours. Earn recurring revenue for years.
Per-Second Metrics at Homelab Prices
Same engine, same dashboards, same ML. Just priced for tinkerers.
$1,000 Per Referral. Unlimited Referrals.
Your colleagues get 10% off. You get 10% commission. Everyone wins.
"Netdata's significant positive impact" — LANCOM Systems
Compare vs Datadog, Grafana, Dynatrace
"Cut costs by 46%, staff by 67%" — Codyas
"Reduced cloud bill by 30%" — Falkland Islands Gov
"Better observability with Netdata than combining other tools." — TMB Barcelona
DPA, SLAs, on-prem, volume pricing
One command, 30 seconds, real data—no sandbox needed
Auto-config + per-node pricing = predictable profit
8-episode Netdata tutorial by LearnLinux.tv
3rd most starred monitoring project
Customers report 40-67% cost cuts, 99% downtime reduction
Free tier lets them try before they buy
AI Support Assistant, Available 24/7
Nedi has access to all official documentation, source code, and resources. Ask any question about Netdata—responds in your language.
Engineering Insights & Product Updates
Jun 2026
Network Monitoring, the Netdata Way: …
Interface counters tell you a port is busy. …
Jun 2026
5 Best SolarWinds Alternatives for 2026
As organizations modernize their …
Jun 2026
SolarWinds Price Increases 2026: What …
If you’re a SolarWinds customer facing …
May 2026
High-cardinality metrics at scale: why …
The “high cardinality is …
Never Fight Fires Alone
Docs, community, and expert help—pick your path to resolution.
60 Seconds to First Dashboard
One command to install. Zero config. 850+ integrations documented.
Level Up Your Monitoring
76,000+ Engineers Strong
Per-Second. 90% Cheaper. Data Stays Home.
See why teams switch from Datadog, Prometheus, Grafana, and more.
> Browse all comparisonsTrace issues directly in the source code
Get architecture recommendations
One of the most popular open-source monitoring projects
Enterprise-grade security and compliance
Your metrics stay on your infrastructure
"Most energy-efficient monitoring solution" — ICSOC 2023, peer-reviewed
"Doesn't miss alerts—mission-critical trust for safety software"
Global community improving monitoring for everyone
Trusted by teams worldwide
Free forever, fully open source agent
Work from anywhere, async-friendly culture
Your work helps millions of systems
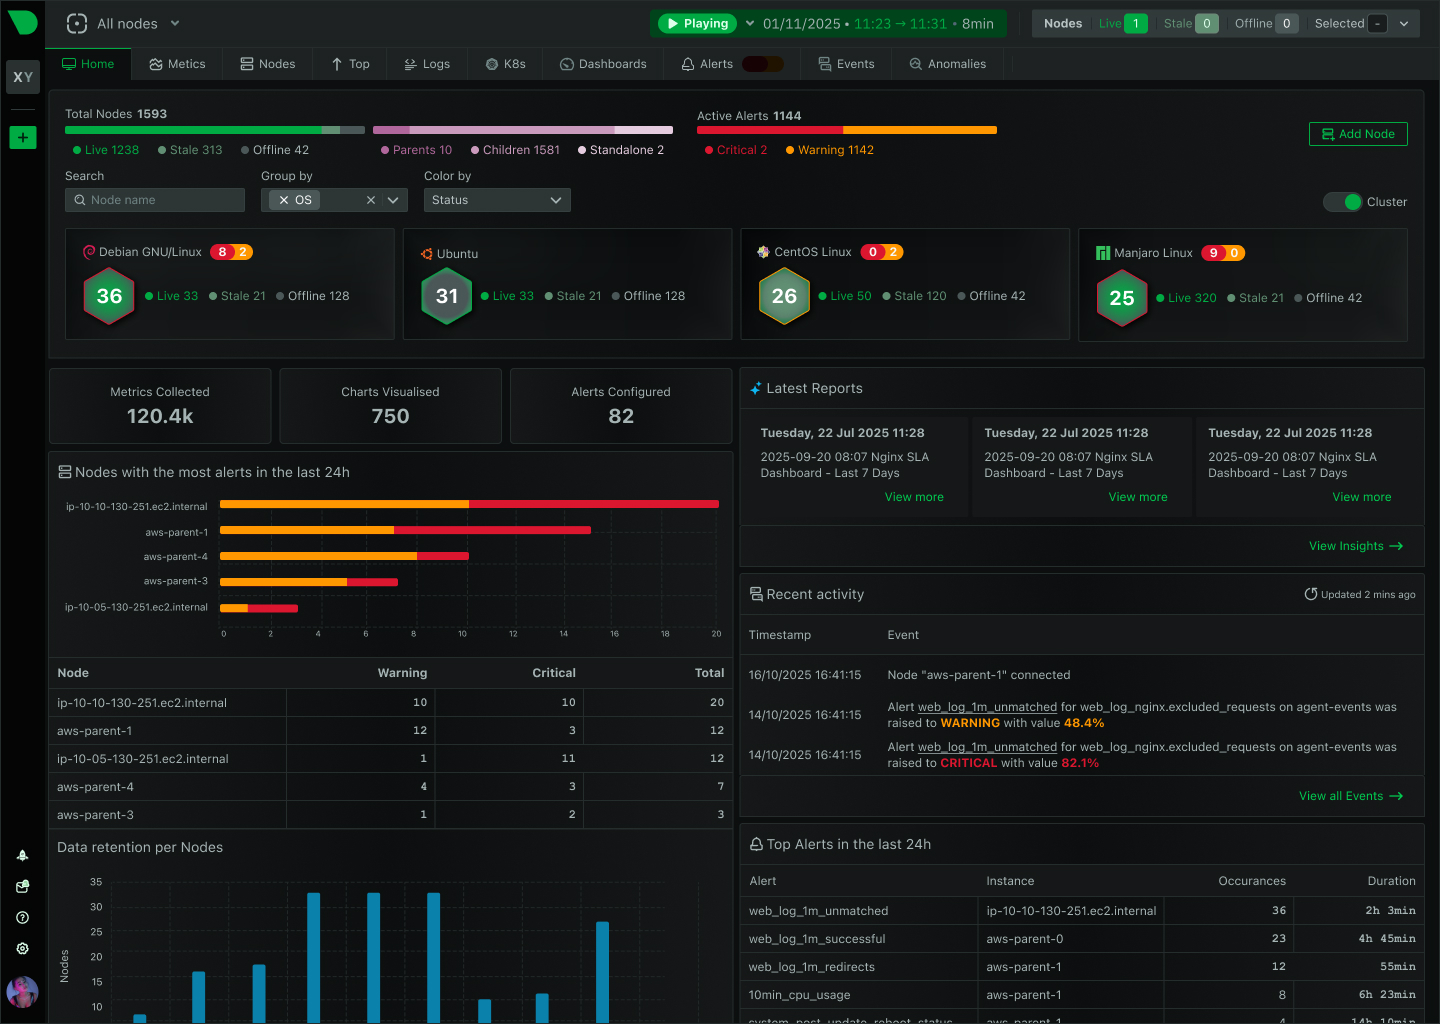
Netdata’s distributed edge-native architecture delivers 90% cost reduction and 80% faster MTTR across distributed client fleets. Each client streams to its own isolated Parent - true physical multi-tenancy - while you manage every estate from one view, with zero-configuration deployment and predictable per-node P90 billing.
The only monitoring platform designed from the ground up for managed service providers
P90 billing excludes spikes and top 3 days per month. Unlimited metrics, logs, and users at predictable per-node pricing - no surprise bills, no volume charges.
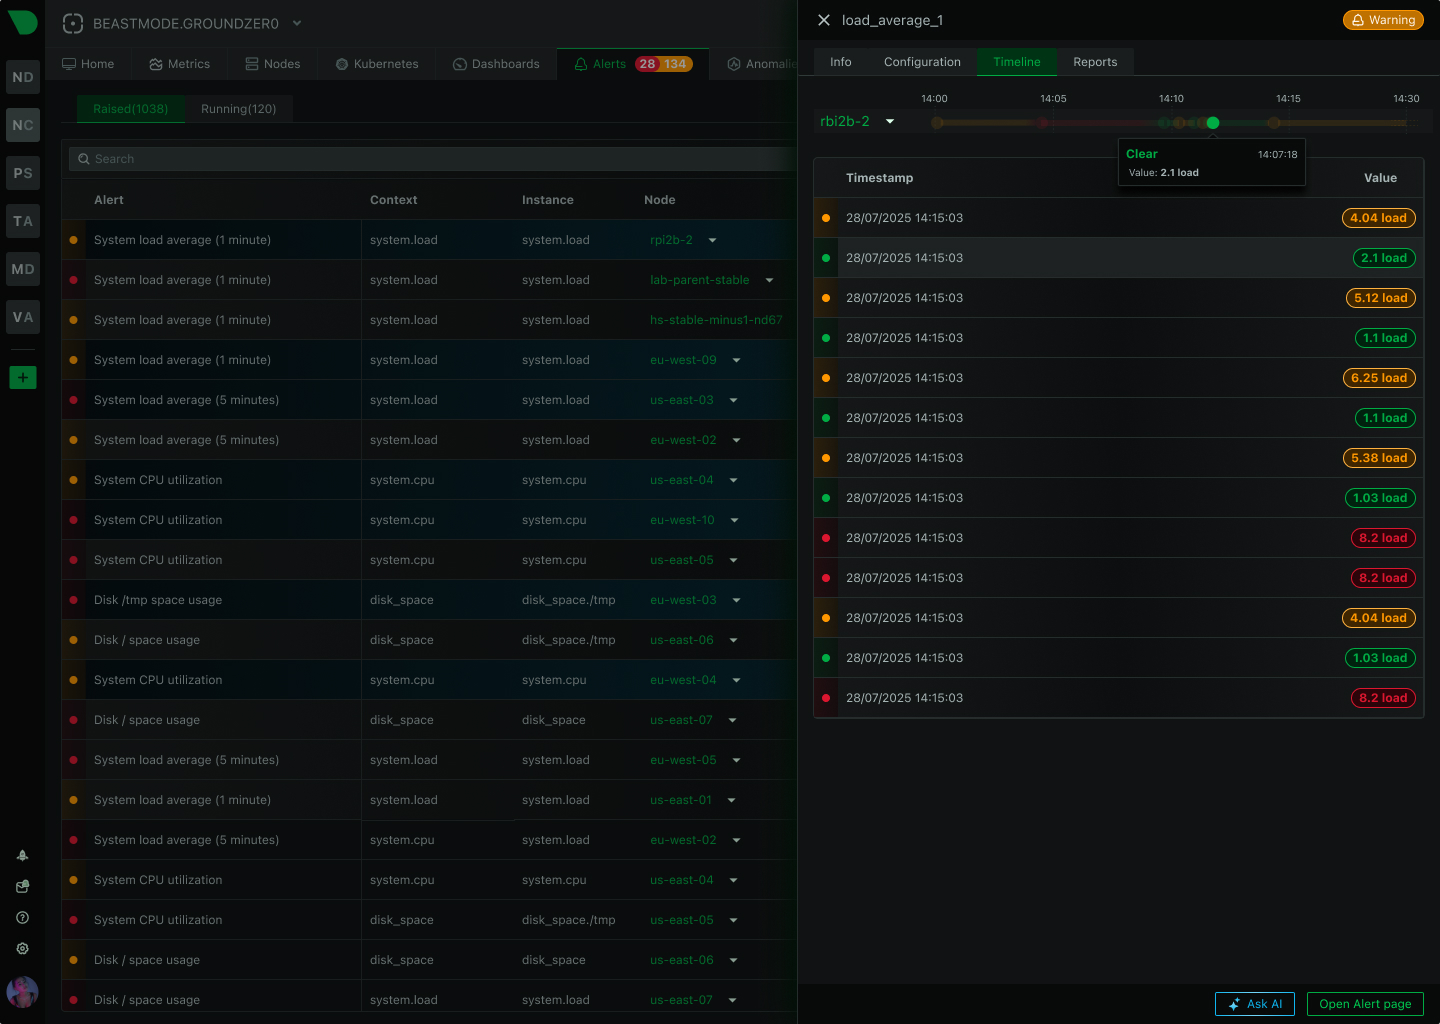
True 1-second real-time monitoring detects issues instantly. Anomaly Advisor surfaces root cause in top 30-50 results within seconds for rapid resolution.
Spaces provide true customer isolation with independent billing, RBAC, and data sovereignty. Each customer’s metrics stay on their infrastructure - never commingled.
One-line installation with zero configuration. Auto-discovers 800+ integrations, generates algorithmic dashboards, and starts ML training immediately - no manual setup required.
400+ pre-configured component-level alerts with hysteresis protection and rolling window thresholds provide precise notifications - only actionable alerts reach your team.
Same architecture from 10 to 10,000 nodes. Distributed edge processing means adding customers doesn’t degrade performance - each node operates independently.
Trusted by MSPs and enterprises worldwide
5 tools → 1 platform
See Platform Overview
100% data isolation
Learn About Multi-Tenancy
Predictable per-node pricing
See Pricing Details
10-60× faster than competitors
Understand Real-Time
99% false positive reduction
Explore ML Capabilities
60 seconds to production
See Quick Start Guide
Why MSPs Choose Netdata
Traditional monitoring platforms weren’t designed for multi-tenant environments. Netdata’s distributed edge-native architecture solves the fundamental challenges MSPs face - delivering superior capabilities at a fraction of the cost.
Capability
Netdata
Traditional Monitoring
Data Granularity
Resolution of collected metrics
✅ 1-second
True real-time, no sampling
⚠️ 15-60 seconds
Near real-time, averaged data
Total Latency
Event to insight time
✅ 1-2 seconds
Sub-2-second worst case
⚠️ 20-120 seconds
Minutes during incidents
Multi-Tenancy
Customer isolation model
✅ Physical (Spaces)
True infrastructure separation
⚠️ Logical (Tags)
Shared infrastructure, filtered views
Pricing Model
Cost structure
✅ Per-node, P90
Predictable pricing, excludes spikes
❌ Volume-based
Per-metric, per-GB, unpredictable
Deployment Time
Installation to production
✅ 60 seconds
One-line, zero configuration
❌ Hours to days
Extensive setup required
ML Anomaly Detection
Automated issue detection
✅ 18 models/metric
Edge-based, zero configuration
⚠️ Cloud-based
Manual tuning, delayed results
Alert Configuration
Alert setup approach
✅ Intelligent
Component-level, hysteresis, rolling windows
⚠️ Basic
Fixed thresholds, manual tuning required
Data Sovereignty
Where metrics are stored
✅ Customer infrastructure
On-premises, compliant by design
❌ Vendor cloud
Centralized, compliance challenges
Logs Management
Log collection approach
✅ Zero pipeline
Direct journal access, 90% cost reduction
❌ Ingestion pipeline
Ship, parse, index, expensive
Scalability Model
How system scales
✅ Linear
Distributed, no bottlenecks
❌ Exponential complexity
Centralized, performance degrades
Dashboard Creation
Visualization setup
✅ Automatic
Algorithmic, zero effort
❌ Manual
Hours per dashboard, PromQL required
Cost Predictability
Total cost of ownership
✅ Predictable
Per-node pricing, no surprises
❌ Variable
Volume-based, unpredictable
Eliminate Prometheus, Grafana, Elasticsearch, AlertManager, and SSH with Netdata's unified observability platform. Reduce complexity by 80% with predictable per-node pricing and deploy in 60 seconds instead of weeks.
Consolidate 5+ tools into one platform
See Platform Architecture400+ pre-configured alerts with hysteresis protection and rolling window thresholds deliver precise notifications. Component-level alerting ensures you get actionable signals about specific infrastructure components - not generic threshold breaches.
Actionable alerts, not noise
Explore AlertingTransparent per-node pricing with P90 methodology excludes daily spikes and top 3 days per month. Unlimited metrics, logs, and users mean no surprise charges. Simple, predictable costs that scale linearly with your infrastructure.
No hidden fees, no volume charges
See Pricing DetailsSpaces provide complete infrastructure separation per customer - not just logical filtering. Independent P90 billing per Space enables direct customer invoicing. Data sovereignty ensures metrics never leave customer infrastructure, meeting compliance requirements automatically.
100% data isolation, zero cross-contamination
Learn About SpacesTrue 1-second real-time monitoring with sub-2-second latency provides immediate feedback. Anomaly Advisor surfaces root cause in top 30-50 results within seconds. AI Co-Engineer explains issues in plain language with recommended actions.
From hours to minutes
See AI FeaturesThe distributed edge-native architecture delivers capabilities traditional monitoring platforms can’t match
1-second data collection with sub-2-second total latency. See problems as they happen, not minutes later - critical for catching transient issues and microbursts invisible to averaged monitoring.
Spaces provide true infrastructure separation per customer with independent billing and complete data sovereignty. Metrics never leave customer infrastructure - compliance by design.
Per-node pricing excludes daily spikes and top 3 days per month. Unlimited metrics, logs, and users mean no surprise charges - predictable costs that scale linearly.
One-line installation with zero configuration. Auto-discovers 800+ integrations, generates dashboards, and starts ML training immediately - 100× faster than traditional setup.
Unsupervised machine learning on every metric with consensus-based detection achieves 99% false positive reduction in anomaly detection. Edge-based processing means no cloud dependency or latency.
Distributed architecture scales from 10 to 10,000 nodes without performance degradation. Each node operates independently - adding customers doesn’t create bottlenecks.
800+ auto-discovered integrations provide comprehensive coverage across infrastructure, applications, containers, and cloud services - no blind spots, no manual configuration.
Anomaly Advisor surfaces root cause in top 30-50 results. AI Co-Engineer explains issues in plain language with recommended actions - reducing investigation time from hours to minutes.
Enterprise-grade security and compliance built-in. Continuous monitoring for ISO 27001 controls, automated evidence collection, and audit logs - compliance without the overhead.
June 24, 2026
Netdata has added NPM-class network monitoring: live topology maps, NetFlow and sFlow traffic analysis, SNMP device and trap monitoring, and a dedicated network dashboard, all unified with your full-stack observability and processed at the edge.
June 23, 2026
Discover the top SolarWinds alternatives for 2026. Compare modern monitoring platforms built for cloud-native infrastructure - now with NPM-class network monitoring - with transparent pricing and real-time insights.
June 23, 2026
Understanding SolarWinds' subscription-only pricing changes following the Turn/River Capital acquisition, and exploring your options for infrastructure monitoring.
Yes. Netdata is built for distributed fleets - thousands of Linux endpoints spread across client sites on unreliable networks. Each node keeps its own per-second data and streams to a Parent near the fleet, so monitoring survives flaky links and scales without a central bottleneck. See the distributed and edge fleet monitoring overview for the architecture.
Netdata provides physical multi-tenancy via Spaces - each customer gets complete infrastructure separation, not just logical filtering. Each Space has independent P90 billing, separate RBAC, and complete data sovereignty (metrics never leave customer infrastructure). Within each Space, you can create Rooms for logical organization by service, environment, or team. This architecture meets GDPR, HIPAA, and SOC 2 requirements automatically. Learn more about Spaces.
Everything. Unlimited metrics (no per-metric charges), unlimited logs (no ingestion fees), unlimited users (no per-seat charges), ML anomaly detection on all metrics, AI Co-Engineer capabilities, 400+ pre-configured alerts, algorithmic dashboards, and SOC 2 compliance. The only variable is the number of active nodes, calculated using P90 methodology (excludes daily spikes and top 3 days per month). No hidden fees, no surprise bills. See detailed pricing.
60 seconds per node with zero configuration required. One-line installation auto-discovers 800+ integrations, generates algorithmic dashboards, configures 400+ alerts, and starts ML training immediately. For a typical 100-node customer, full observability is operational in 10 minutes using Ansible/Terraform automation. Compare this to hours or days with traditional monitoring platforms. See quick start guide.
No - Netdata complements RMM tools. Netdata excels at deep observability (metrics, logs, ML, AI troubleshooting) but doesn’t provide patch management or desktop remote control. The recommended stack is: Netdata for monitoring + RMM (NinjaOne, Kaseya, N-able) for patching + EDR (CrowdStrike, SentinelOne) for security. Netdata integrates via webhooks to your PSA for ticketing. This separation of concerns delivers better results than all-in-one tools. See integration options.
P90 billing protects you from spike-based overcharges. We calculate billable nodes using 90th percentile at two levels: (1) Daily - excludes brief spikes during the day, and (2) Monthly - excludes your top 3 daily values. Example: If you run 10 nodes for 23 hours and spike to 100 nodes for 1 hour, we bill for 10 nodes that day. If you have 3 days of load testing at 50 nodes in a 30-day month, those 3 days don’t inflate your bill. You’re billed for sustained usage, not peaks. See pricing details.
Netdata provides 100× faster deployment with superior performance. While Prometheus + Grafana requires extensive YAML configuration, manual dashboard building, and PromQL expertise, Netdata works instantly with zero configuration. Netdata benchmark at 4.6M metrics/second shows: 36% less CPU, 88% less RAM, 97% less disk I/O, 15× longer retention, and 16× faster queries. Plus, Netdata includes ML anomaly detection, logs management, and AI troubleshooting - all built-in. See detailed comparison.
Netdata is SOC 2 Type 2 certified and provides continuous monitoring for ISO 27001 controls (A.8 Asset Management, A.9 Access Control, A.12 Operations Security, A.17 Business Continuity). Data sovereignty is built-in - metrics never leave customer infrastructure, meeting GDPR, HIPAA, and regional requirements automatically. Audit logs, evidence automation, and compliance dashboards reduce manual evidence gathering significantly. BAAs available for HIPAA-aligned deployments. Learn about security.
Yes - linear scalability is built into the architecture. The distributed edge-native design means adding nodes doesn’t degrade performance. Each node operates independently, processing its own data with local ML. For centralization, deploy Parent clusters (recommended: 1 cluster per 500 nodes). The same architecture that works for 10 nodes works for 10,000 nodes - no redesign required. Organizations routinely run Netdata at 100,000+ node scale. See scalability details.
Business plan includes ticket-based support during business hours with SLA guarantees. Community support via GitHub discussions and Discord is available for all users. Enterprise On-Premise customers get 24/7 availability with dedicated support teams and custom SLAs. Professional services available for implementation assistance, architecture design, and migration support. Contact sales for enterprise support options.
18 unsupervised k-means models per metric train automatically at the edge. Each model uses different time windows (6-hour training, 3-hour staggered intervals). Consensus-based detection requires ALL 18 models to agree before flagging an anomaly - achieving 99% false positive reduction in anomaly detection. Training happens continuously every 3 hours as low-priority background tasks. Zero configuration required - works out of the box for all metrics. ML anomaly detection is a separate signal for investigation, independent from threshold-based alerting. Learn about ML.
MSPs can achieve significant ROI based on operational efficiency gains. Revenue opportunity: Charge customers industry-standard rates while benefiting from Netdata’s predictable per-node pricing - enabling healthy margins. Operational savings: 80% faster MTTR, reduced tool management overhead, faster customer onboarding. The combination of predictable costs, reduced complexity, and improved service delivery creates compelling economics for MSPs.
Yes - native Windows support with comprehensive system metrics, IIS, SQL Server, Active Directory monitoring, plus full Windows Event Logs, ETW, and TraceLogging integration. Windows support is newer (added 2024) but improving rapidly. Linux support is more mature with additional capabilities like eBPF monitoring. Both platforms use the same unified dashboard and ML capabilities. See Windows monitoring.
Zero-pipeline architecture delivers 90% cost reduction vs Elasticsearch/Splunk. Netdata queries systemd-journal files directly where they live - no shipping, no parsing, no indexing infrastructure. Every field in every log entry is automatically indexed by journald. Analyzes 1M entries before sampling vs 5K for traditional tools (200× more accurate). Windows Event Logs supported natively. Logs correlate directly with metrics from same source - no timestamp matching required. Learn about logs.
Yes - 14-day free trial with unlimited nodes. No credit card required. Full access to all Business plan features including multi-tenancy (Spaces), ML anomaly detection, AI Co-Engineer, and SOC 2 compliance. Deploy on your infrastructure in 60 seconds and evaluate with real customer workloads. Start free trial or see live demo.
800+ auto-discovered integrations including all major infrastructure components (Linux, Windows, FreeBSD, macOS), containers (Docker, Kubernetes, LXC), databases (MySQL, PostgreSQL, MongoDB, Redis), web servers (NGINX, Apache, IIS), message queues (RabbitMQ, Kafka), cloud APIs (AWS, Azure, GCP), and network devices (SNMP). OpenTelemetry support for metrics and logs (traces planned for Q2 2026). Exports to Prometheus, InfluxDB, Graphite, OpenTSDB. Webhook alerts to any PSA. See all integrations.