 |
VOOZH | about |
|
VOOZH | about |
The only agent that thinks for itself
Autonomous Monitoring with self-learning AI built-in, operating independently across your entire stack.
Centralized metrics streaming and storage
Aggregate metrics from multiple agents into centralized Parent nodes for unified monitoring across your infrastructure.
Fully managed cloud platform
Access your monitoring data from anywhere with our SaaS platform. No infrastructure to manage, automatic updates, and global availability.
Deploy Netdata Cloud in your infrastructure
Run the full Netdata Cloud platform on-premises for complete data sovereignty and compliance with your security policies.
Powerful, intuitive monitoring interface
Modern, responsive UI built for real-time troubleshooting with customizable dashboards and advanced visualization capabilities.
Monitor on the go
Native iOS and Android apps bring full monitoring capabilities to your mobile device with real-time alerts and notifications.
The future of infrastructure observability
See our strategic direction across AI-native observability, full-stack signals, operational intelligence, and enterprise platform maturity.
Best energy efficiency
True real-time per-second
100% automated zero config
Centralized observability
Multi-year retention
High availability built-in
Zero maintenance
Always up-to-date
Enterprise security
Complete data control
Air-gap ready
Compliance certified
Millisecond responsiveness
Infinite zoom & pan
Works on any device
Native performance
Instant alerts
Monitor anywhere
AI-native observability
Continuous delivery
Open source foundation
80% Faster Incident Resolution
True Real-Time and Simple, even at Scale
90% Cost Reduction, Full Fidelity
See and Map Your Entire Network
Single Pane of Glass
Control Without Surrender
Integrations
800+ collectors and notification channels, auto-discovered and ready out of the box.
Reduced monitoring costs by 46% while cutting staff overhead by 67%.
— Leonardo Antunez, Codyas
No data shipping. No central storage costs. Query at the edge.
So many out-of-the-box features! I mostly don't have to develop anything.
— Simon Beginn, LANCOM Systems
Point-and-click troubleshooting. No PromQL, no LogQL, no learning curve.
Enterprise efficiency without enterprise complexity—real ROI from day one.
— Leonardo Antunez, Codyas
Zero data egress. Only metadata reaches the cloud. Your metrics stay on your infrastructure.
Auto-discovered and configured. No manual setup required.
Slack, PagerDuty, Teams, email, webhooks—all built-in.
Built for the People Who Get Paged
Every Industry Has Rules. We Master Them.
Monitor Any Technology. Configure Nothing.
Complete Visibility. Total Control.
Don't Take Our Word for It
Netdata gives more than you invest in it. A rare unicorn that obeys the Pareto rule.
— Eduard Porquet Mateu, TMB Barcelona
Reduced website downtime by 99% and cloud bill by 30% using Netdata alerts.
— Falkland Islands Government
Optimized resource allocation based on Netdata alerts cut cloud spending by 30%.
— Falkland Islands Government
Reduced monitoring staff by 67% while cutting operational costs by 46%.
— Codyas
Netdata has agent capacity or a plugin for everything, including Windows and Kubernetes.
— Eduard Porquet Mateu, TMB Barcelona
So many out-of-the-box features! I mostly don't have to develop anything.
— Simon Beginn, LANCOM Systems
From 2-3 minutes to 30 seconds—instant visibility into any node issue.
— Matthew Artist, Nodecraft
20% less downtime and 40% budget optimization from out-of-the-box monitoring.
— Simon Beginn, LANCOM Systems
Pay per Node. Unlimited Everything Else.
One price per node. Unlimited metrics, logs, users, and retention. No per-GB surprises.
What's Your Monitoring Really Costing You?
Most teams overpay by 40-60%. Let's find out why.
Your Infrastructure Is Unique. Let's Talk.
Because monitoring 10 nodes is different from monitoring 10,000.
Monitoring That Sells Itself
Deploy in minutes. Impress clients in hours. Earn recurring revenue for years.
Per-Second Metrics at Homelab Prices
Same engine, same dashboards, same ML. Just priced for tinkerers.
$1,000 Per Referral. Unlimited Referrals.
Your colleagues get 10% off. You get 10% commission. Everyone wins.
"Netdata's significant positive impact" — LANCOM Systems
Compare vs Datadog, Grafana, Dynatrace
"Cut costs by 46%, staff by 67%" — Codyas
"Reduced cloud bill by 30%" — Falkland Islands Gov
"Better observability with Netdata than combining other tools." — TMB Barcelona
DPA, SLAs, on-prem, volume pricing
One command, 30 seconds, real data—no sandbox needed
Auto-config + per-node pricing = predictable profit
8-episode Netdata tutorial by LearnLinux.tv
3rd most starred monitoring project
Customers report 40-67% cost cuts, 99% downtime reduction
Free tier lets them try before they buy
AI Support Assistant, Available 24/7
Nedi has access to all official documentation, source code, and resources. Ask any question about Netdata—responds in your language.
Engineering Insights & Product Updates
Jun 2026
Network Monitoring, the Netdata Way: …
Interface counters tell you a port is busy. …
Jun 2026
5 Best SolarWinds Alternatives for 2026
As organizations modernize their …
Jun 2026
SolarWinds Price Increases 2026: What …
If you’re a SolarWinds customer facing …
May 2026
High-cardinality metrics at scale: why …
The “high cardinality is …
Never Fight Fires Alone
Docs, community, and expert help—pick your path to resolution.
60 Seconds to First Dashboard
One command to install. Zero config. 850+ integrations documented.
Level Up Your Monitoring
76,000+ Engineers Strong
Per-Second. 90% Cheaper. Data Stays Home.
See why teams switch from Datadog, Prometheus, Grafana, and more.
> Browse all comparisonsTrace issues directly in the source code
Get architecture recommendations
One of the most popular open-source monitoring projects
Enterprise-grade security and compliance
Your metrics stay on your infrastructure
"Most energy-efficient monitoring solution" — ICSOC 2023, peer-reviewed
"Doesn't miss alerts—mission-critical trust for safety software"
Global community improving monitoring for everyone
Trusted by teams worldwide
Free forever, fully open source agent
Work from anywhere, async-friendly culture
Your work helps millions of systems
Monitor every process, container, and system call from installation. No code changes. No application restarts. No SDK installation. Complete infrastructure observability in 60 seconds.
Complete visibility from kernel to application
60 seconds from installation to complete infrastructure visibility. Zero configuration required.
Every process monitored automatically - system daemons, applications, containers, shell scripts - regardless of language.
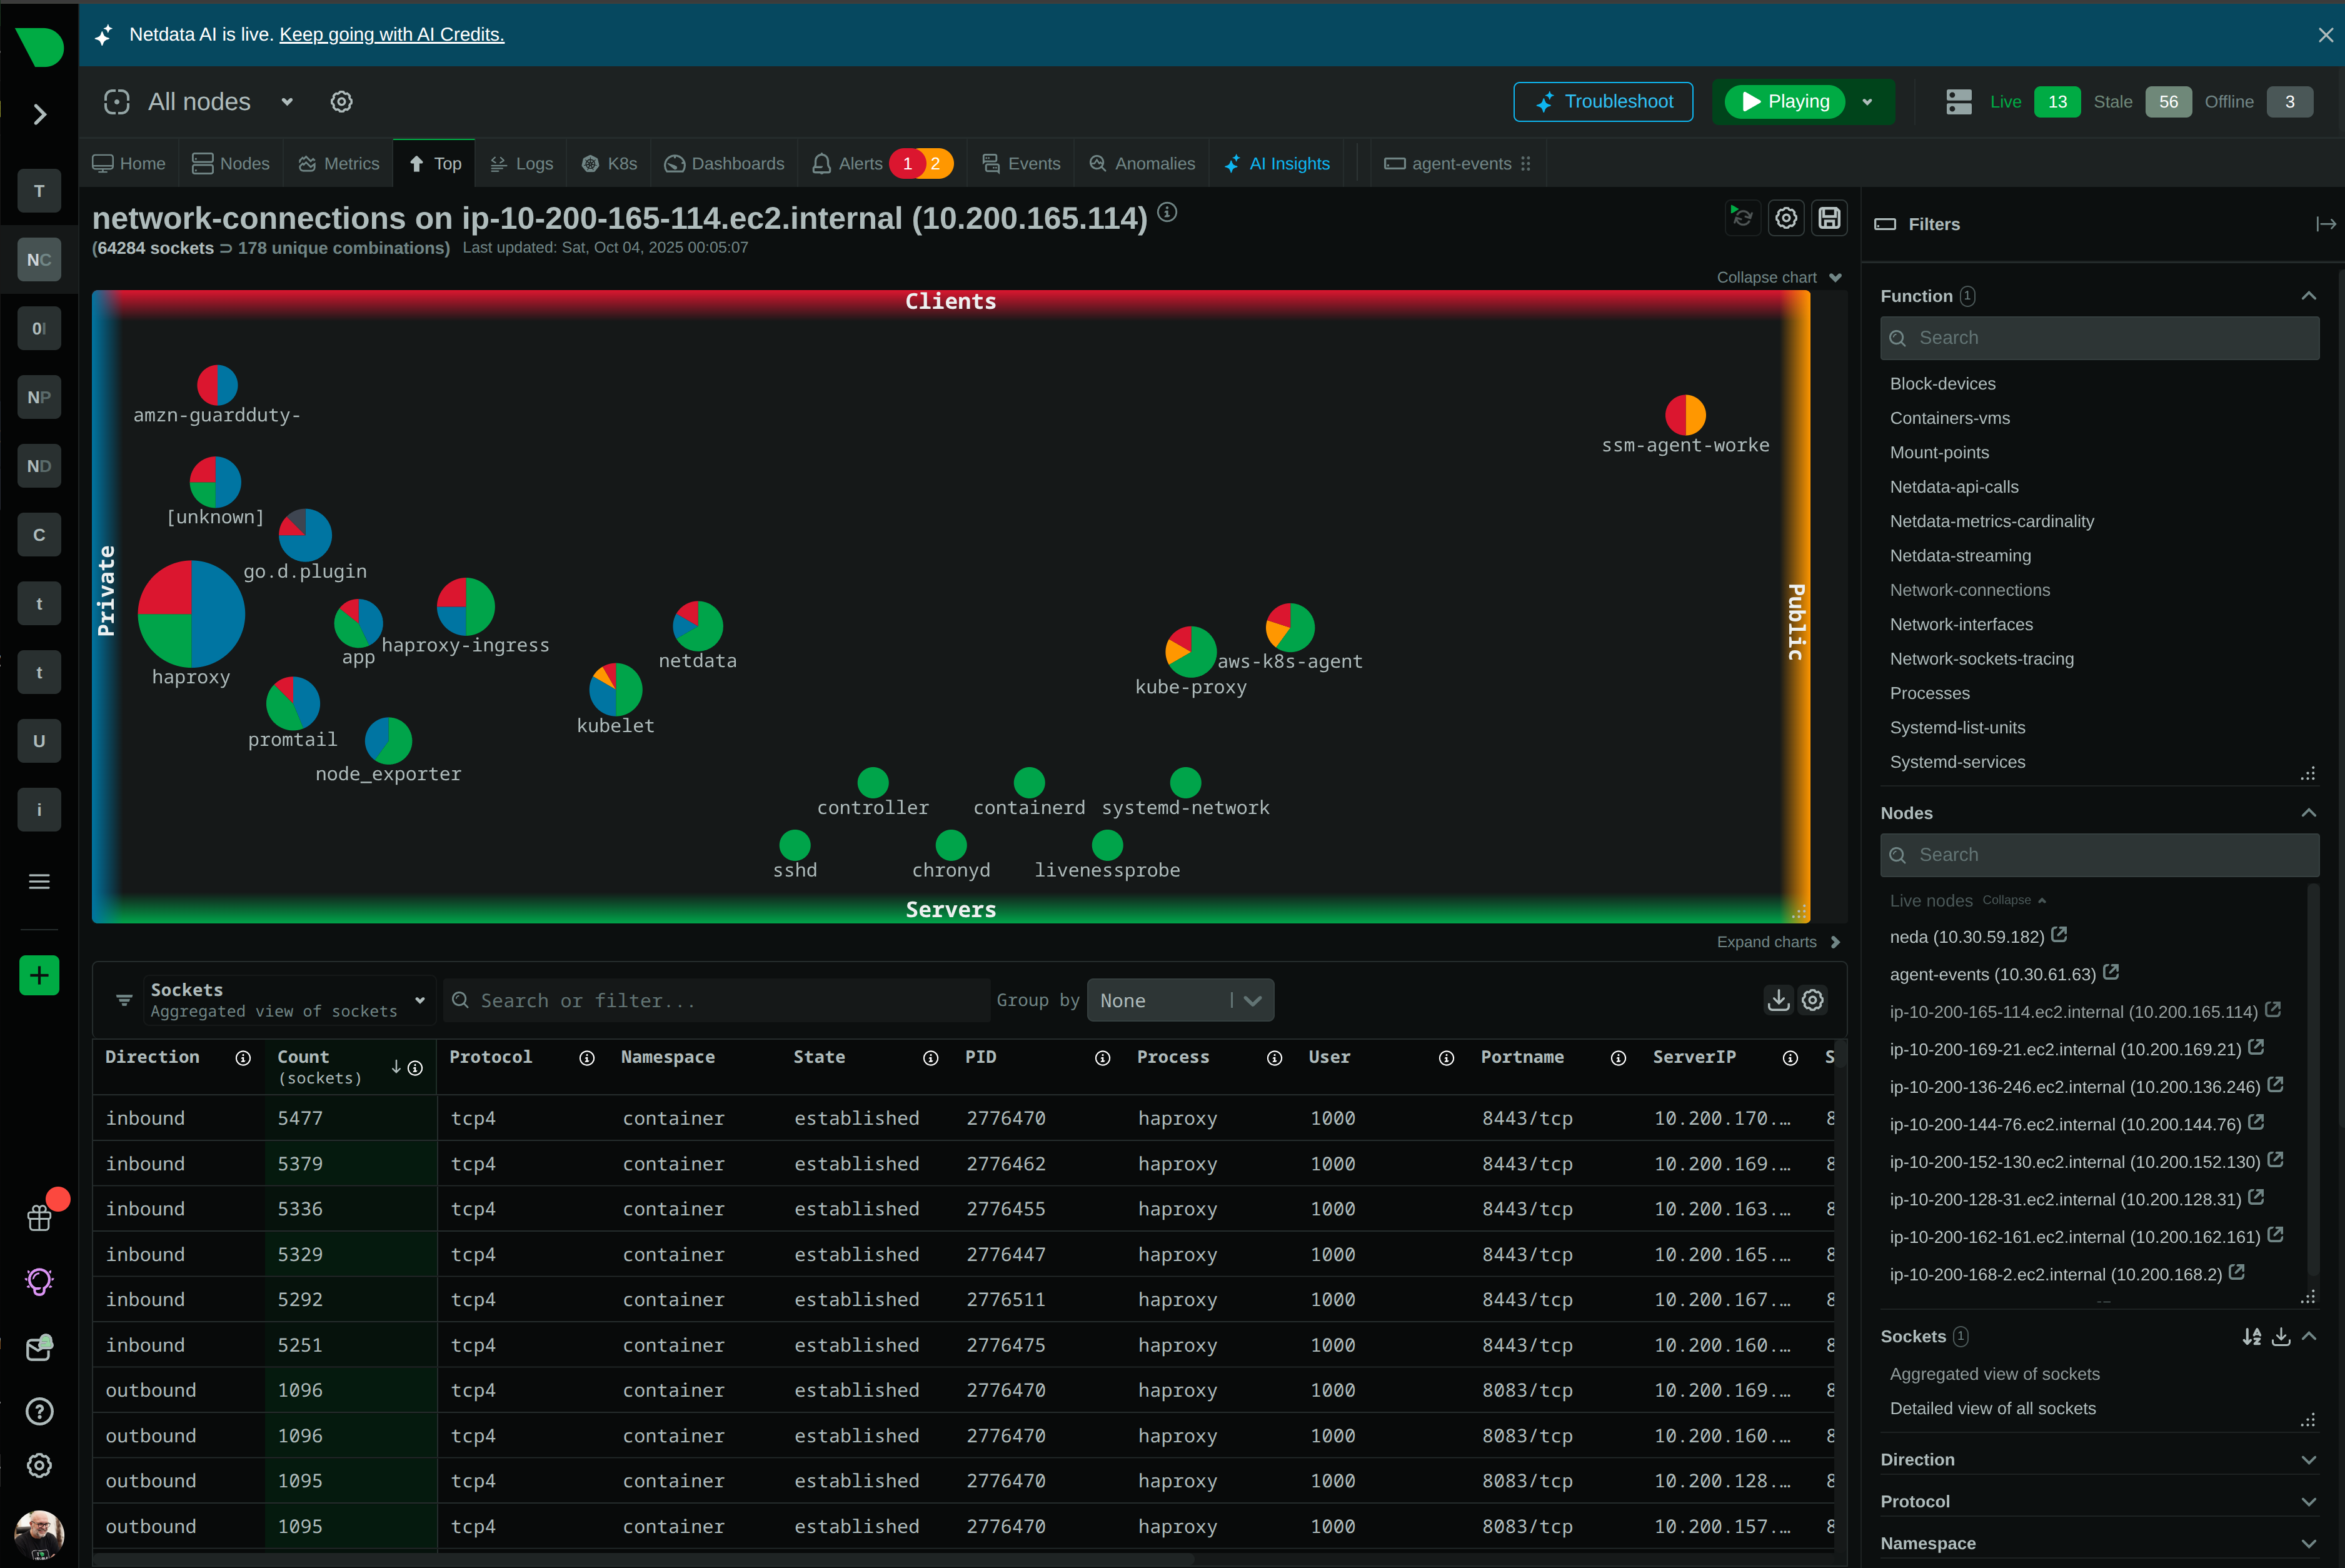
eBPF instrumentation reveals syscalls, network operations, and filesystem activity without touching application code.
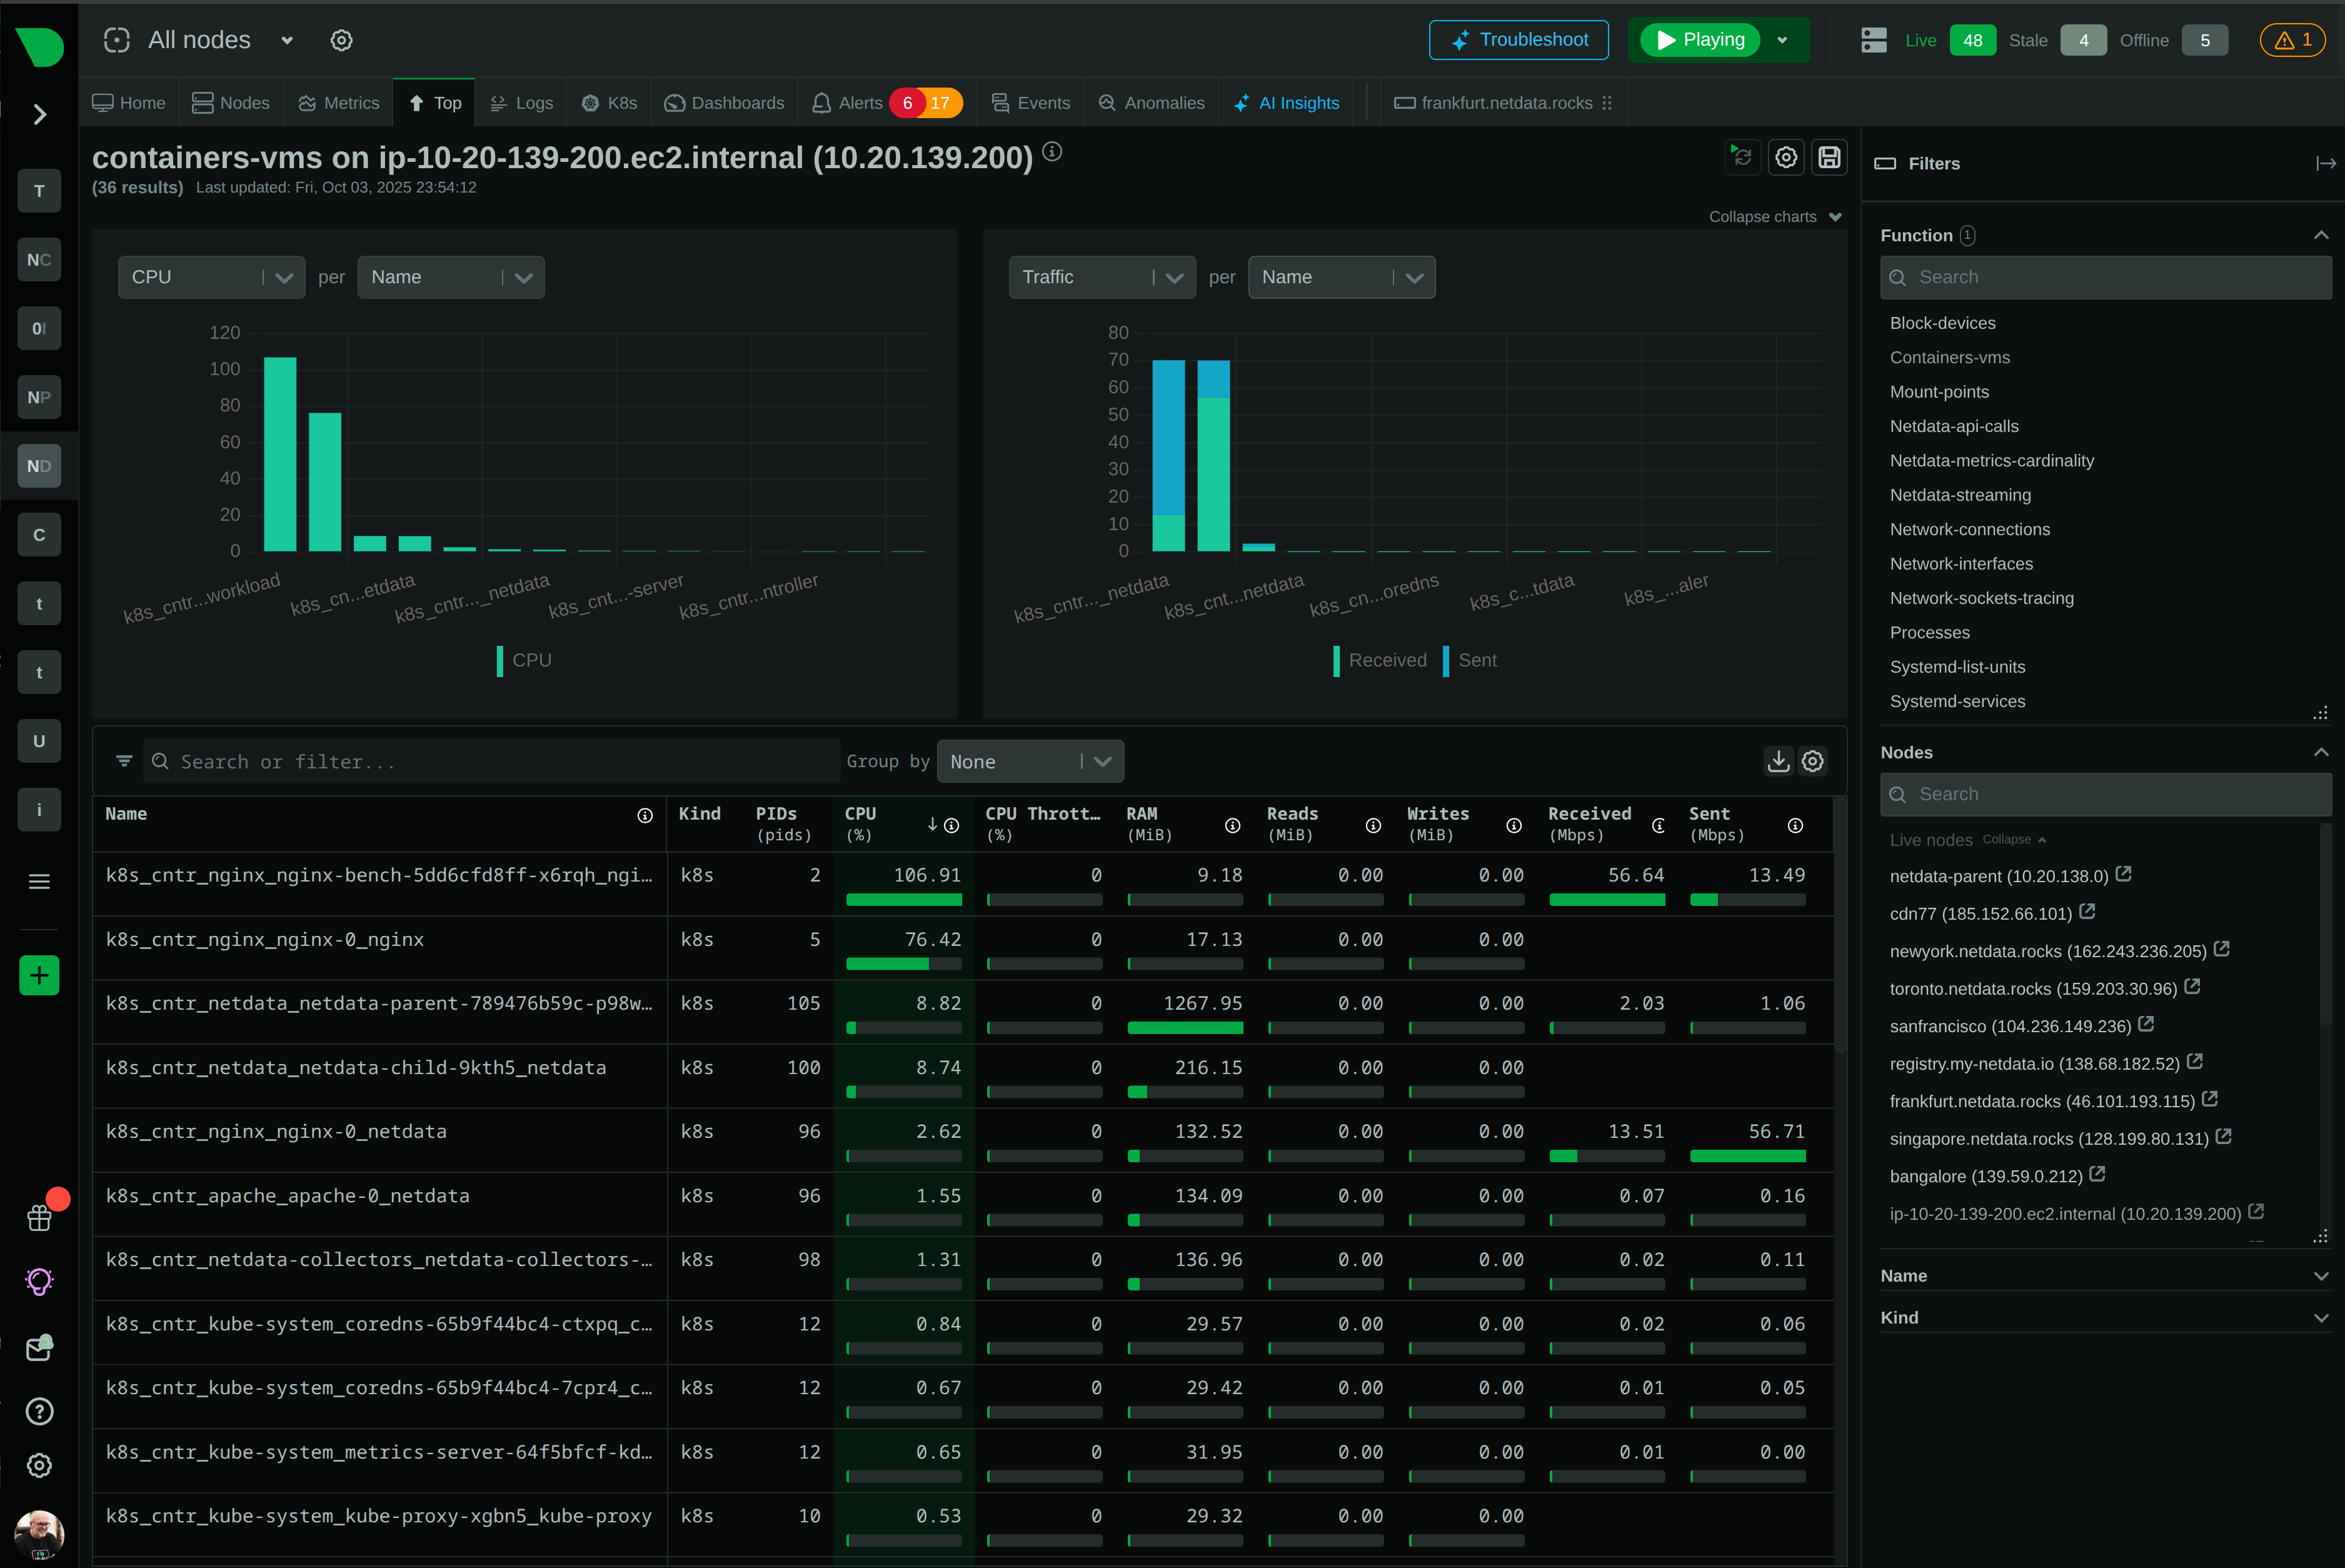
Automatic discovery and monitoring of Docker, Kubernetes, LXC containers with resource accounting and lifecycle tracking.
Direct systemd-journal and Windows Event Log access eliminates shipping infrastructure while maintaining full indexing.
Infrastructure changes detected automatically - new services, containers, and processes monitored without configuration updates.
Trusted by operations teams managing complex infrastructure
3,000-20,000 metrics/sec per node
Learn about process monitoring
<1% CPU overhead typical
Explore eBPF capabilities
800+ integrations
View all integrations
Per-second container metrics
Container monitoring details
200× query accuracy
Zero-pipeline logs explained
Dozens of console tools unified
Explore Netdata Functions
Zero-Code Reality Check
Netdata provides genuinely zero-code infrastructure observability - no application restarts, no SDK installation, no language limitations. Application-focused tools require instrumentation despite zero-code claims.
Capability
Netdata
Application APM Tools
Application code changes
✅ Zero
Literally no code modifications required
✅ Zero
But requires agent installation and restart
Application restarts required
✅ Not Required
Monitor running processes without interruption
⚠️ Required
Agent installation requires application restart
Language/runtime limitations
✅ Universal
Works with any language or runtime
⚠️ Limited
Specific language agents required
Monitors uninstrumentable processes
✅ Advanced
System services, shell scripts, legacy apps
❌ Not Available
Only instrumented applications visible
Kernel-level visibility
✅ Advanced
eBPF syscalls, network, filesystem operations
❌ Not Available
Application-level metrics only
Short-lived process tracking
✅ Advanced
Shell scripts, cron jobs, subprocesses
⚠️ Limited
May miss ephemeral processes
Container monitoring independence
✅ Kernel-Based
cgroups accounting independent of runtime
⚠️ Runtime-Dependent
Requires container runtime integration
Log management approach
✅ Zero-Pipeline
Direct journal access, no shipping
⚠️ Pipeline-Based
Requires log shipping infrastructure
Time to first visibility
✅ 60 Seconds
Installation to complete infrastructure view
⚠️ Hours to Days
Configuration and integration required
Configuration required
✅ Zero
Auto-discovery and algorithmic dashboards
⚠️ Moderate
Service configuration and dashboard building
eBPF instrumentation attaches to internal kernel functions, capturing syscalls, network operations, filesystem I/O, and memory management for all processes. Runs on host only - does not run in containers or Kubernetes. Requires kernel 4.11+.
<1% CPU overhead typical
Learn about eBPF monitoringapps.plugin monitors every process automatically - system services, user applications, containers, interpreters, and shell scripts. Captures CPU, memory, disk I/O, network usage, and process tree relationships without process awareness or code changes.
Works with any language
Process monitoring detailscgroups.plugin monitors containers through kernel resource accounting - independent of container runtime. Tracks CPU throttling, memory limits, network bandwidth, disk I/O, and lifecycle events for Docker, Kubernetes, LXC, and Podman.
Per-second container metrics
Container monitoring guideNetwork listener scanning, Kubernetes Pod watching, Docker container detection, and SNMP device discovery work continuously. 800+ integrations auto-configure when services detected - databases, web servers, message brokers, cloud services.
800+ integrations
View all integrationssystemd-journal and Windows Event Log integration eliminates log shipping infrastructure. Every field automatically indexed by the OS - full-text search, field statistics, and histograms without parsing configuration or pipeline management.
90% cost reduction
Zero-pipeline logs explainedZero-code instrumentation delivers comprehensive infrastructure visibility instantly
60 seconds from installation to complete OS, kernel, process, container, network, and log monitoring without configuration.
No application code changes, no SDK installation, no language-specific agents, no application restarts required.
Track system services, shell scripts, legacy applications, and third-party software that cannot be instrumented.
eBPF reveals syscalls, network bandwidth per application, filesystem operations invisible to application monitoring.
Kernel-based cgroups accounting works regardless of container runtime - Docker, Kubernetes, LXC, Podman.
Direct journal access eliminates log shipping infrastructure while maintaining full indexing and 90% cost reduction.
Infrastructure changes detected automatically - new services, containers, processes monitored without configuration updates.
Works with any programming language, runtime, or framework without language-specific instrumentation.
Browser-based diagnostics eliminate SSH access requirements while maintaining complete troubleshooting capability.
June 24, 2026
Netdata has added NPM-class network monitoring: live topology maps, NetFlow and sFlow traffic analysis, SNMP device and trap monitoring, and a dedicated network dashboard, all unified with your full-stack observability and processed at the edge.
June 23, 2026
Discover the top SolarWinds alternatives for 2026. Compare modern monitoring platforms built for cloud-native infrastructure - now with NPM-class network monitoring - with transparent pricing and real-time insights.
June 23, 2026
Understanding SolarWinds' subscription-only pricing changes following the Turn/River Capital acquisition, and exploring your options for infrastructure monitoring.
Netdata provides complete infrastructure observability without any application code changes, SDK installation, or application restarts. We monitor processes, containers, networks, and logs through kernel-level instrumentation (eBPF), process tree analysis (apps.plugin), and direct log access (systemd-journal). This is genuinely zero-code - no modifications to your applications required.
Application APM tools require installing agents and restarting applications despite zero-code claims. They focus on application traces and require language-specific instrumentation. Netdata monitors infrastructure - OS, kernel, processes, containers, networks - without touching applications. We provide the foundation layer that APM tools assume exists. Use both for complete observability.
Yes. Netdata monitors any process regardless of whether you can modify it - system services, third-party applications, legacy software, shell scripts, interpreted languages. apps.plugin tracks resource usage for all processes, eBPF captures kernel-level behavior, and auto-discovery detects services automatically.
Minimal. Netdata uses <5% CPU and 150-200 MB RAM for standalone deployments. eBPF overhead is typically under 1% CPU. The University of Amsterdam study confirmed Netdata is the most energy-efficient monitoring solution despite collecting per-second data and running ML at the edge.
Netdata focuses on infrastructure observability - the foundation layer. For distributed tracing and code-level profiling, use application APM tools. Together you get complete visibility - Netdata for infrastructure, APM for application traces. OTLP trace ingestion planned for Q2 2026.
eBPF attaches to internal kernel functions without kernel modules, capturing syscalls, network operations, filesystem I/O, and memory management for all processes. Provides per-application attribution with minimal overhead. Requires Linux kernel 4.11+ and runs on host only - does not run inside containers or Kubernetes. Gracefully degrades if unavailable.
Yes for infrastructure-level monitoring. apps.plugin monitors any process automatically. For application-specific metrics (databases, web servers, message brokers), auto-discovery detects standard ports and services. Custom applications may require minimal configuration for service-specific metrics but process-level monitoring works immediately.
Netdata reads systemd-journal and Windows Event Log files directly from disk - no log shipping, no parsing, no indexing infrastructure. The OS automatically indexes every field in every log entry. We provide query interface, field statistics, and histograms. Eliminates 90% of traditional log platform costs.
Yes. cgroups.plugin monitors containers through kernel resource accounting - independent of what runs inside. Tracks CPU, memory, network, disk I/O, and lifecycle events for Docker, Kubernetes, LXC, Podman. eBPF provides additional kernel-level insights on the host. Application-specific metrics require service detection.
Minimal. Netdata auto-discovers infrastructure and generates dashboards automatically. Configuration needed only for services requiring authentication (databases, APIs), custom application metrics, retention settings, or advanced alert customization. Most deployments run with default configuration.
Netdata complements APM tools by providing infrastructure foundation they miss. Keep your APM for distributed tracing and code profiling. Add Netdata for kernel-level visibility, process monitoring, container tracking, and zero-pipeline logs. Many customers run both for complete observability.
Yes. Netdata monitors Windows processes, services, performance counters, and Event Logs without code changes. Windows Event Log integration provides zero-pipeline log management. eBPF is Linux-only but Windows monitoring works through native APIs and performance counters.
apps.plugin captures short-lived processes that exit before polling intervals - critical for shell scripts, cron jobs, CI/CD pipelines. Aggregates resource usage from exited processes. No data loss for ephemeral workloads or subprocess storms.
60 seconds from installation to complete infrastructure visibility. Auto-discovery detects services, algorithmic dashboards generate automatically, and ML begins training. First anomaly detection available after 15 minutes baseline. No configuration, dashboard building, or alert tuning required.
Netdata provides infrastructure observability without code changes. For custom business logic metrics (purchase completions, user engagement, financial transactions), manual instrumentation is required. Distributed tracing not yet available (planned Q2 2026). Code-level profiling requires APM tools.