 |
VOOZH | about |
|
VOOZH | about |
The only agent that thinks for itself
Autonomous Monitoring with self-learning AI built-in, operating independently across your entire stack.
Centralized metrics streaming and storage
Aggregate metrics from multiple agents into centralized Parent nodes for unified monitoring across your infrastructure.
Fully managed cloud platform
Access your monitoring data from anywhere with our SaaS platform. No infrastructure to manage, automatic updates, and global availability.
Deploy Netdata Cloud in your infrastructure
Run the full Netdata Cloud platform on-premises for complete data sovereignty and compliance with your security policies.
Powerful, intuitive monitoring interface
Modern, responsive UI built for real-time troubleshooting with customizable dashboards and advanced visualization capabilities.
Monitor on the go
Native iOS and Android apps bring full monitoring capabilities to your mobile device with real-time alerts and notifications.
The future of infrastructure observability
See our strategic direction across AI-native observability, full-stack signals, operational intelligence, and enterprise platform maturity.
Best energy efficiency
True real-time per-second
100% automated zero config
Centralized observability
Multi-year retention
High availability built-in
Zero maintenance
Always up-to-date
Enterprise security
Complete data control
Air-gap ready
Compliance certified
Millisecond responsiveness
Infinite zoom & pan
Works on any device
Native performance
Instant alerts
Monitor anywhere
AI-native observability
Continuous delivery
Open source foundation
80% Faster Incident Resolution
True Real-Time and Simple, even at Scale
90% Cost Reduction, Full Fidelity
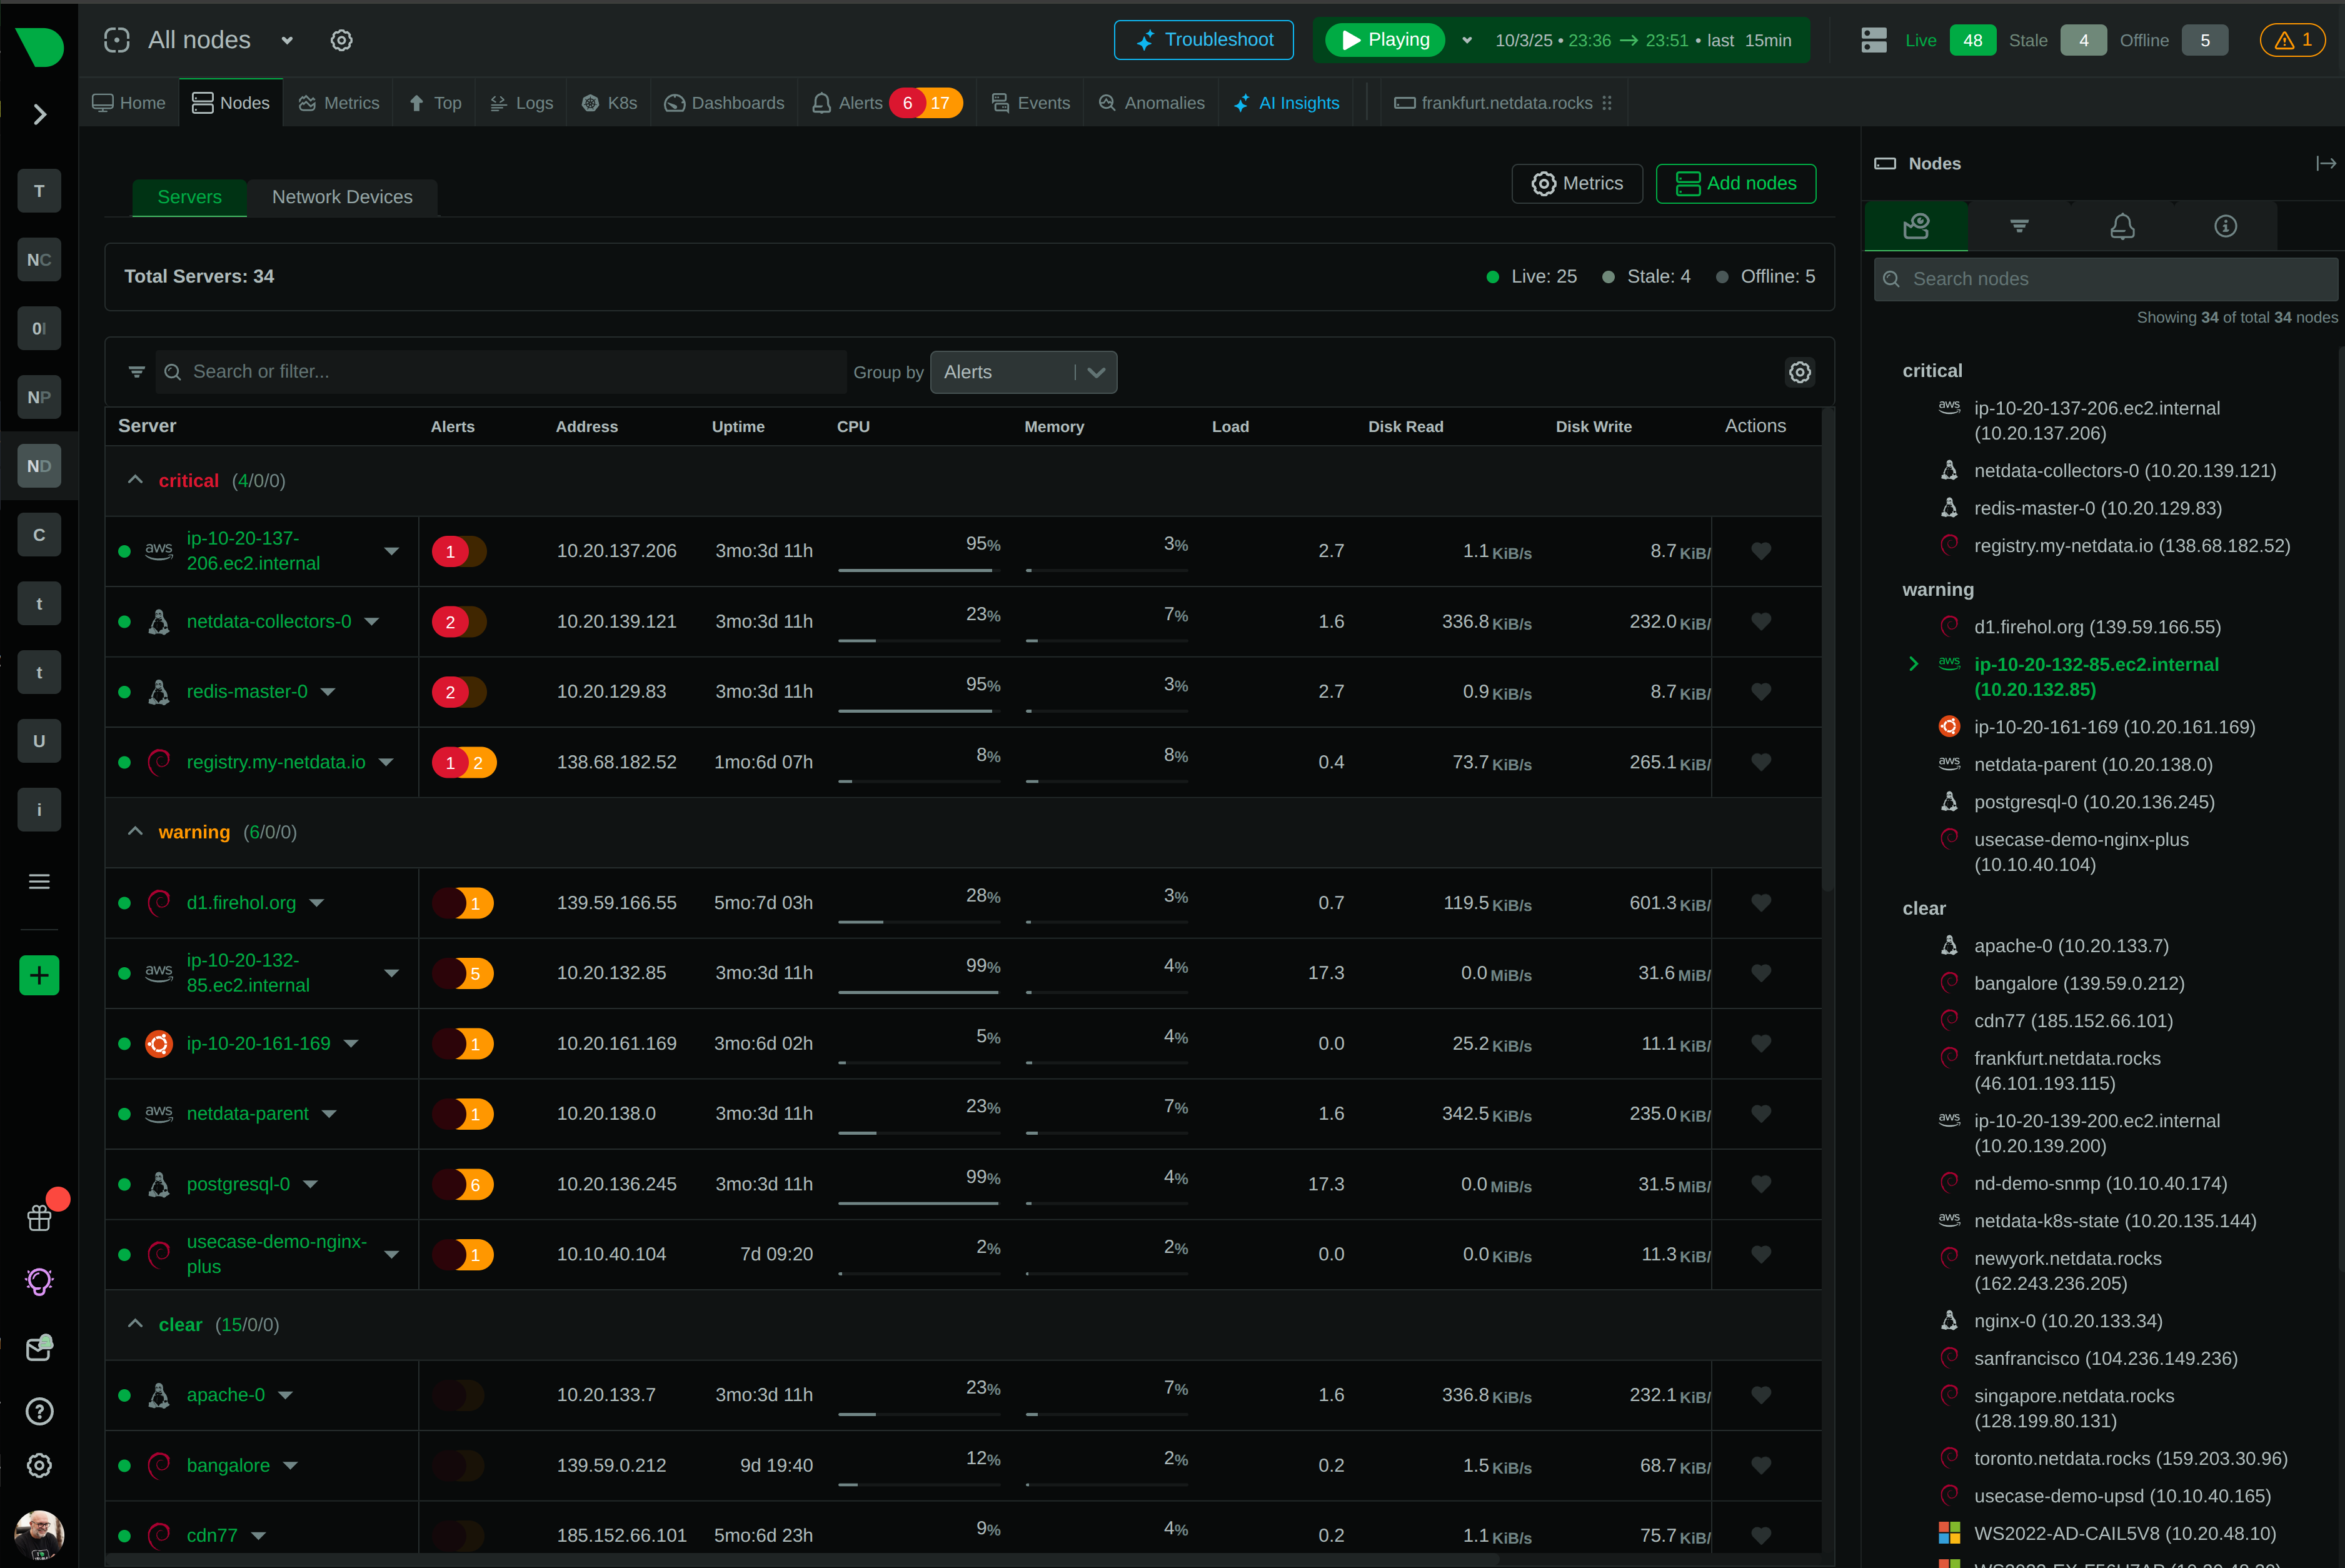
See and Map Your Entire Network
Single Pane of Glass
Control Without Surrender
Integrations
800+ collectors and notification channels, auto-discovered and ready out of the box.
Reduced monitoring costs by 46% while cutting staff overhead by 67%.
— Leonardo Antunez, Codyas
No data shipping. No central storage costs. Query at the edge.
So many out-of-the-box features! I mostly don't have to develop anything.
— Simon Beginn, LANCOM Systems
Point-and-click troubleshooting. No PromQL, no LogQL, no learning curve.
Enterprise efficiency without enterprise complexity—real ROI from day one.
— Leonardo Antunez, Codyas
Zero data egress. Only metadata reaches the cloud. Your metrics stay on your infrastructure.
Auto-discovered and configured. No manual setup required.
Slack, PagerDuty, Teams, email, webhooks—all built-in.
Built for the People Who Get Paged
Every Industry Has Rules. We Master Them.
Monitor Any Technology. Configure Nothing.
Complete Visibility. Total Control.
Don't Take Our Word for It
Netdata gives more than you invest in it. A rare unicorn that obeys the Pareto rule.
— Eduard Porquet Mateu, TMB Barcelona
Reduced website downtime by 99% and cloud bill by 30% using Netdata alerts.
— Falkland Islands Government
Optimized resource allocation based on Netdata alerts cut cloud spending by 30%.
— Falkland Islands Government
Reduced monitoring staff by 67% while cutting operational costs by 46%.
— Codyas
Netdata has agent capacity or a plugin for everything, including Windows and Kubernetes.
— Eduard Porquet Mateu, TMB Barcelona
So many out-of-the-box features! I mostly don't have to develop anything.
— Simon Beginn, LANCOM Systems
From 2-3 minutes to 30 seconds—instant visibility into any node issue.
— Matthew Artist, Nodecraft
20% less downtime and 40% budget optimization from out-of-the-box monitoring.
— Simon Beginn, LANCOM Systems
Pay per Node. Unlimited Everything Else.
One price per node. Unlimited metrics, logs, users, and retention. No per-GB surprises.
What's Your Monitoring Really Costing You?
Most teams overpay by 40-60%. Let's find out why.
Your Infrastructure Is Unique. Let's Talk.
Because monitoring 10 nodes is different from monitoring 10,000.
Monitoring That Sells Itself
Deploy in minutes. Impress clients in hours. Earn recurring revenue for years.
Per-Second Metrics at Homelab Prices
Same engine, same dashboards, same ML. Just priced for tinkerers.
$1,000 Per Referral. Unlimited Referrals.
Your colleagues get 10% off. You get 10% commission. Everyone wins.
"Netdata's significant positive impact" — LANCOM Systems
Compare vs Datadog, Grafana, Dynatrace
"Cut costs by 46%, staff by 67%" — Codyas
"Reduced cloud bill by 30%" — Falkland Islands Gov
"Better observability with Netdata than combining other tools." — TMB Barcelona
DPA, SLAs, on-prem, volume pricing
One command, 30 seconds, real data—no sandbox needed
Auto-config + per-node pricing = predictable profit
8-episode Netdata tutorial by LearnLinux.tv
3rd most starred monitoring project
Customers report 40-67% cost cuts, 99% downtime reduction
Free tier lets them try before they buy
AI Support Assistant, Available 24/7
Nedi has access to all official documentation, source code, and resources. Ask any question about Netdata—responds in your language.
Engineering Insights & Product Updates
Jun 2026
Network Monitoring, the Netdata Way: …
Interface counters tell you a port is busy. …
Jun 2026
5 Best SolarWinds Alternatives for 2026
As organizations modernize their …
Jun 2026
SolarWinds Price Increases 2026: What …
If you’re a SolarWinds customer facing …
May 2026
High-cardinality metrics at scale: why …
The “high cardinality is …
Never Fight Fires Alone
Docs, community, and expert help—pick your path to resolution.
60 Seconds to First Dashboard
One command to install. Zero config. 850+ integrations documented.
Level Up Your Monitoring
76,000+ Engineers Strong
Per-Second. 90% Cheaper. Data Stays Home.
See why teams switch from Datadog, Prometheus, Grafana, and more.
> Browse all comparisonsTrace issues directly in the source code
Get architecture recommendations
One of the most popular open-source monitoring projects
Enterprise-grade security and compliance
Your metrics stay on your infrastructure
"Most energy-efficient monitoring solution" — ICSOC 2023, peer-reviewed
"Doesn't miss alerts—mission-critical trust for safety software"
Global community improving monitoring for everyone
Trusted by teams worldwide
Free forever, fully open source agent
Work from anywhere, async-friendly culture
Your work helps millions of systems
Real-time observability for telecommunications operators transitioning to cloud-native 5G. Monitor infrastructure at per-second precision with predictable per-node pricing and zero configuration.
Complete infrastructure visibility without the complexity
Catch 2-10 second anomalies invisible to minute-based monitoring. Real-time visibility reveals true network behavior.
Per-node pricing with unlimited metrics and logs. No surprise bills from data volume spikes.
Auto-discovery of infrastructure, containers, and applications. Zero configuration from installation to full dashboards.
18 models per metric detect issues automatically. Edge-based intelligence with consensus-based detection.
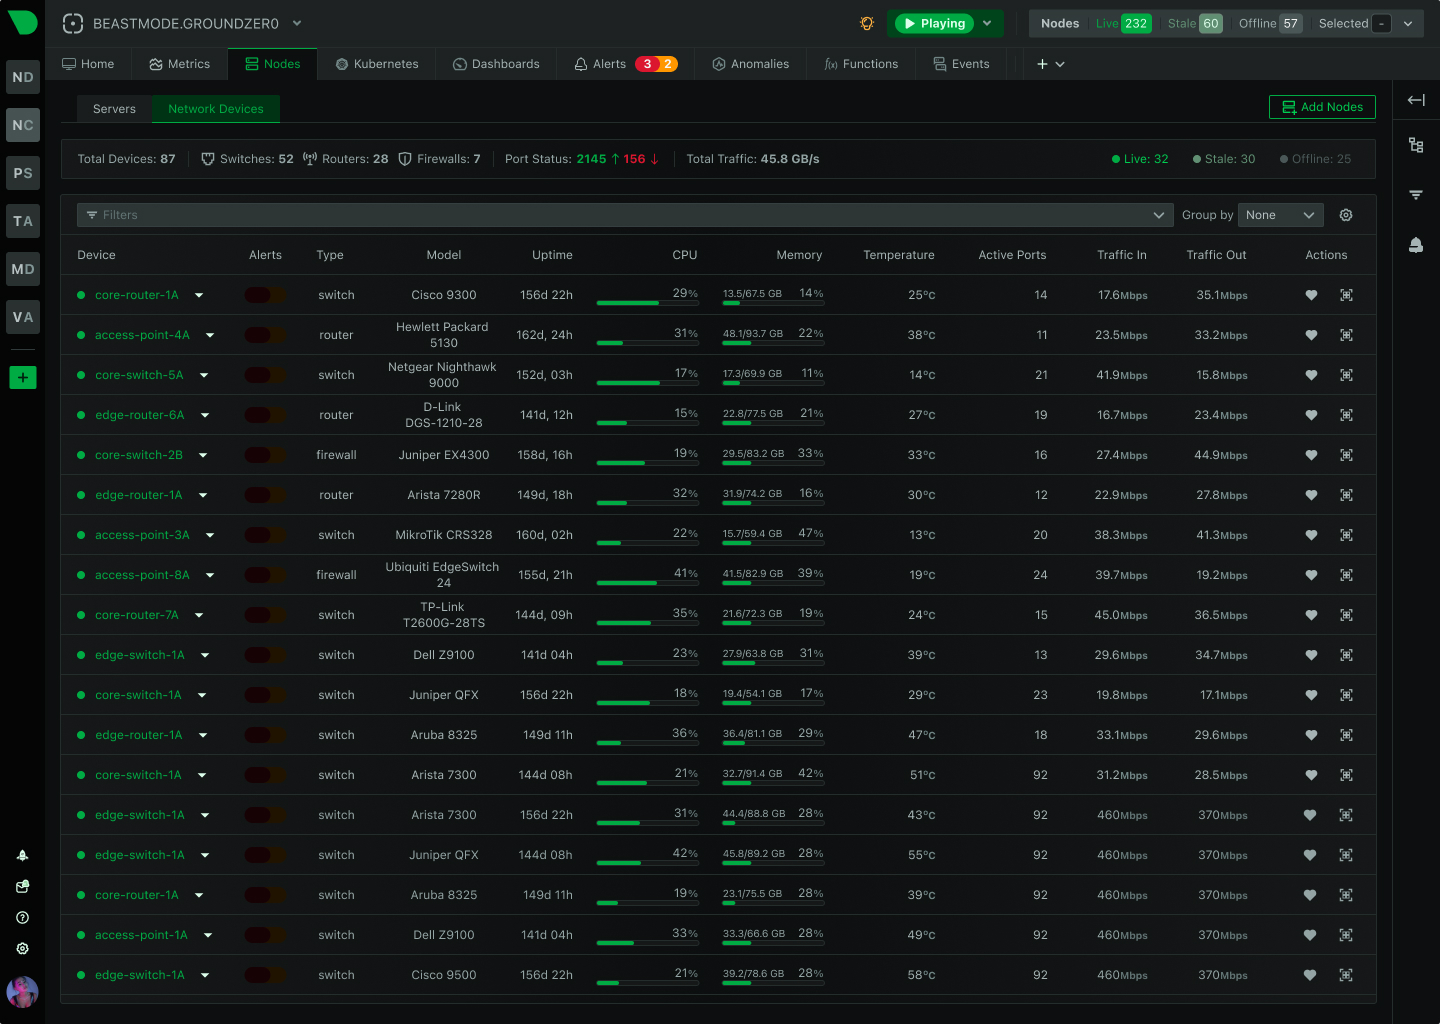
200+ SNMP profiles for Cisco, Juniper, Huawei, Nokia, Arista. Single agent monitors all vendors.
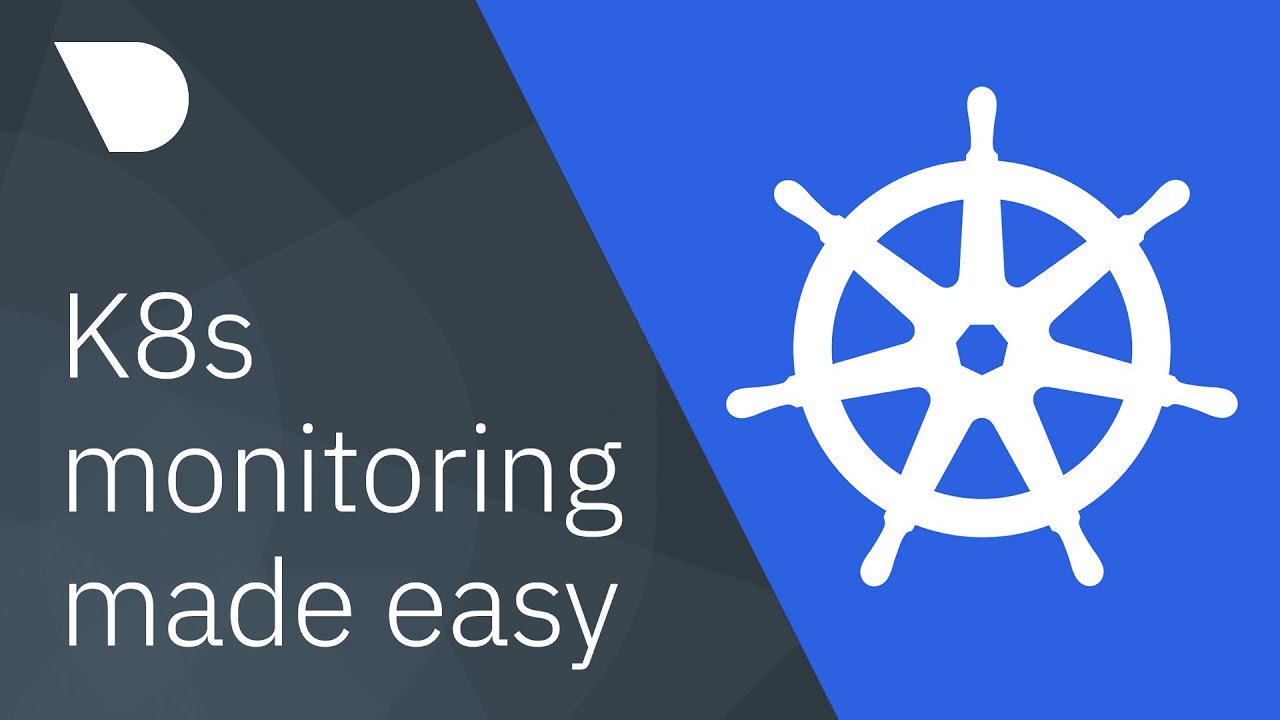
Native Kubernetes monitoring with per-pod visibility. Complete observability for containerized 5G infrastructure.
Trusted by operations teams worldwide
100% visibility in days, not months
See Auto-Discovery
80% MTTR reduction
Explore AI Features
Predictable per-node pricing
View Pricing
One platform for all vendors
See Integrations
Autonomous operation at <5% CPU
Learn Edge Architecture
Zero-config Kubernetes monitoring
Explore Kubernetes
Netdata vs Traditional Telecom Monitoring
Compare Netdata’s distributed edge architecture against traditional centralized monitoring platforms. See how per-second precision, zero-configuration deployment, and predictable costs transform telecom operations.
Capability
Netdata
Traditional Monitoring
Data Granularity
✅ Per-Second
Catches 2-10 second anomalies others miss
⚠️ Per-Minute
Averages hide critical performance patterns
Deployment Time
✅ 60 Seconds
Auto-discovery to full dashboards instantly
⚠️ Weeks to Months
Manual configuration and dashboard building
Pricing Model
✅ Per-Node Pricing
Unlimited metrics and logs included
⚠️ Volume-Based
Unpredictable bills from data growth
ML Anomaly Detection
✅ 18 Models per Metric
Edge-based with consensus detection
⚠️ Cloud-Based Selective
Additional cost and latency
Multi-Vendor Support
✅ 200+ SNMP Profiles
Cisco, Juniper, Huawei, Nokia, Arista
⚠️ Limited Coverage
Vendor-specific agents required
Data Sovereignty
✅ 100% On-Premises
Zero metrics leave infrastructure
⚠️ Cloud-Centric
Data egress charges and compliance risks
Resource Efficiency
✅ <5% CPU, 150MB RAM
Most energy-efficient validated
⚠️ 10-30% CPU Overhead
Significant system impact
MTTR Impact
✅ 80% Reduction
Per-second visibility and AI-powered RCA
❌ Increasing
82% report MTTR over 1 hour in 2024
Storage Efficiency
✅ 0.6 Bytes per Sample
Years of retention in gigabytes
⚠️ 2-16 Bytes per Sample
Months of data in terabytes
Query Language
✅ None Required
Point-and-click NIDL framework
⚠️ PromQL/SQL Required
Weeks of training needed
Native Kubernetes monitoring with auto-discovery of pods, services, and deployments. Per-second visibility into containerized 5G core components, service mesh traffic, and API performance without instrumentation.
Zero-config K8s observability
Explore Kubernetes Monitoring200+ SNMP device profiles for routers, switches, firewalls, and load balancers. Monitor Cisco, Juniper, Huawei, Nokia, Arista with single agent. Auto-discovery eliminates manual configuration.
One agent for all vendors
View All IntegrationsLightweight agents operate independently with local ML, alerting, and storage. Automatic failover and buffering ensure zero data loss during network partitions. Ideal for MEC and private 5G deployments.
Autonomous at <5% CPU
Learn Edge ArchitectureML-powered Anomaly Advisor correlates metrics and surfaces root cause in top 30-50 results. AI Chat provides natural language troubleshooting. Automated reports for capacity planning and performance optimization.
80% MTTR reduction
Explore AI FeaturesDirect systemd-journal access eliminates expensive log pipelines. Query logs where they live with full field indexing. Cost reduction versus Elasticsearch or Splunk while maintaining complete log retention.
Zero-pipeline logs
Learn Zero-Pipeline LogsEssential features that transform telecom infrastructure monitoring
Per-second data collection with sub-2-second latency from event to insight. Catch anomalies traditional minute-based monitoring misses.
18 unsupervised models per metric train locally. Consensus-based detection without cloud dependency.
200+ device profiles for Cisco, Juniper, Huawei, Nokia, Arista. Auto-discovery with SNMPv1/v2c/v3 support across all vendors.
Auto-discovery of pods, services, deployments. Per-container resources, service mesh observability, and API performance monitoring.
60-second installation to full dashboards. Auto-discovers infrastructure, generates dashboards, and activates 400+ pre-configured alerts.
100% on-premises data storage. Zero metrics leave infrastructure. GDPR, HIPAA, PCI DSS compliance by design.
Per-node pricing with unlimited metrics and logs. No surprise bills from data volume spikes or metric cardinality.
Correlates anomalies across all metrics. Surfaces root cause in top 30-50 results. 80% MTTR reduction.
Browser-based access to processes, connections, logs, and systemd units. Same precision as SSH with history and ML.
June 24, 2026
Netdata has added NPM-class network monitoring: live topology maps, NetFlow and sFlow traffic analysis, SNMP device and trap monitoring, and a dedicated network dashboard, all unified with your full-stack observability and processed at the edge.
September 26, 2023
Ensuring Quality of Service with Advanced Network Insights
May 20, 2022
Learn how to monitor Kubernetes workloads without direct cooperation from applications. Gain insights with zero-code changes. Read the full guide now!
Netdata focuses on infrastructure-level monitoring rather than deep protocol analysis. It provides comprehensive visibility into cloud-native 5G core infrastructure (Kubernetes, containers, microservices), network devices (via SNMP), and API performance (HTTP/REST). For deep 5G protocol analysis (signaling, user plane, subscriber analytics), Netdata complements specialized tools like NETSCOUT or VIAVI. Learn more about Netdata’s cloud capabilities.
Netdata includes 200+ SNMP device profiles for major vendors including Cisco, Juniper, Huawei, Nokia, Arista, F5, Palo Alto, Fortinet, AudioCodes, and Avaya. A single agent monitors all vendors with SNMPv1/v2c/v3 support and auto-discovery. Unlike vendor-specific tools, Netdata provides unified dashboards, consistent alerting, and the same interface across all vendors. Explore all integrations.
Organizations typically achieve 90% cost reduction with Netdata’s per-node pricing model compared to volume-based monitoring platforms. Netdata uses predictable per-node pricing with unlimited metrics and logs, eliminating volume-based surprises. Edge processing eliminates data egress charges while maintaining 100% sample completeness. View transparent pricing.
Yes, Netdata is ideal for edge computing. Agents operate autonomously with local ML, alerting, and storage using less than 5% CPU and 150MB RAM. They work independently during network partitions with automatic buffering and failover. This makes Netdata suitable for Multi-Access Edge Computing (MEC), private 5G networks, and distributed edge sites. Learn about edge computing observability.
Netdata deploys in 60 seconds from installation to full dashboards. Auto-discovery eliminates manual configuration for infrastructure, containers, and applications. ML starts training immediately with first anomaly detection in 15 minutes. 400+ pre-configured alerts activate automatically. This contrasts with traditional tools requiring weeks or months of setup. See zero-configuration deployment.
Yes, Netdata provides native Kubernetes monitoring with auto-discovery of pods, services, and deployments. It monitors containerized network functions, service mesh traffic (Envoy, Traefik), and API performance without instrumentation. Per-second visibility reveals issues in microservices architecture that traditional tools miss. Helm deployment includes DaemonSet for node monitoring and Deployment for centralized Parents. Explore Kubernetes monitoring.
Netdata ensures 100% data sovereignty with all metrics and logs stored on-premises. Zero observability data leaves your infrastructure - only metadata travels to Netdata Cloud for unified dashboards. This design satisfies GDPR, HIPAA, PCI DSS, and regional data residency requirements automatically. Netdata is SOC 2 Type 2 certified with support for air-gapped deployments. Learn about data sovereignty.
Netdata trains 18 unsupervised k-means models per metric using different time windows. Anomalies are flagged only when ALL 18 models agree, achieving consensus-based detection. ML runs at the edge during data collection with zero cloud dependency. Models retrain automatically every 3 hours without manual tuning. This provides universal coverage - every metric gets ML, not selective monitoring. Explore ML anomaly detection.
Netdata excels at infrastructure monitoring (servers, containers, Kubernetes, network devices, applications) and can replace tools like Prometheus, Grafana, and general-purpose APM platforms. For telecommunications, Netdata is ideal for cloud-native 5G infrastructure but complements specialized tools for deep protocol analysis (NETSCOUT, VIAVI) and distributed tracing (Jaeger - until Netdata’s tracing ships in Q2 2026). Most organizations use Netdata as their primary infrastructure observability platform. See product overview.
Netdata offers multiple support tiers: Community (forums, Discord), Business (email/ticket support with SLA), and Enterprise (24/7 availability, dedicated teams, phone support). Professional services include implementation assistance, architecture design, migration support, and training programs. For large deployments, Netdata provides on-premises installation with custom SLAs. Contact [email protected] for enterprise requirements.
Netdata improves alert quality through component-level alerts (per-database, per-container, per-interface) that are more actionable than generic thresholds. Intelligent thresholds adapt to workload patterns using rolling windows. Hysteresis protection prevents alert storms. The Anomaly Advisor helps during troubleshooting by ranking metrics by relevance, surfacing root cause in the top 30-50 results. While Netdata significantly improves alert quality and accelerates troubleshooting, human judgment remains important for prioritization. Learn about intelligent alerting.
Netdata’s roadmap includes distributed tracing (Q2 2026) to complete MELT observability, enhanced service mesh visualization, and expanded 5G-specific integrations. The platform continuously adds new collectors based on community feedback. For telecommunications, focus areas include improved Kubernetes observability, enhanced SNMP capabilities, and deeper integration with cloud-native 5G architectures. Join the community to influence roadmap priorities.
Yes, Netdata offers a 14-day free trial with unlimited nodes and no restrictions. The open-source agent is free forever for unlimited nodes with local dashboards. For multi-node dashboards and Cloud features, the Community plan provides 5 nodes free. You can also explore the live demo to see Netdata monitoring real infrastructure. Start your free trial today.
Netdata provides comprehensive data export capabilities via REST API v3, Prometheus Remote Write, and 25+ export targets including InfluxDB, Graphite, OpenTSDB, TimescaleDB, and cloud platforms. While Netdata does not include native OSS/BSS adapters, it serves as the observability layer that feeds data to existing operational systems. Organizations typically export Netdata metrics to their OSS/BSS platforms for business workflows while using Netdata for real-time troubleshooting. Explore integration options.
Netdata provides extensive documentation at learn.netdata.cloud, including getting started guides, tutorials, video walkthroughs, and architecture deep-dives. The platform requires minimal training due to zero-configuration deployment and query-less NIDL framework. For enterprise deployments, Netdata offers instructor-led training, virtual workshops, and custom curriculum development. The active community forums and Discord server provide peer support. Most teams become productive within hours, not weeks.