 |
VOOZH | about |
|
VOOZH | about |
The only agent that thinks for itself
Autonomous Monitoring with self-learning AI built-in, operating independently across your entire stack.
Centralized metrics streaming and storage
Aggregate metrics from multiple agents into centralized Parent nodes for unified monitoring across your infrastructure.
Fully managed cloud platform
Access your monitoring data from anywhere with our SaaS platform. No infrastructure to manage, automatic updates, and global availability.
Deploy Netdata Cloud in your infrastructure
Run the full Netdata Cloud platform on-premises for complete data sovereignty and compliance with your security policies.
Powerful, intuitive monitoring interface
Modern, responsive UI built for real-time troubleshooting with customizable dashboards and advanced visualization capabilities.
Monitor on the go
Native iOS and Android apps bring full monitoring capabilities to your mobile device with real-time alerts and notifications.
The future of infrastructure observability
See our strategic direction across AI-native observability, full-stack signals, operational intelligence, and enterprise platform maturity.
Best energy efficiency
True real-time per-second
100% automated zero config
Centralized observability
Multi-year retention
High availability built-in
Zero maintenance
Always up-to-date
Enterprise security
Complete data control
Air-gap ready
Compliance certified
Millisecond responsiveness
Infinite zoom & pan
Works on any device
Native performance
Instant alerts
Monitor anywhere
AI-native observability
Continuous delivery
Open source foundation
80% Faster Incident Resolution
True Real-Time and Simple, even at Scale
90% Cost Reduction, Full Fidelity
See and Map Your Entire Network
Single Pane of Glass
Control Without Surrender
Integrations
800+ collectors and notification channels, auto-discovered and ready out of the box.
Reduced monitoring costs by 46% while cutting staff overhead by 67%.
— Leonardo Antunez, Codyas
No data shipping. No central storage costs. Query at the edge.
So many out-of-the-box features! I mostly don't have to develop anything.
— Simon Beginn, LANCOM Systems
Point-and-click troubleshooting. No PromQL, no LogQL, no learning curve.
Enterprise efficiency without enterprise complexity—real ROI from day one.
— Leonardo Antunez, Codyas
Zero data egress. Only metadata reaches the cloud. Your metrics stay on your infrastructure.
Auto-discovered and configured. No manual setup required.
Slack, PagerDuty, Teams, email, webhooks—all built-in.
Built for the People Who Get Paged
Every Industry Has Rules. We Master Them.
Monitor Any Technology. Configure Nothing.
Complete Visibility. Total Control.
Don't Take Our Word for It
Netdata gives more than you invest in it. A rare unicorn that obeys the Pareto rule.
— Eduard Porquet Mateu, TMB Barcelona
Reduced website downtime by 99% and cloud bill by 30% using Netdata alerts.
— Falkland Islands Government
Optimized resource allocation based on Netdata alerts cut cloud spending by 30%.
— Falkland Islands Government
Reduced monitoring staff by 67% while cutting operational costs by 46%.
— Codyas
Netdata has agent capacity or a plugin for everything, including Windows and Kubernetes.
— Eduard Porquet Mateu, TMB Barcelona
So many out-of-the-box features! I mostly don't have to develop anything.
— Simon Beginn, LANCOM Systems
From 2-3 minutes to 30 seconds—instant visibility into any node issue.
— Matthew Artist, Nodecraft
20% less downtime and 40% budget optimization from out-of-the-box monitoring.
— Simon Beginn, LANCOM Systems
Pay per Node. Unlimited Everything Else.
One price per node. Unlimited metrics, logs, users, and retention. No per-GB surprises.
What's Your Monitoring Really Costing You?
Most teams overpay by 40-60%. Let's find out why.
Your Infrastructure Is Unique. Let's Talk.
Because monitoring 10 nodes is different from monitoring 10,000.
Monitoring That Sells Itself
Deploy in minutes. Impress clients in hours. Earn recurring revenue for years.
Per-Second Metrics at Homelab Prices
Same engine, same dashboards, same ML. Just priced for tinkerers.
$1,000 Per Referral. Unlimited Referrals.
Your colleagues get 10% off. You get 10% commission. Everyone wins.
"Netdata's significant positive impact" — LANCOM Systems
Compare vs Datadog, Grafana, Dynatrace
"Cut costs by 46%, staff by 67%" — Codyas
"Reduced cloud bill by 30%" — Falkland Islands Gov
"Better observability with Netdata than combining other tools." — TMB Barcelona
DPA, SLAs, on-prem, volume pricing
One command, 30 seconds, real data—no sandbox needed
Auto-config + per-node pricing = predictable profit
8-episode Netdata tutorial by LearnLinux.tv
3rd most starred monitoring project
Customers report 40-67% cost cuts, 99% downtime reduction
Free tier lets them try before they buy
AI Support Assistant, Available 24/7
Nedi has access to all official documentation, source code, and resources. Ask any question about Netdata—responds in your language.
Engineering Insights & Product Updates
Jun 2026
Network Monitoring, the Netdata Way: …
Interface counters tell you a port is busy. …
Jun 2026
5 Best SolarWinds Alternatives for 2026
As organizations modernize their …
Jun 2026
SolarWinds Price Increases 2026: What …
If you’re a SolarWinds customer facing …
May 2026
High-cardinality metrics at scale: why …
The “high cardinality is …
Never Fight Fires Alone
Docs, community, and expert help—pick your path to resolution.
60 Seconds to First Dashboard
One command to install. Zero config. 850+ integrations documented.
Level Up Your Monitoring
76,000+ Engineers Strong
Per-Second. 90% Cheaper. Data Stays Home.
See why teams switch from Datadog, Prometheus, Grafana, and more.
> Browse all comparisonsTrace issues directly in the source code
Get architecture recommendations
One of the most popular open-source monitoring projects
Enterprise-grade security and compliance
Your metrics stay on your infrastructure
"Most energy-efficient monitoring solution" — ICSOC 2023, peer-reviewed
"Doesn't miss alerts—mission-critical trust for safety software"
Global community improving monitoring for everyone
Trusted by teams worldwide
Free forever, fully open source agent
Work from anywhere, async-friendly culture
Your work helps millions of systems
When every second of uptime matters, you need observability that operates at the speed of your infrastructure. Netdata delivers per-second metrics with sub-2-second detection, giving operations teams the real-time visibility required to maintain always-on services.
The observability platform designed for teams that cannot afford blind spots
Per-second collection with 1-second visualization latency. See issues as they happen, not minutes later.
AI-powered root cause analysis and ML anomaly detection cut troubleshooting time dramatically.
Edge-native architecture eliminates egress fees and volume-based pricing explosions.
Component-level alerts provide actionable, precise monitoring. Ships ready to use with 800+ integrations.
Anomaly Advisor surfaces root cause in top 30-50 metrics. Ask AI explains any alert instantly.
Auto-discovery of 800+ integrations. Dashboards generate algorithmically. Productive in 60 seconds.
Trusted by operations teams running 24/7 infrastructure
10-60× more granular than standard solutions
Explore real-time monitoring
80% MTTR reduction
Learn about AI troubleshooting
0.6 bytes per metric sample
See cost efficiency
Zero learning curve
See visualization features
Feature Comparison
How Netdata compares to traditional monitoring for 24/7 operations
Capability
Netdata
Traditional Monitoring
Data Granularity
✅ Per-second
Catches 2-10 second anomalies that matter
⚠️ Per-minute
Averages hide critical transient issues
Detection Latency
✅ Sub-2 seconds
Collection to visualization in 1 second
⚠️ 30-90 seconds
Pipeline delays add significant latency
Anomaly Detection
✅ 18 ML models per metric
Automatic baselines, consensus-based detection
⚠️ Manual thresholds
Requires expertise, constant tuning
Root Cause Analysis
✅ AI-powered
Anomaly Advisor ranks causes automatically
⚠️ Manual investigation
Context switching across multiple tools
Configuration Needed
✅ Zero to minimal
Auto-discovery, algorithmic dashboards
❌ Extensive
Weeks of dashboard and alert setup
Cost Model
✅ Per-node pricing
Unlimited metrics, logs, and users included
❌ Volume-based
Bills grow 3-10× faster than infrastructure
True real-time monitoring with 1-second collection and sub-2-second total latency. Gaps in charts reveal system stress - if Netdata can't collect, your applications are struggling.
10-60× more granular than standard monitoring
Learn more400+ pre-configured alerts with component-level granularity. ML anomaly detection provides an additional signal. Hysteresis protection prevents notification floods during incident storms.
Component-level precision for actionable alerts
Explore alertingAnomaly Advisor surfaces root cause in top 30-50 metrics. AI Troubleshoot provides interactive analysis. AI Insights generates professional reports automatically for post-incident reviews.
80% faster mean time to resolution
Discover AI featuresDirect systemd-journal and Windows Event Log access without shipping infrastructure. Full-text search across millions of entries. Instant correlation with metrics from the same source.
90% cost reduction vs log pipelines
See logs managementReplace SSH with browser-based debugging. View processes, network connections, systemd units, and IPMI sensors - all with per-second precision, history, and ML context.
Debug production without infrastructure access
Explore functionsKey advantages for continuous operations environments
Per-second data collection with sub-2-second latency reveals issues that minute-averaged tools miss entirely.
Anomaly Advisor automatically ranks metrics by severity. Root cause typically appears in top 30-50 results.
Per-node pricing with unlimited metrics, logs, and users. No volume surprises or cardinality explosions.
Zero configuration with auto-discovery. Algorithmic dashboards adapt automatically to your infrastructure.
Junior and senior engineers get identical visibility. No query languages or dashboard building required.
All observability data stays on your infrastructure. SOC 2 Type 2 certified with GDPR/HIPAA alignment.
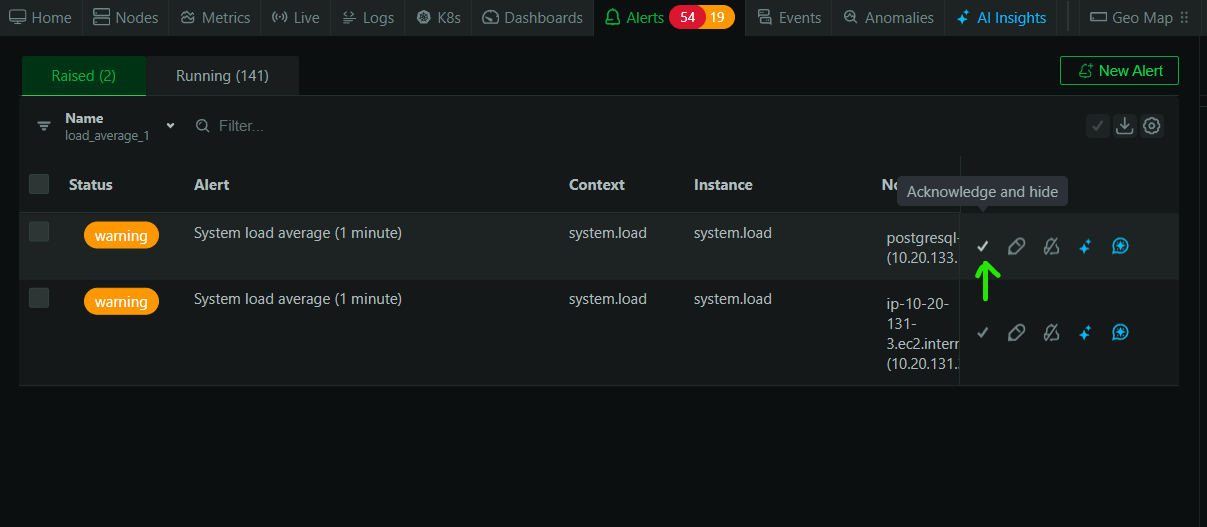
April 10, 2026
Acknowledge alerts in Netdata to clear noise from your active view without losing track of ongoing issues. Acknowledgements expire automatically when the alert state changes.
September 2, 2025
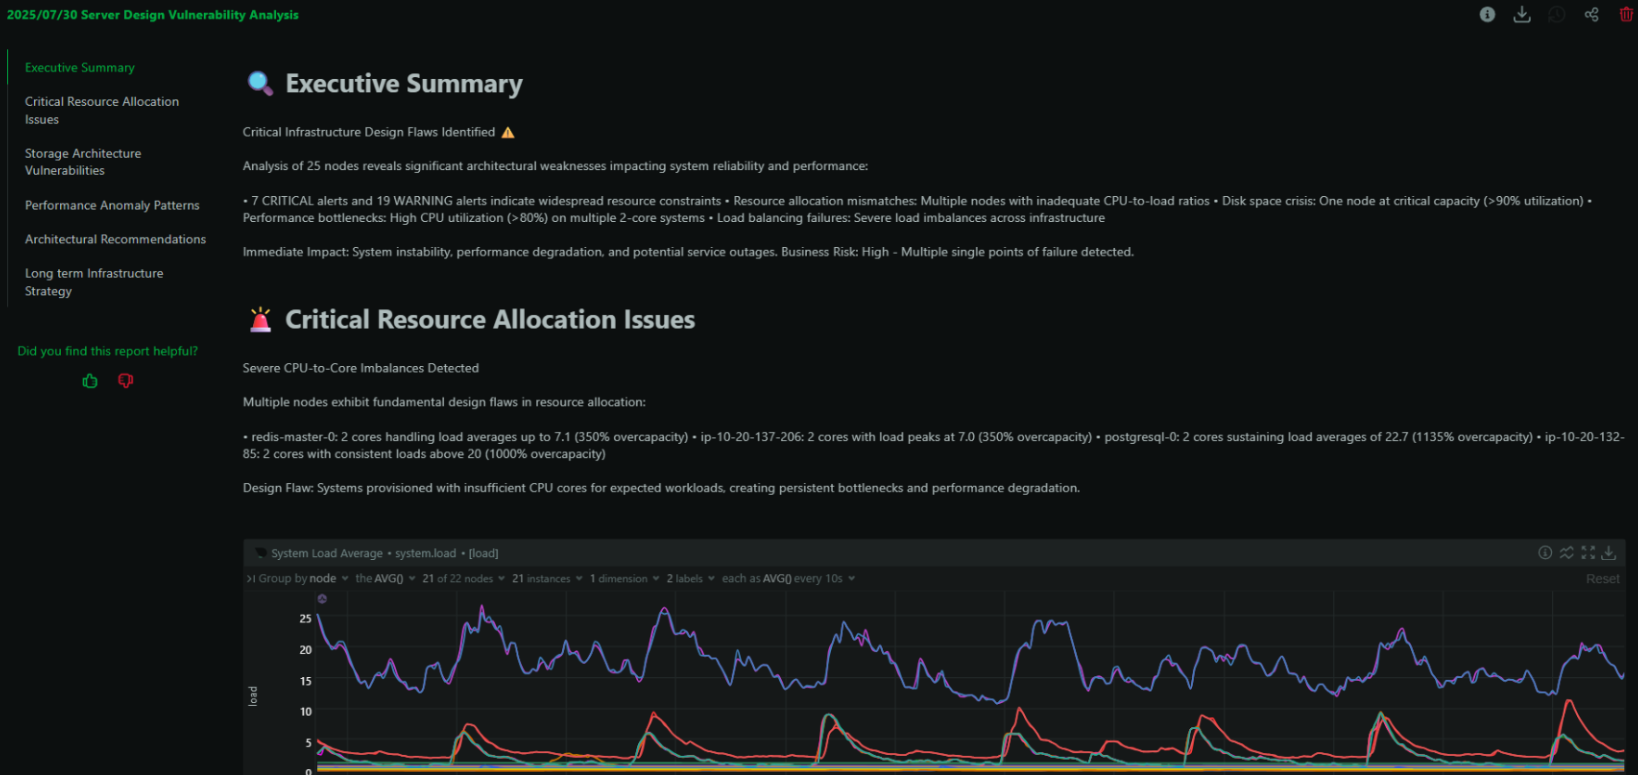
Our AI investigations and insights are now out of preview. Every space can scale on-demand with AI Credits.
August 4, 2025
Ask Netdata Anything, Get an Expert Analysis in Minutes - introducing conversational infrastructure troubleshooting powered by Netdata AI: Your Co-SRE.
Netdata’s distributed edge-native architecture processes data where it’s generated. Each agent is a complete observability engine - collecting, storing, analyzing, and visualizing locally. This eliminates central bottlenecks and enables linear scalability to 100,000+ nodes while maintaining per-second granularity. Learn more about scalability.
Netdata trains 18 unsupervised k-means ML models per metric, each using different time windows. Anomalies are flagged only when all models agree, achieving 99% false positive reduction in anomaly detection. This detects behavioral changes that fixed thresholds miss. Note that ML anomaly detection is a separate signal - it does not influence or filter traditional alerts. Explore anomaly detection.
The Anomaly Advisor scores all collected metrics by anomaly severity within any time window. Root cause typically surfaces in the top 30-50 results. AI Chat lets you ask questions in natural language, while AI Insights generates professional reports for post-incident reviews. Discover AI features.
Yes. Each Netdata agent provides metrics collection (800+ integrations), log ingestion, ML anomaly detection, alerting, and visualization. It also replaces console tools like top, iostat, and netstat with browser-based equivalents that include history and ML context. Organizations typically consolidate multiple tools into Netdata.
Unlike volume-based pricing models, Netdata has no cardinality limits. Edge processing handles unlimited metrics without central database explosion. Storage efficiency (0.6 bytes per sample) enables years of retention in gigabytes. Learn about cost efficiency.
Installation takes 60 seconds per node. Auto-discovery begins immediately, and dashboards generate algorithmically within moments. For enterprise deployments, the complete setup - including parent clusters, alert review, and team onboarding - typically completes in days, not months. See documentation.
Netdata integrates with 20+ notification channels including PagerDuty, Opsgenie, Slack, Teams, Discord, email, SMS, and custom webhooks. Alert routing supports role-based targeting, maintenance windows, and severity-based escalation. Explore alert integrations.
Yes. Netdata includes synthetic monitoring collectors (httpcheck, ping, portcheck, dnsquery, x509check) for proactive endpoint testing. Component-level alerts provide early warning before SLA violations occur. See synthetic monitoring.
Netdata Cloud provides Spaces for organizational isolation and Rooms for team-based access control. Dashboard views, highlighted timeframes, and node filters synchronize across users. RBAC ensures appropriate access levels, while SSO/SCIM integration simplifies enterprise identity management. Learn about collaboration.
Each Netdata agent operates independently with local storage, dashboards, and alerting. During network partitions, agents continue collecting and storing data locally. When connectivity restores, data replicates automatically to parent nodes. Explore high availability.