 |
VOOZH | about |
|
VOOZH | about |
The only agent that thinks for itself
Autonomous Monitoring with self-learning AI built-in, operating independently across your entire stack.
Centralized metrics streaming and storage
Aggregate metrics from multiple agents into centralized Parent nodes for unified monitoring across your infrastructure.
Fully managed cloud platform
Access your monitoring data from anywhere with our SaaS platform. No infrastructure to manage, automatic updates, and global availability.
Deploy Netdata Cloud in your infrastructure
Run the full Netdata Cloud platform on-premises for complete data sovereignty and compliance with your security policies.
Powerful, intuitive monitoring interface
Modern, responsive UI built for real-time troubleshooting with customizable dashboards and advanced visualization capabilities.
Monitor on the go
Native iOS and Android apps bring full monitoring capabilities to your mobile device with real-time alerts and notifications.
The future of infrastructure observability
See our strategic direction across AI-native observability, full-stack signals, operational intelligence, and enterprise platform maturity.
Best energy efficiency
True real-time per-second
100% automated zero config
Centralized observability
Multi-year retention
High availability built-in
Zero maintenance
Always up-to-date
Enterprise security
Complete data control
Air-gap ready
Compliance certified
Millisecond responsiveness
Infinite zoom & pan
Works on any device
Native performance
Instant alerts
Monitor anywhere
AI-native observability
Continuous delivery
Open source foundation
80% Faster Incident Resolution
True Real-Time and Simple, even at Scale
90% Cost Reduction, Full Fidelity
See and Map Your Entire Network
Single Pane of Glass
Control Without Surrender
Integrations
800+ collectors and notification channels, auto-discovered and ready out of the box.
Reduced monitoring costs by 46% while cutting staff overhead by 67%.
— Leonardo Antunez, Codyas
No data shipping. No central storage costs. Query at the edge.
So many out-of-the-box features! I mostly don't have to develop anything.
— Simon Beginn, LANCOM Systems
Point-and-click troubleshooting. No PromQL, no LogQL, no learning curve.
Enterprise efficiency without enterprise complexity—real ROI from day one.
— Leonardo Antunez, Codyas
Zero data egress. Only metadata reaches the cloud. Your metrics stay on your infrastructure.
Auto-discovered and configured. No manual setup required.
Slack, PagerDuty, Teams, email, webhooks—all built-in.
Built for the People Who Get Paged
Every Industry Has Rules. We Master Them.
Monitor Any Technology. Configure Nothing.
Complete Visibility. Total Control.
Don't Take Our Word for It
Netdata gives more than you invest in it. A rare unicorn that obeys the Pareto rule.
— Eduard Porquet Mateu, TMB Barcelona
Reduced website downtime by 99% and cloud bill by 30% using Netdata alerts.
— Falkland Islands Government
Optimized resource allocation based on Netdata alerts cut cloud spending by 30%.
— Falkland Islands Government
Reduced monitoring staff by 67% while cutting operational costs by 46%.
— Codyas
Netdata has agent capacity or a plugin for everything, including Windows and Kubernetes.
— Eduard Porquet Mateu, TMB Barcelona
So many out-of-the-box features! I mostly don't have to develop anything.
— Simon Beginn, LANCOM Systems
From 2-3 minutes to 30 seconds—instant visibility into any node issue.
— Matthew Artist, Nodecraft
20% less downtime and 40% budget optimization from out-of-the-box monitoring.
— Simon Beginn, LANCOM Systems
Pay per Node. Unlimited Everything Else.
One price per node. Unlimited metrics, logs, users, and retention. No per-GB surprises.
What's Your Monitoring Really Costing You?
Most teams overpay by 40-60%. Let's find out why.
Your Infrastructure Is Unique. Let's Talk.
Because monitoring 10 nodes is different from monitoring 10,000.
Monitoring That Sells Itself
Deploy in minutes. Impress clients in hours. Earn recurring revenue for years.
Per-Second Metrics at Homelab Prices
Same engine, same dashboards, same ML. Just priced for tinkerers.
$1,000 Per Referral. Unlimited Referrals.
Your colleagues get 10% off. You get 10% commission. Everyone wins.
"Netdata's significant positive impact" — LANCOM Systems
Compare vs Datadog, Grafana, Dynatrace
"Cut costs by 46%, staff by 67%" — Codyas
"Reduced cloud bill by 30%" — Falkland Islands Gov
"Better observability with Netdata than combining other tools." — TMB Barcelona
DPA, SLAs, on-prem, volume pricing
One command, 30 seconds, real data—no sandbox needed
Auto-config + per-node pricing = predictable profit
8-episode Netdata tutorial by LearnLinux.tv
3rd most starred monitoring project
Customers report 40-67% cost cuts, 99% downtime reduction
Free tier lets them try before they buy
AI Support Assistant, Available 24/7
Nedi has access to all official documentation, source code, and resources. Ask any question about Netdata—responds in your language.
Engineering Insights & Product Updates
Jun 2026
Network Monitoring, the Netdata Way: …
Interface counters tell you a port is busy. …
Jun 2026
5 Best SolarWinds Alternatives for 2026
As organizations modernize their …
Jun 2026
SolarWinds Price Increases 2026: What …
If you’re a SolarWinds customer facing …
May 2026
High-cardinality metrics at scale: why …
The “high cardinality is …
Never Fight Fires Alone
Docs, community, and expert help—pick your path to resolution.
60 Seconds to First Dashboard
One command to install. Zero config. 850+ integrations documented.
Level Up Your Monitoring
76,000+ Engineers Strong
Per-Second. 90% Cheaper. Data Stays Home.
See why teams switch from Datadog, Prometheus, Grafana, and more.
> Browse all comparisonsTrace issues directly in the source code
Get architecture recommendations
One of the most popular open-source monitoring projects
Enterprise-grade security and compliance
Your metrics stay on your infrastructure
"Most energy-efficient monitoring solution" — ICSOC 2023, peer-reviewed
"Doesn't miss alerts—mission-critical trust for safety software"
Global community improving monitoring for everyone
Trusted by teams worldwide
Free forever, fully open source agent
Work from anywhere, async-friendly culture
Your work helps millions of systems
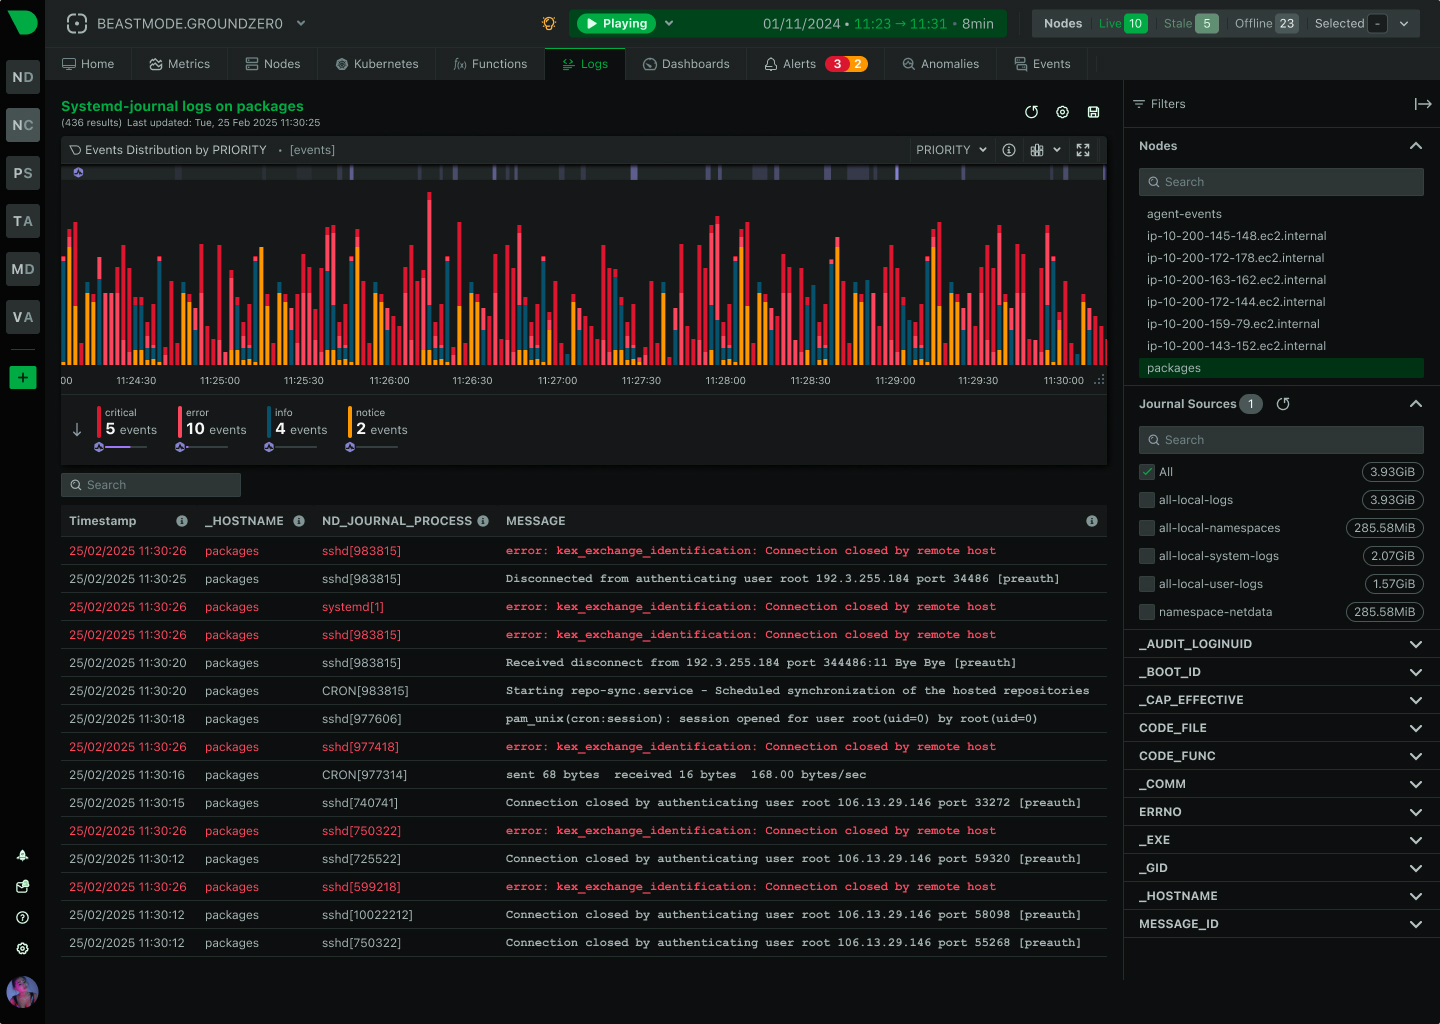
Eliminate expensive centralized clusters and volume-based pricing. Netdata queries systemd-journal and Windows Event Logs directly at the edge - delivering 90% cost reduction, sub-second queries, and complete data sovereignty without sacrificing visibility.
Revolutionary edge-based architecture eliminates the entire centralized pipeline
Predictable per-node pricing eliminates volume-based charges. No ingestion fees, no indexing clusters, no surprise bills - just predictable costs that scale with infrastructure.
Instant responses on million+ entry datasets. Direct file access with OS-optimized memory mapping delivers immediate answers when every second counts during incidents.
Analyze significantly more entries before sampling. Every field is indexed automatically with unlimited cardinality - trust your data during critical troubleshooting.
Logs never leave your infrastructure. Zero cloud storage, cryptographic tamper detection, and compliance-by-design satisfy GDPR, HIPAA, and PCI DSS automatically.
Click any metric anomaly to see related log errors instantly. Same agent, same timeline, zero timestamp matching - unified observability without integration complexity.
Auto-discovers systemd-journal and Windows Event Logs. Zero configuration, no schema design, no query languages - from installation to insight in under a minute.
Trusted by operations teams worldwide
90% cost reduction
Calculate Your Savings
Sub-second queries
See Performance Benchmarks
All fields indexed automatically
Learn About Intelligent Sampling
Zero data egress
Explore Compliance Features
Single unified platform
See Unified Observability
60-second deployment
Start Free Trial
How Netdata Compares
See how Netdata’s revolutionary edge-based approach eliminates the cost, complexity, and performance bottlenecks of traditional log management platforms.
Capability
Netdata
Traditional Platforms
Architecture
✅ Ideal
Query logs directly where generated
⚠️ Limited
Ship all logs to central databases
Pricing Model
✅ Ideal
Predictable per-node, no volume charges
❌ Expensive
Volume-based ingestion and indexing fees
Query Performance
✅ Ideal
Sub-second via direct file access
⚠️ Limited
Network latency plus cluster processing
Sampling Accuracy
✅ Advanced
Significantly more entries analyzed
⚠️ Limited
Limited entries before timeout
Field Indexing
✅ Ideal
Every field indexed, unlimited cardinality
⚠️ Limited
Schema configuration, cardinality limits
Data Location
✅ Ideal
On-premises always, zero egress
❌ Challenging
Data leaves infrastructure
Setup Complexity
✅ Ideal
60-second auto-discovery deployment
⚠️ Complex
Cluster setup, schema design, tuning
Metrics Correlation
✅ Ideal
Same agent, automatic correlation
⚠️ Manual
Separate systems, timestamp matching
Operational Overhead
✅ Ideal
No clusters, shards, or indexing jobs
❌ Complex
Cluster tuning, capacity planning
Compliance Features
✅ Advanced
Forward Secure Sealing, cryptographic proof
⚠️ Basic
Write-once without tamper evidence
Query systemd-journal files directly with libsystemd APIs. Every field indexed automatically, unlimited cardinality, real-time streaming with PLAY mode. Memory-mapped I/O delivers sub-second queries on million+ entry datasets.
Zero pipeline architecture
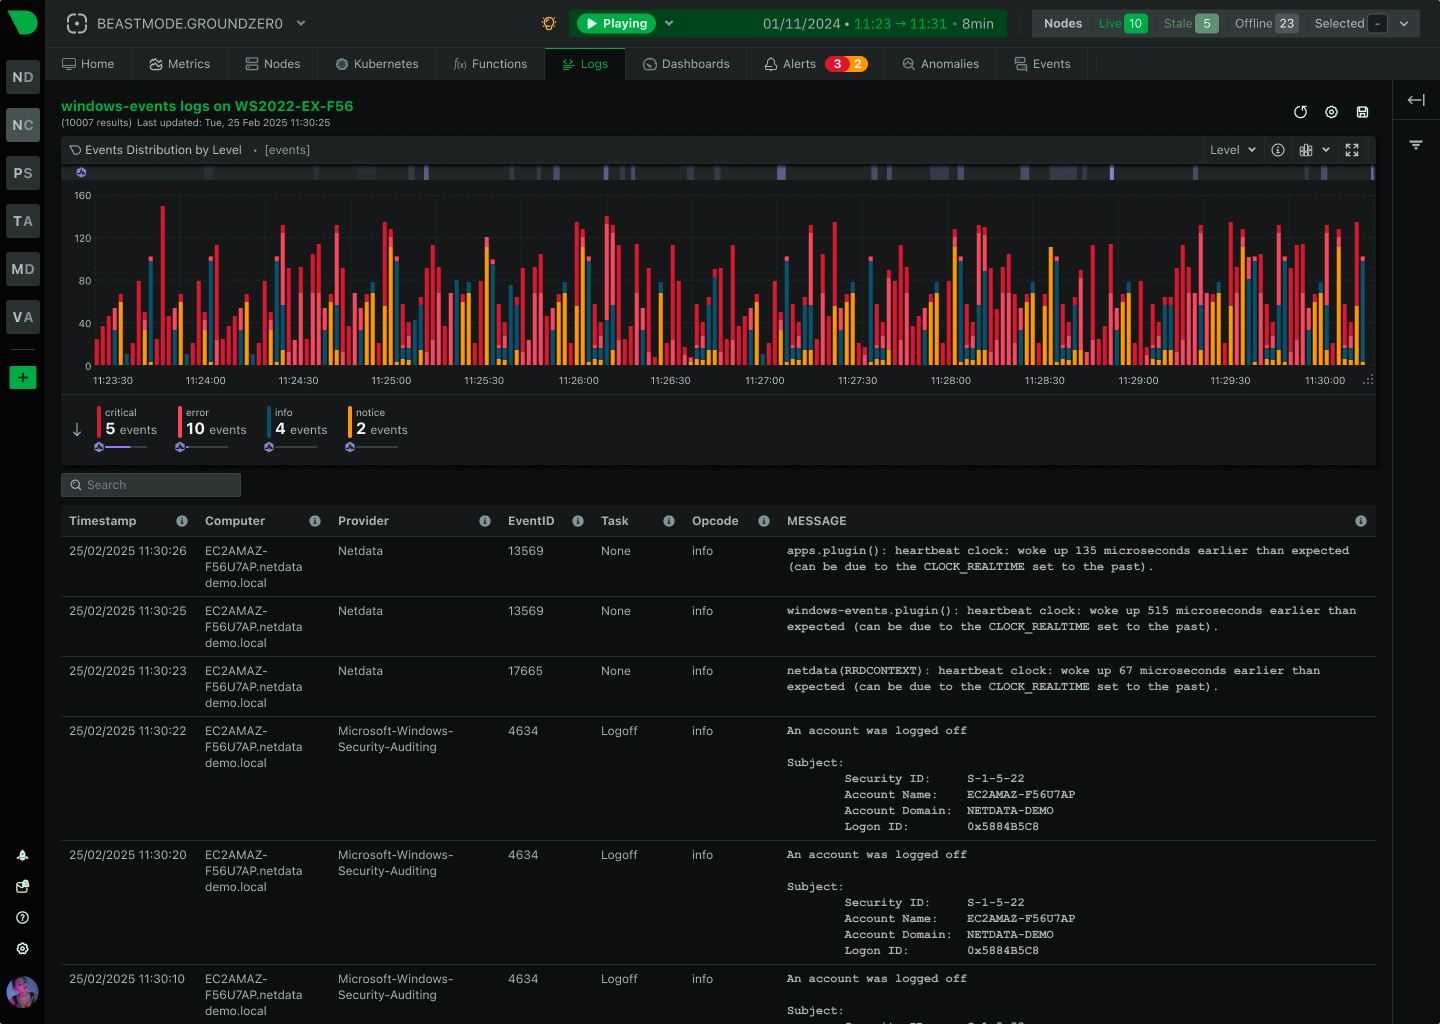
Explore Linux LoggingNative Windows Event Log APIs support WEL, ETW, and TraceLogging. Automatic channel discovery, system field filtering, unified interface matching Linux journal experience. Complete enterprise Windows coverage.
Cross-platform consistency
Explore Windows LoggingPure Rust otel-plugin receives OTLP gRPC logs and converts to systemd-journal format automatically. Works cross-platform with the same unified query interface. Standards-based ingestion protects instrumentation investment.
Standards-based integration
Learn About OTel Supportlog2journal converts text, JSON, or logfmt logs into systemd-journal format. Extract fields with PCRE2 patterns, map to journal fields, enrich with severity and correlation IDs.
Universal compatibility
Explore log2journalForward Secure Sealing provides cryptographic proof of log integrity. Sealing keys regenerated via non-reversible process, verification keys stored off-system. Satisfies HIPAA, PCI DSS, and SOX requirements.
Audit-ready from day one
Explore Compliance FeaturesRevolutionary edge-based architecture delivers superior economics and performance
Flat per-node pricing eliminates volume-based charges. Collect everything without cost anxiety - debug-level logging in production costs the same as minimal logging.
Sub-second queries enable rapid iteration during incidents. Engineers explore hypotheses immediately without waiting for results, maintaining problem-solving flow state.
Analyze significantly more data with tighter confidence intervals. Trust query results because statistical accuracy is dramatically better than traditional platforms.
Complete data sovereignty with cryptographic tamper detection. GDPR, HIPAA, PCI DSS, SOX requirements satisfied automatically without data egress concerns.
Metrics and logs from same agent with automatic correlation. Click metric anomaly to see related log errors instantly - zero timestamp matching required.
Auto-discovers journals in 60 seconds. No schema design, no query languages, no cluster setup - from installation to insight in under a minute.
Every field indexed automatically with unlimited cardinality. Dynamic fields like container IDs and session tokens work natively without clustering failures.
Each node processes logs independently. Adding nodes doesn’t affect existing performance - no central bottlenecks, no architectural rewrites as you grow.
Works standalone or centralized using standard systemd-journal-upload/remote. Choose based on requirements - local troubleshooting or centralized compliance.
June 24, 2026
Netdata has added NPM-class network monitoring: live topology maps, NetFlow and sFlow traffic analysis, SNMP device and trap monitoring, and a dedicated network dashboard, all unified with your full-stack observability and processed at the edge.
June 23, 2026
Discover the top SolarWinds alternatives for 2026. Compare modern monitoring platforms built for cloud-native infrastructure - now with NPM-class network monitoring - with transparent pricing and real-time insights.
June 23, 2026
Understanding SolarWinds' subscription-only pricing changes following the Turn/River Capital acquisition, and exploring your options for infrastructure monitoring.
Traditional platforms charge per-GB for ingestion plus indexing, forcing organizations to sample logs or face exponential costs. Netdata’s predictable per-node pricing means the same infrastructure costs dramatically less regardless of log volume. You also eliminate cluster infrastructure costs (no Elasticsearch nodes, Kafka, Logstash) and operational overhead, achieving 90% total cost reduction.
Netdata queries logs directly where they’re generated using memory-mapped I/O and libsystemd APIs optimized for concurrent reading. Traditional platforms ship logs to centralized clusters, adding network latency plus cluster processing time. Netdata leverages OS page cache optimization and parallel file reading to deliver sub-second responses on million+ entry datasets. During incidents, engineers iterate rapidly instead of waiting for results.
Traditional platforms sample limited log entries before timeout to maintain query speed, creating statistical uncertainty. Netdata’s intelligent sampling algorithm evaluates significantly more entries, achieving dramatically tighter confidence intervals. This means you see actual prevalence of issues during troubleshooting, not rough estimates. Every field is indexed automatically, so filtering accuracy is substantially higher.
Yes. Netdata supports Windows Event Logs (WEL), Event Tracing for Windows (ETW), and TraceLogging natively via windows-events.plugin. All Windows event channels are auto-discovered with the same unified interface as Linux journals. System fields are indexed for fast filtering; user fields support full-text search. Complete enterprise Windows coverage including Active Directory, IIS, Hyper-V, and SQL Server.
Yes, using standard systemd-journal-upload/remote tools. Netdata automatically detects remote journals and provides unified views with namespace isolation for multi-tenancy. Alternatively, Netdata Cloud federates queries across distributed Agents/Parents without requiring log centralization. Both approaches work - choose based on your requirements for local troubleshooting vs centralized compliance.
Netdata provides complete data sovereignty - logs never leave your infrastructure - satisfying GDPR, HIPAA, and PCI DSS data residency requirements automatically. Forward Secure Sealing provides cryptographic tamper detection with sealing keys regenerated via non-reversible process and verification keys stored off-system. This provides tamper-evident storage that satisfies audit requirements for HIPAA, PCI DSS, and SOX.
Yes. Netdata’s otel-plugin receives OTLP gRPC logs and converts them to systemd-journal format using a pure Rust journal writer. This works cross-platform (Linux, Windows, macOS, FreeBSD) and integrates seamlessly with existing logs via the same query interface. Your OpenTelemetry instrumentation remains portable while gaining Netdata’s superior query performance and cost efficiency.
log2journal converts text logs, JSON, or logfmt into systemd-journal format. Define patterns using PCRE2 regex to extract fields, map to journal fields, enrich with severity and correlation IDs, and output as structured journal entries. Ships with nginx and Apache patterns; supports custom patterns for any log format. Legacy applications with text logs become fully structured and searchable without application changes.
Yes. Netdata reads journal files non-destructively, so existing log platforms continue working. Many customers use Netdata for real-time troubleshooting (sub-second queries, native metrics correlation) while keeping Elasticsearch for long-term analytics or Splunk for security operations. It’s complementary, not competitive - use Netdata where speed matters, existing tools for historical analysis.
Minimal. The systemd-journal.plugin uses memory-mapped I/O and libsystemd APIs optimized for concurrent reading. Query overhead is typically very low CPU, bounded by disk I/O. Real-time streaming (PLAY mode) uses minimal CPU continuously. Storage overhead: journal files match or exceed text log compression efficiency with ZSTD/LZ4 compression.
Metrics and logs come from the same Netdata Agent, sharing labels like _HOSTNAME, _BOOT_ID, _SYSTEMD_UNIT, and CONTAINER_NAME. Click any metric anomaly to query logs for the same timeframe automatically - same source, same timeline, zero timestamp matching. The global datetime picker affects both metrics and logs simultaneously. Anomaly ribbons on metric charts correlate with log ERROR spikes, providing unified troubleshooting without tool switching.
Retention is limited only by available disk space. Configure retention per node based on disk capacity using systemd-journal settings (size, time, or count limits). Journal format with ZSTD/LZ4 compression enables years of data in gigabytes instead of terabytes. No hot/cold tiers - all data equally fast via OS page cache optimization. For centralized deployments, use standard systemd-journal-remote with configurable retention policies.
No. Netdata provides point-and-click filtering and full-text search without query languages. Select fields from dropdowns, enter search terms, apply filters - the interface generates queries automatically. This eliminates the learning curve of LogQL (Loki), SPL (Splunk), or Elasticsearch DSL while providing powerful analysis capabilities. Engineers troubleshoot problems instead of learning query syntax.
Every field is indexed automatically with unlimited cardinality support. Dynamic fields like ephemeral container IDs, session tokens, and request IDs work natively without clustering failures or performance degradation. This is critical for Kubernetes environments where labels change constantly. Traditional platforms impose cardinality limits or require careful label selection - Netdata eliminates these constraints entirely.
Logs management is included in base Netdata pricing with predictable per-node rates and volume discounts. No additional charges for log volume, retention, or queries. Unlimited fields, unlimited cardinality, unlimited queries - all included. This contrasts with traditional platforms charging separately for ingestion, indexing, storage, and queries.
Three-phase approach: (1) Deploy Netdata alongside existing platform (non-disruptive), (2) Run side-by-side for 2-4 weeks proving value, (3) Gradually shift teams to Netdata as confidence builds. Since Netdata auto-discovers logs, migration is primarily training. Many customers maintain both initially - Netdata for real-time troubleshooting, existing tools for long-term analytics - then consolidate after proving ROI.