 |
VOOZH | about |
|
VOOZH | about |
The only agent that thinks for itself
Autonomous Monitoring with self-learning AI built-in, operating independently across your entire stack.
Centralized metrics streaming and storage
Aggregate metrics from multiple agents into centralized Parent nodes for unified monitoring across your infrastructure.
Fully managed cloud platform
Access your monitoring data from anywhere with our SaaS platform. No infrastructure to manage, automatic updates, and global availability.
Deploy Netdata Cloud in your infrastructure
Run the full Netdata Cloud platform on-premises for complete data sovereignty and compliance with your security policies.
Powerful, intuitive monitoring interface
Modern, responsive UI built for real-time troubleshooting with customizable dashboards and advanced visualization capabilities.
Monitor on the go
Native iOS and Android apps bring full monitoring capabilities to your mobile device with real-time alerts and notifications.
The future of infrastructure observability
See our strategic direction across AI-native observability, full-stack signals, operational intelligence, and enterprise platform maturity.
Best energy efficiency
True real-time per-second
100% automated zero config
Centralized observability
Multi-year retention
High availability built-in
Zero maintenance
Always up-to-date
Enterprise security
Complete data control
Air-gap ready
Compliance certified
Millisecond responsiveness
Infinite zoom & pan
Works on any device
Native performance
Instant alerts
Monitor anywhere
AI-native observability
Continuous delivery
Open source foundation
80% Faster Incident Resolution
True Real-Time and Simple, even at Scale
90% Cost Reduction, Full Fidelity
See and Map Your Entire Network
Single Pane of Glass
Control Without Surrender
Integrations
800+ collectors and notification channels, auto-discovered and ready out of the box.
Reduced monitoring costs by 46% while cutting staff overhead by 67%.
— Leonardo Antunez, Codyas
No data shipping. No central storage costs. Query at the edge.
So many out-of-the-box features! I mostly don't have to develop anything.
— Simon Beginn, LANCOM Systems
Point-and-click troubleshooting. No PromQL, no LogQL, no learning curve.
Enterprise efficiency without enterprise complexity—real ROI from day one.
— Leonardo Antunez, Codyas
Zero data egress. Only metadata reaches the cloud. Your metrics stay on your infrastructure.
Auto-discovered and configured. No manual setup required.
Slack, PagerDuty, Teams, email, webhooks—all built-in.
Built for the People Who Get Paged
Every Industry Has Rules. We Master Them.
Monitor Any Technology. Configure Nothing.
Complete Visibility. Total Control.
Don't Take Our Word for It
Netdata gives more than you invest in it. A rare unicorn that obeys the Pareto rule.
— Eduard Porquet Mateu, TMB Barcelona
Reduced website downtime by 99% and cloud bill by 30% using Netdata alerts.
— Falkland Islands Government
Optimized resource allocation based on Netdata alerts cut cloud spending by 30%.
— Falkland Islands Government
Reduced monitoring staff by 67% while cutting operational costs by 46%.
— Codyas
Netdata has agent capacity or a plugin for everything, including Windows and Kubernetes.
— Eduard Porquet Mateu, TMB Barcelona
So many out-of-the-box features! I mostly don't have to develop anything.
— Simon Beginn, LANCOM Systems
From 2-3 minutes to 30 seconds—instant visibility into any node issue.
— Matthew Artist, Nodecraft
20% less downtime and 40% budget optimization from out-of-the-box monitoring.
— Simon Beginn, LANCOM Systems
Pay per Node. Unlimited Everything Else.
One price per node. Unlimited metrics, logs, users, and retention. No per-GB surprises.
What's Your Monitoring Really Costing You?
Most teams overpay by 40-60%. Let's find out why.
Your Infrastructure Is Unique. Let's Talk.
Because monitoring 10 nodes is different from monitoring 10,000.
Monitoring That Sells Itself
Deploy in minutes. Impress clients in hours. Earn recurring revenue for years.
Per-Second Metrics at Homelab Prices
Same engine, same dashboards, same ML. Just priced for tinkerers.
$1,000 Per Referral. Unlimited Referrals.
Your colleagues get 10% off. You get 10% commission. Everyone wins.
"Netdata's significant positive impact" — LANCOM Systems
Compare vs Datadog, Grafana, Dynatrace
"Cut costs by 46%, staff by 67%" — Codyas
"Reduced cloud bill by 30%" — Falkland Islands Gov
"Better observability with Netdata than combining other tools." — TMB Barcelona
DPA, SLAs, on-prem, volume pricing
One command, 30 seconds, real data—no sandbox needed
Auto-config + per-node pricing = predictable profit
8-episode Netdata tutorial by LearnLinux.tv
3rd most starred monitoring project
Customers report 40-67% cost cuts, 99% downtime reduction
Free tier lets them try before they buy
AI Support Assistant, Available 24/7
Nedi has access to all official documentation, source code, and resources. Ask any question about Netdata—responds in your language.
Engineering Insights & Product Updates
Jun 2026
Fleet observability: how to monitor …
It feels less like managing devices and more …
Jun 2026
Network Monitoring, the Netdata Way: …
Interface counters tell you a port is busy. …
Jun 2026
5 Best SolarWinds Alternatives for 2026
As organizations modernize their …
Jun 2026
SolarWinds Price Increases 2026: What …
If you’re a SolarWinds customer facing …
Never Fight Fires Alone
Docs, community, and expert help—pick your path to resolution.
60 Seconds to First Dashboard
One command to install. Zero config. 850+ integrations documented.
Level Up Your Monitoring
76,000+ Engineers Strong
Per-Second. 90% Cheaper. Data Stays Home.
See why teams switch from Datadog, Prometheus, Grafana, and more.
> Browse all comparisonsTrace issues directly in the source code
Get architecture recommendations
One of the most popular open-source monitoring projects
Enterprise-grade security and compliance
Your metrics stay on your infrastructure
"Most energy-efficient monitoring solution" — ICSOC 2023, peer-reviewed
"Doesn't miss alerts—mission-critical trust for safety software"
Global community improving monitoring for everyone
Trusted by teams worldwide
Free forever, fully open source agent
Work from anywhere, async-friendly culture
Your work helps millions of systems
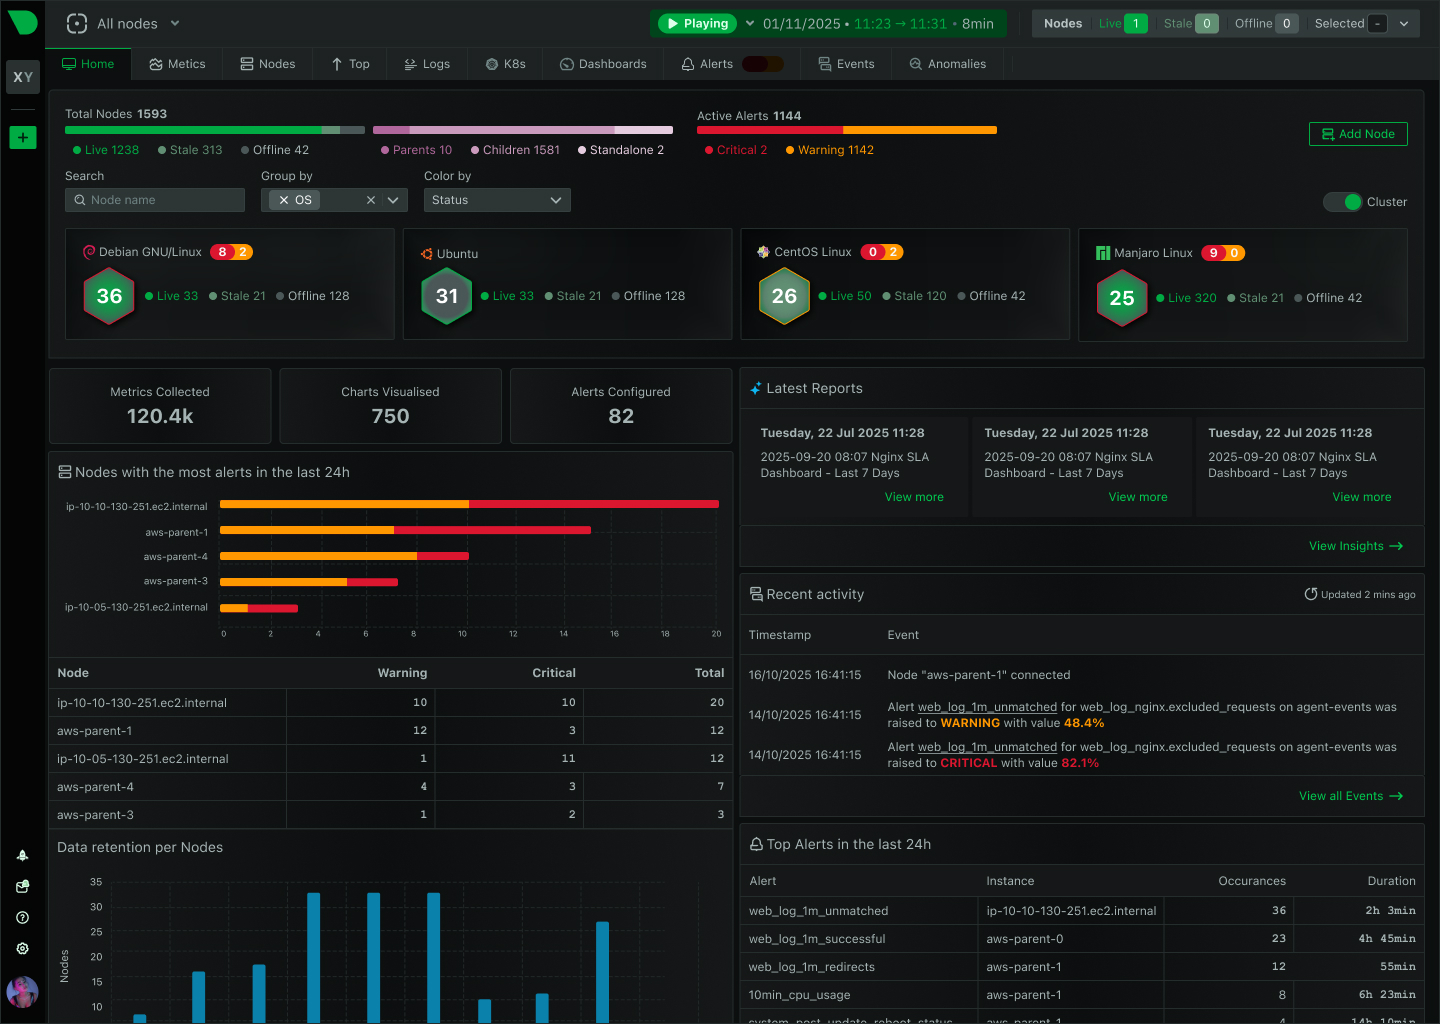
Netdata runs directly on each robot, collecting per-second metrics for CPU, memory, storage, thermals, network, and processes. Your fleet stays observable on intermittent site Wi-Fi, without shipping every metric to a costly central SaaS.
Edge-native by design. Each robot is its own monitoring system — collecting, storing, analyzing, and alerting locally.
CPU, memory, disk I/O, network, and processes collected every second on each robot, with zero sampling or aggregation.
18 unsupervised ML models train locally per metric, catching thermal throttling, memory leaks, and controller crashes on per-robot baselines.
Agents buffer locally during Wi-Fi or WAN drops and backfill Parents automatically when links return. No data loss, no blind spots.
Ask AI explains alerts in plain language, identifies root causes across the fleet, and maps blast radius from within the dashboard.
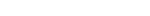
Netdata Cloud aggregates metadata across thousands of robots with distributed queries on demand. See every site and robot type in one view.
All telemetry stays on your robots and regional Parents. Only metadata reaches Netdata Cloud. Full data sovereignty by design.
Trusted by fleet operators and engineering teams worldwide
1-second granularity, zero sampling
Explore infrastructure monitoring
Zero data loss during network partitions
Explore edge fleet monitoring
18 ML models per metric, 99% false positive reduction
Discover anomaly detection
One platform replaces approximately seven tools
See troubleshooting features
90% cost reduction versus traditional monitoring stacks
View pricing philosophy
Architecture comparison
Shipping every metric from thousands of robots to a centralized SaaS is economically and technically wrong for this workload. Netdata distributes the code instead of centralizing the data.
Capability
Netdata
Centralized SaaS / Traditional Tools
Data residency
✅ Edge-Resident by Design
All telemetry stays on robots and Parents
❌ Centralized Ingestion
All metrics shipped to vendor cloud
Network resilience
✅ Store and Forward
Buffers locally, backfills on reconnect
❌ Data Loss on Disconnect
Blind spots during WAN or Wi-Fi drops
Metric granularity
✅ Per-Second, No Sampling
1s collection across all metrics
⚠️ 10 to 60 Second Intervals
Averaged, sampled, or batched data
Anomaly detection
✅ Edge ML Every Metric
18 models per metric, trained locally
⚠️ Centralized or Manual
Requires cloud processing or thresholds
Pricing model
✅ Per-Node, Predictable
Scales linearly with fleet size
❌ Volume-Based Pricing
Costs explode with data volume
Agent footprint
✅ Under 5 Percent CPU
150MB RAM, optimized for edge hardware
⚠️ Heavy Agents
Compete with robot workloads for resources
Fleet dashboards
✅ Unified via Metadata
Distributed queries, data stays local
⚠️ Centralized Database
All data must travel to one location
Remote troubleshooting
✅ Console Tools in Browser
Functions replace SSH with full history
❌ SSH Into Each Device
Manual access, no historical context
Log management
✅ Direct Journal Access
No pipeline, no ingestion fees
❌ Centralized Log Pipeline
Expensive shipping and indexing infrastructure
Scalability
✅ Linear, Unlimited
Add robots without architectural changes
⚠️ Exponential Complexity
Central bottlenecks require constant scaling
Every robot collects CPU, memory, disk I/O, network, processes, GPU, and thermal sensors at 1-second granularity — directly on the device, with zero sampling.
1-second collection, zero sampling, zero configuration
Learn about real-time monitoringAgents buffer locally during connectivity drops and stream to regional Parents when links return. Parents cluster for high availability and maintain longer retention.
Zero data loss during network partitions
Explore edge fleet monitoring18 unsupervised ML models train locally on every metric, learning each robot's unique behavioral baseline and flagging anomalies in real time.
99% false positive reduction through model consensus
Discover anomaly detectionNetdata Cloud unifies thousands of robots with distributed queries on demand. Group by site, robot type, or status — all without moving bulk telemetry.
Metadata only in the cloud, data stays at the edge
Explore Netdata CloudNetdata Functions replace SSH with in-dashboard console tools — processes, network connections, systemd units, and more — with full history and ML context.
One platform replaces approximately seven tools
See troubleshooting featuresEach Netdata Agent runs locally on the robot, collecting and storing metrics independently. During network drops, agents buffer data locally and automatically backfill regional Parents when connectivity returns. Your fleet maintains full observability even on intermittent site networks. Learn more on our edge fleet monitoring page.
Netdata auto-discovers and collects per-second CPU, memory, disk I/O, storage, network interfaces, per-process resource usage, systemd services, thermal sensors, GPU metrics where present via NVIDIA and AMD collectors, and battery or power telemetry exposed by the OS. Over 800 integrations work out of the box with zero configuration.
Yes. Netdata provides per-second GPU metrics including utilization, memory, temperature, power consumption, and PCIe bandwidth for NVIDIA and AMD GPUs. See our AI and ML industry page for more on edge AI workload monitoring.
Netdata trains 18 unsupervised ML models locally on every metric for every robot. Each robot learns its own behavioral baseline, so anomalies are detected relative to that specific device’s normal patterns — not a fleet-wide average. This catches per-robot issues like thermal throttling or memory leaks that fleet averages would hide.
The Netdata Agent typically uses less than 5% of a single CPU core and 150-200 MB of RAM, including machine learning. Agents can be further reduced to under 2% CPU and approximately 100 MB RAM in child mode, where ML training and storage are offloaded to Parents.
Netdata uses simple per-node pricing with P90 billing protection — you pay for sustained usage, not temporary spikes. Agents are free and open source. Costs scale linearly with your fleet, not with data volume or metric count. See our pricing page for details.
No. Netdata generates dashboards algorithmically based on the metrics each robot exposes. Different robot types with different hardware automatically get appropriate visualizations. No query languages, no manual dashboard building, no specialized skills required.
Yes. Netdata Functions surface console-grade tools inside the dashboard — process tables, network connections, systemd units, disk usage, and more. Operators get the same per-second precision as SSH debugging, but with full history, ML context, and no direct device access.
Netdata reads systemd-journal files directly on each robot, with no separate log pipeline, ingestion server, or shipping infrastructure. Every field in every log entry is automatically indexed and searchable. This delivers up to 90% cost reduction compared to centralized log management platforms.
The Netdata Agent restarts in 2-3 seconds and resumes collection immediately. Systemd-journal logs capture crash events and core dumps. ML anomaly detection flags the behavioral shift. Parents retain historical data, so operators can compare pre- and post-restart states across the fleet.
Yes. Netdata exports metrics to Prometheus, Grafana, InfluxDB, Graphite, and OpenTSDB. It supports OpenTelemetry for metrics and logs. Alert notifications route to PagerDuty, Slack, Discord, email, webhooks, and 20+ other platforms. Netdata augments existing workflows rather than forcing a rip-and-replace.
The parent-child streaming architecture scales linearly. Deploy regional Parents near each site to aggregate streams from hundreds of robots. Netdata Cloud provides unified fleet dashboards and distributed queries across all Parents. Adding robots never degrades existing performance — there is no central bottleneck.
No. All metrics and logs stay on your robots and regional Parents. Netdata Cloud receives only metadata — node names, chart definitions, alert configurations — for unified dashboards. For air-gapped or fully on-premises deployments, Netdata Cloud can run inside your datacenter.
Visit our edge monitoring academy page for a detailed explanation of edge-native observability, or explore our edge fleet monitoring use case for architecture patterns specific to distributed fleets.
June 23, 2026
Discover the top SolarWinds alternatives for 2026. Compare modern monitoring platforms built for cloud-native infrastructure - now with NPM-class network monitoring - with transparent pricing and real-time insights.
June 23, 2026
Understanding SolarWinds' subscription-only pricing changes following the Turn/River Capital acquisition, and exploring your options for infrastructure monitoring.
February 27, 2026
Connect AI coding agents like Claude Code, Codex, and Cursor to your entire infrastructure with a single endpoint. The Netdata Cloud MCP Server brings infrastructure-wide observability to any MCP-compatible AI tool.