 |
VOOZH | about |
|
VOOZH | about |
The only agent that thinks for itself
Autonomous Monitoring with self-learning AI built-in, operating independently across your entire stack.
Centralized metrics streaming and storage
Aggregate metrics from multiple agents into centralized Parent nodes for unified monitoring across your infrastructure.
Fully managed cloud platform
Access your monitoring data from anywhere with our SaaS platform. No infrastructure to manage, automatic updates, and global availability.
Deploy Netdata Cloud in your infrastructure
Run the full Netdata Cloud platform on-premises for complete data sovereignty and compliance with your security policies.
Powerful, intuitive monitoring interface
Modern, responsive UI built for real-time troubleshooting with customizable dashboards and advanced visualization capabilities.
Monitor on the go
Native iOS and Android apps bring full monitoring capabilities to your mobile device with real-time alerts and notifications.
The future of infrastructure observability
See our strategic direction across AI-native observability, full-stack signals, operational intelligence, and enterprise platform maturity.
Best energy efficiency
True real-time per-second
100% automated zero config
Centralized observability
Multi-year retention
High availability built-in
Zero maintenance
Always up-to-date
Enterprise security
Complete data control
Air-gap ready
Compliance certified
Millisecond responsiveness
Infinite zoom & pan
Works on any device
Native performance
Instant alerts
Monitor anywhere
AI-native observability
Continuous delivery
Open source foundation
80% Faster Incident Resolution
True Real-Time and Simple, even at Scale
90% Cost Reduction, Full Fidelity
See and Map Your Entire Network
Single Pane of Glass
Control Without Surrender
Integrations
800+ collectors and notification channels, auto-discovered and ready out of the box.
Reduced monitoring costs by 46% while cutting staff overhead by 67%.
— Leonardo Antunez, Codyas
No data shipping. No central storage costs. Query at the edge.
So many out-of-the-box features! I mostly don't have to develop anything.
— Simon Beginn, LANCOM Systems
Point-and-click troubleshooting. No PromQL, no LogQL, no learning curve.
Enterprise efficiency without enterprise complexity—real ROI from day one.
— Leonardo Antunez, Codyas
Zero data egress. Only metadata reaches the cloud. Your metrics stay on your infrastructure.
Auto-discovered and configured. No manual setup required.
Slack, PagerDuty, Teams, email, webhooks—all built-in.
Built for the People Who Get Paged
Every Industry Has Rules. We Master Them.
Monitor Any Technology. Configure Nothing.
Complete Visibility. Total Control.
Don't Take Our Word for It
Netdata gives more than you invest in it. A rare unicorn that obeys the Pareto rule.
— Eduard Porquet Mateu, TMB Barcelona
Reduced website downtime by 99% and cloud bill by 30% using Netdata alerts.
— Falkland Islands Government
Optimized resource allocation based on Netdata alerts cut cloud spending by 30%.
— Falkland Islands Government
Reduced monitoring staff by 67% while cutting operational costs by 46%.
— Codyas
Netdata has agent capacity or a plugin for everything, including Windows and Kubernetes.
— Eduard Porquet Mateu, TMB Barcelona
So many out-of-the-box features! I mostly don't have to develop anything.
— Simon Beginn, LANCOM Systems
From 2-3 minutes to 30 seconds—instant visibility into any node issue.
— Matthew Artist, Nodecraft
20% less downtime and 40% budget optimization from out-of-the-box monitoring.
— Simon Beginn, LANCOM Systems
Pay per Node. Unlimited Everything Else.
One price per node. Unlimited metrics, logs, users, and retention. No per-GB surprises.
What's Your Monitoring Really Costing You?
Most teams overpay by 40-60%. Let's find out why.
Your Infrastructure Is Unique. Let's Talk.
Because monitoring 10 nodes is different from monitoring 10,000.
Monitoring That Sells Itself
Deploy in minutes. Impress clients in hours. Earn recurring revenue for years.
Per-Second Metrics at Homelab Prices
Same engine, same dashboards, same ML. Just priced for tinkerers.
$1,000 Per Referral. Unlimited Referrals.
Your colleagues get 10% off. You get 10% commission. Everyone wins.
"Netdata's significant positive impact" — LANCOM Systems
Compare vs Datadog, Grafana, Dynatrace
"Cut costs by 46%, staff by 67%" — Codyas
"Reduced cloud bill by 30%" — Falkland Islands Gov
"Better observability with Netdata than combining other tools." — TMB Barcelona
DPA, SLAs, on-prem, volume pricing
One command, 30 seconds, real data—no sandbox needed
Auto-config + per-node pricing = predictable profit
8-episode Netdata tutorial by LearnLinux.tv
3rd most starred monitoring project
Customers report 40-67% cost cuts, 99% downtime reduction
Free tier lets them try before they buy
AI Support Assistant, Available 24/7
Nedi has access to all official documentation, source code, and resources. Ask any question about Netdata—responds in your language.
Engineering Insights & Product Updates
Jun 2026
Network Monitoring, the Netdata Way: …
Interface counters tell you a port is busy. …
Jun 2026
5 Best SolarWinds Alternatives for 2026
As organizations modernize their …
Jun 2026
SolarWinds Price Increases 2026: What …
If you’re a SolarWinds customer facing …
May 2026
High-cardinality metrics at scale: why …
The “high cardinality is …
Never Fight Fires Alone
Docs, community, and expert help—pick your path to resolution.
60 Seconds to First Dashboard
One command to install. Zero config. 850+ integrations documented.
Level Up Your Monitoring
76,000+ Engineers Strong
Per-Second. 90% Cheaper. Data Stays Home.
See why teams switch from Datadog, Prometheus, Grafana, and more.
> Browse all comparisonsTrace issues directly in the source code
Get architecture recommendations
One of the most popular open-source monitoring projects
Enterprise-grade security and compliance
Your metrics stay on your infrastructure
"Most energy-efficient monitoring solution" — ICSOC 2023, peer-reviewed
"Doesn't miss alerts—mission-critical trust for safety software"
Global community improving monitoring for everyone
Trusted by teams worldwide
Free forever, fully open source agent
Work from anywhere, async-friendly culture
Your work helps millions of systems
Ingest NetFlow v5/v7/v9, IPFIX, and sFlow v5 flow records on a single UDP port — enriched with GeoIP, ASN, NetBox, and BGP context at the edge. No packet capture, no separate appliance, no metered billing.
Everything you need to understand who is talking to whom on your network
Query live flow records over selectable time windows with instant dashboard updates — no batch processing or central database round-trips.
NetFlow v5/v7/v9, IPFIX, and sFlow v5 auto-detected on a single UDP listener — no per-protocol configuration or multiple collectors.
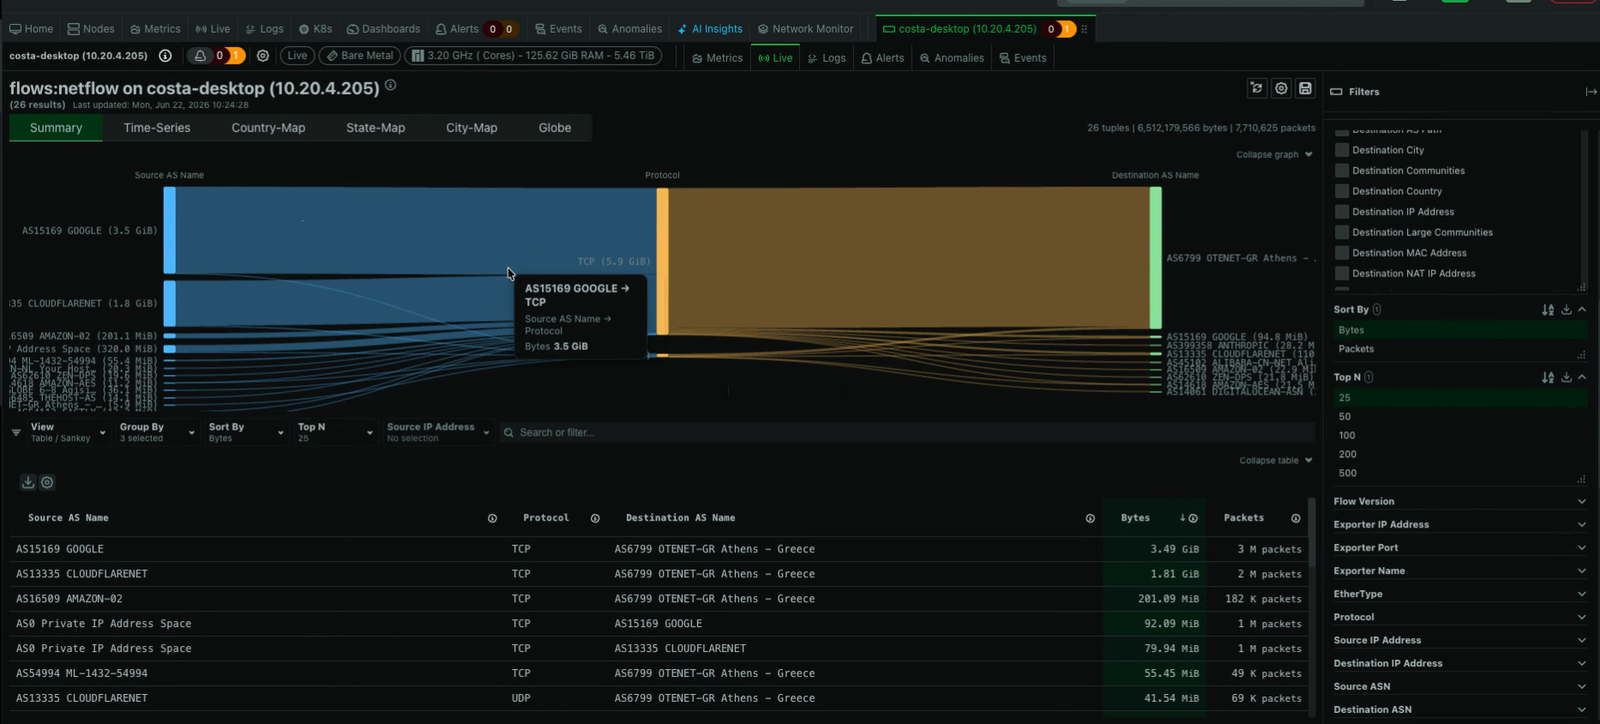
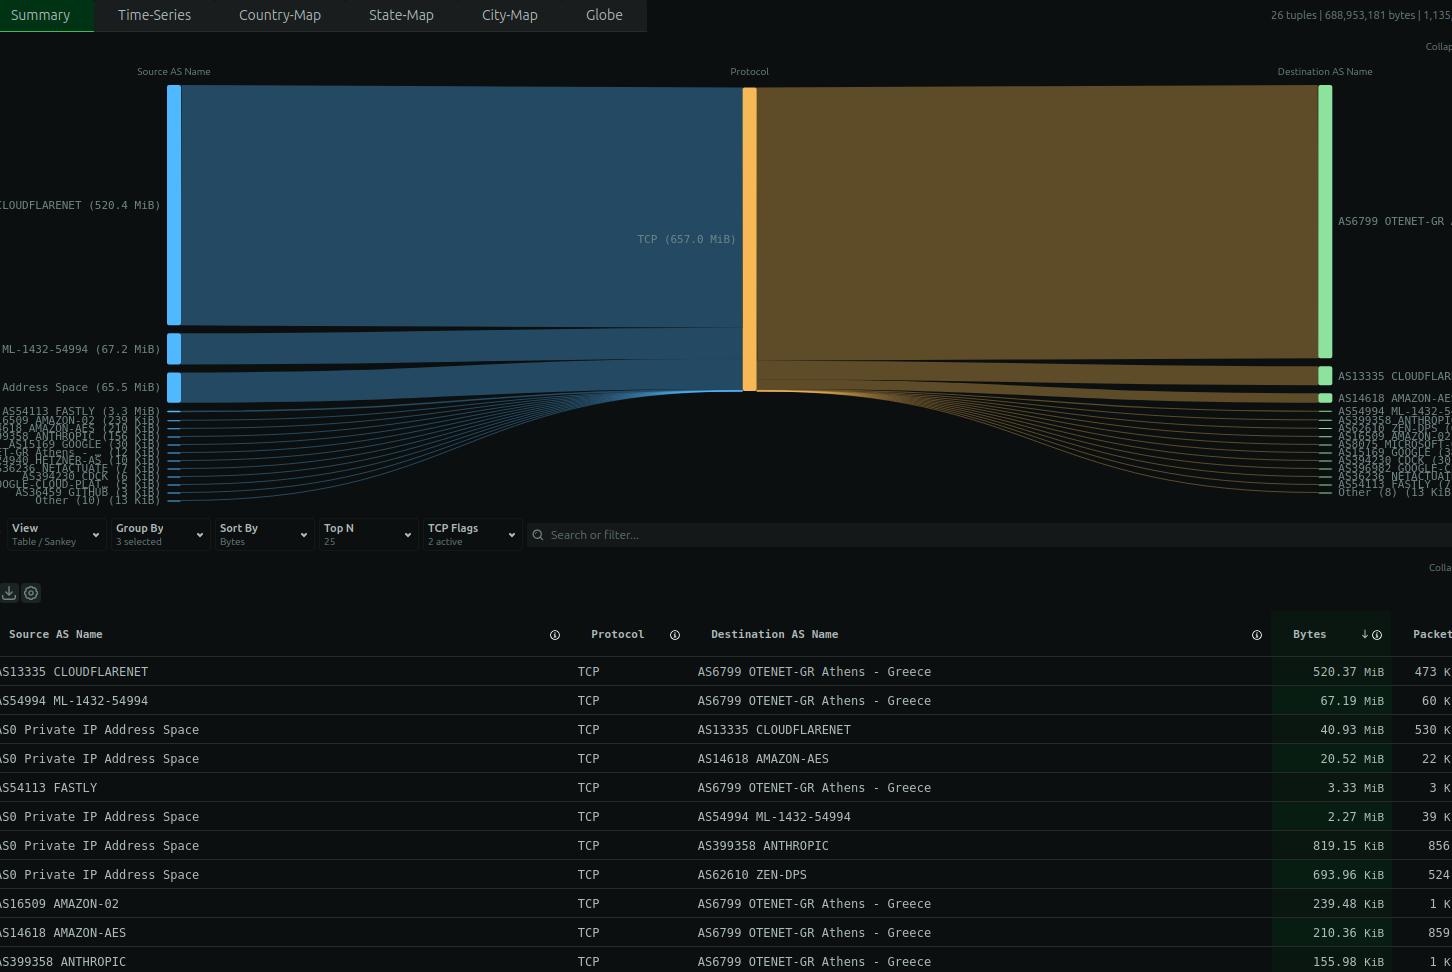
Interactive Sankey diagrams and sortable tables rank your top-N flows by bytes or packets, up to 500. Reorder the Sankey columns and add dimensions like TCP flags to see exactly how each conversation is built — across up to 10 group-by dimensions.
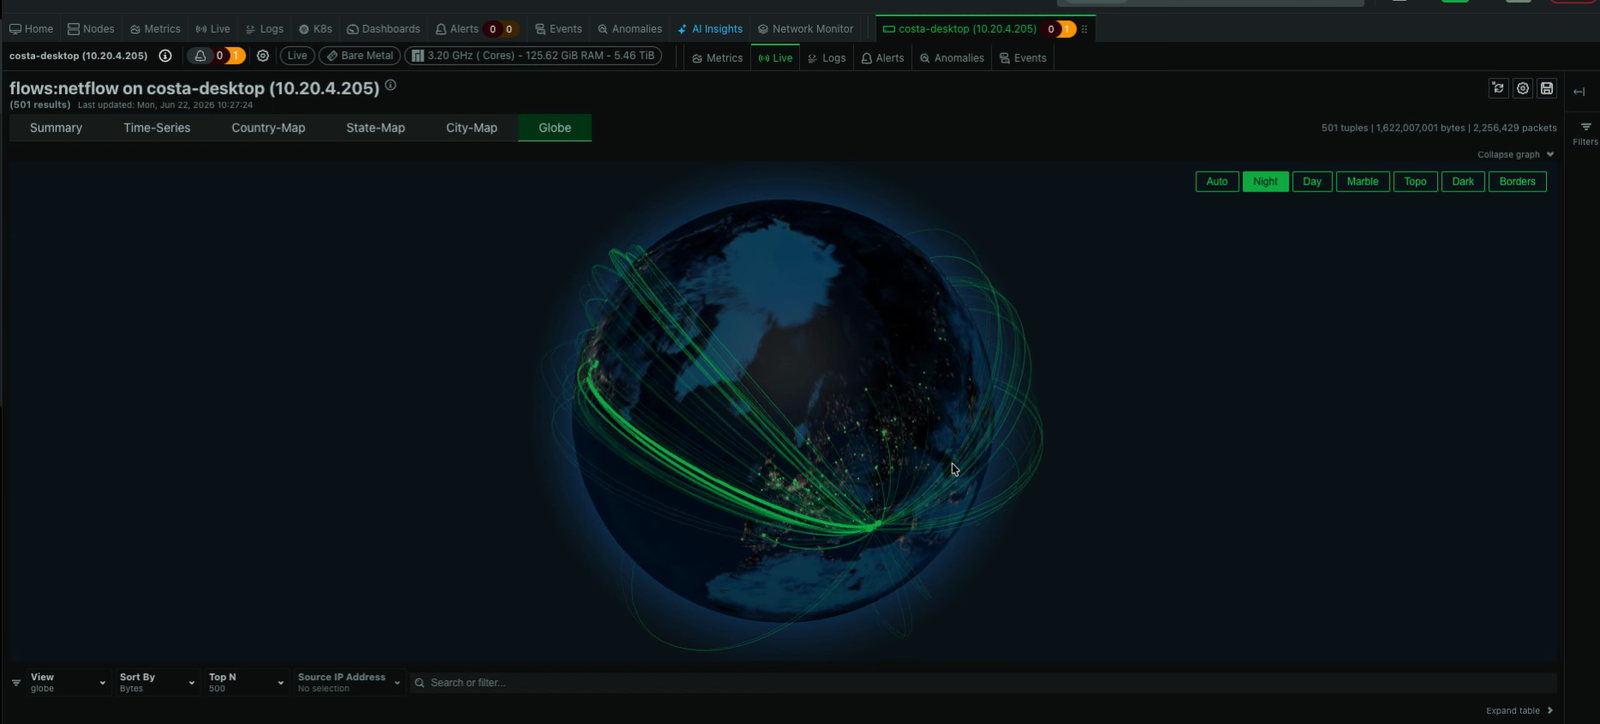
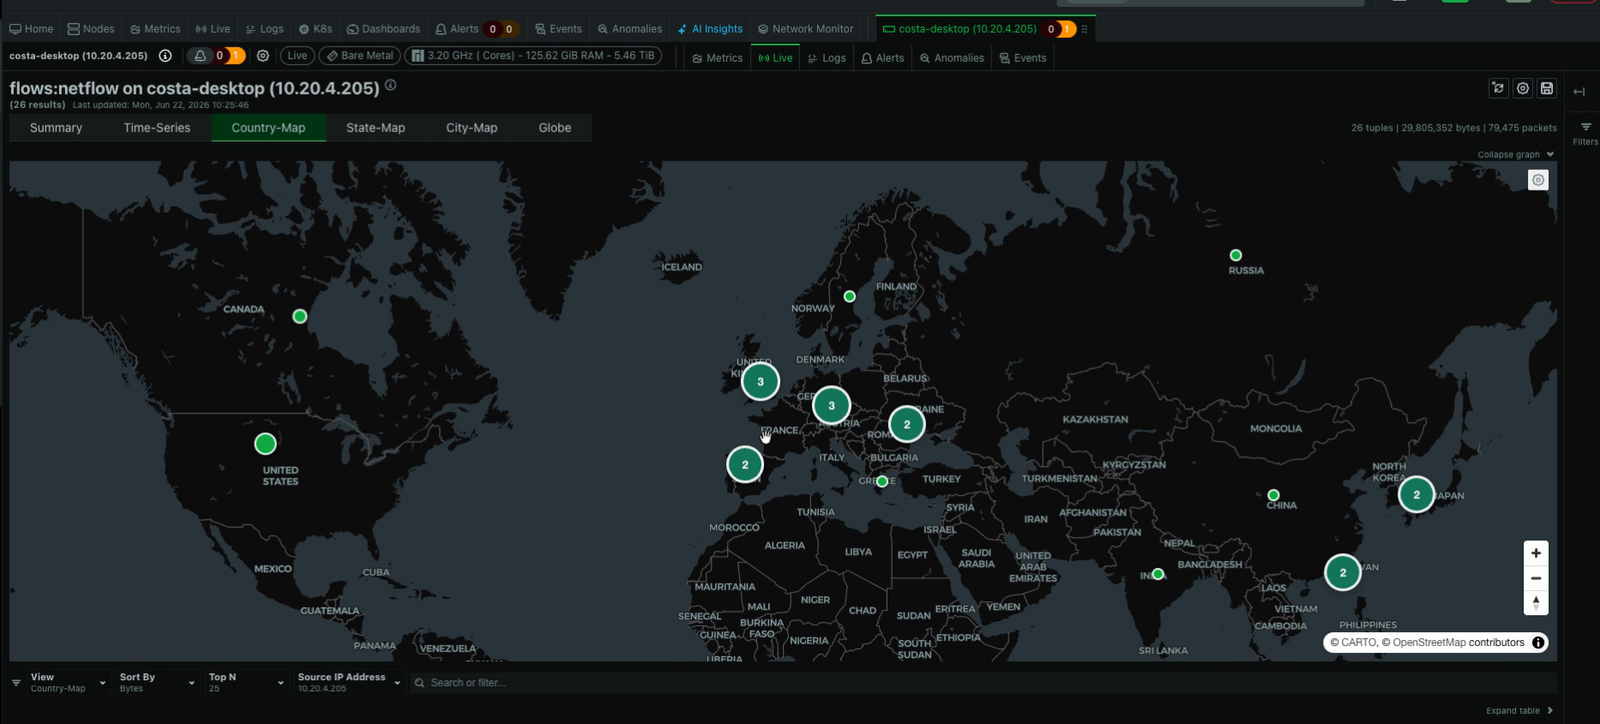
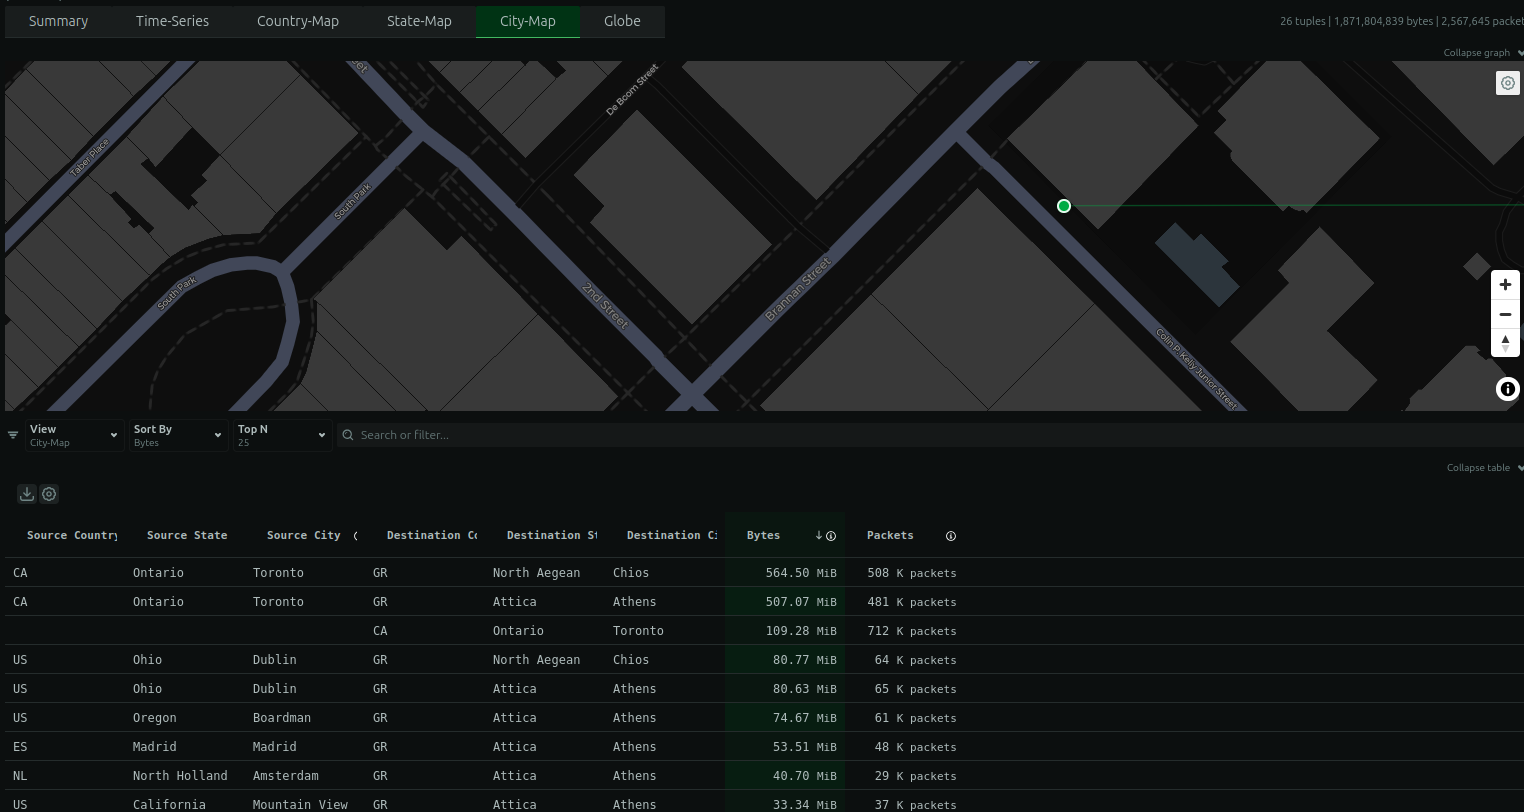
Country, state, and city-level maps plus a global traffic map visualize flow data enriched with GeoIP coordinates at no extra cost — zoom the city map down to street level to pinpoint a specific data center or facility.
GeoIP, ASN, NetBox/IPAM, cloud IP ranges, BGP routing, and classifier-based labeling transform raw IPs into meaningful context at ingest.
Analyze flow records your devices already export — no SPAN ports, TAPs, or packet capture infrastructure to deploy or maintain.
Trusted by network and operations teams worldwide
Up to 500 top-N flows
See Network Monitoring
GeoIP included free
Explore Topology Viewer
18 enrichment modules
Browse Flow Integrations
90+ flow fields tracked
Learn About Agents
Netdata vs. Standalone Flow Analyzers
Built into the same agent that monitors your infrastructure — no separate appliance, no metered flow-volume billing, no tool-switching.
Capability
Netdata
Traditional Flow Tools
Architecture
How flows are collected and processed
✅ Edge-native in-agent
Flows processed where data is generated
⚠️ Separate collector appliance
Dedicated flow collector infrastructure required
Protocol Support
NetFlow, IPFIX, sFlow coverage
✅ Multi-protocol one port
Auto-detected on single UDP listener
⚠️ Per-protocol or limited
Often requires separate collectors per protocol
Packet Capture
SPAN, TAP, or pcap requirements
✅ Flow records only
No SPAN ports or packet capture needed
❌ Often requires pcap
Deep packet inspection infrastructure expected
Enrichment
GeoIP, ASN, NetBox, BGP context
✅ Included at edge
Applied automatically at ingestion time
⚠️ Add-on modules
Extra licensing or manual configuration
Unified Platform
Flows alongside metrics and logs
✅ Fully unified
Flows, metrics, logs, SNMP in one dashboard
❌ Standalone tool
Separate flow analyzer alongside other tools
Pricing Model
How cost scales with traffic
✅ Per-node included
No metered flow-volume billing
❌ Volume-metered
Costs increase with flow volume processed
Scalability
How it grows with infrastructure
✅ Distributed agents
Scale horizontally with Parents and Cloud
⚠️ Central database
Scaling requires bigger central infrastructure
Visualize aggregated flow conversations as interactive Sankey diagrams paired with sortable tables — ranked by bytes or packets, selectable top-N from 25 to 500. Reorder the columns and add dimensions like TCP flags to see exactly how each conversation is built.
See who is talking to whom, instantly
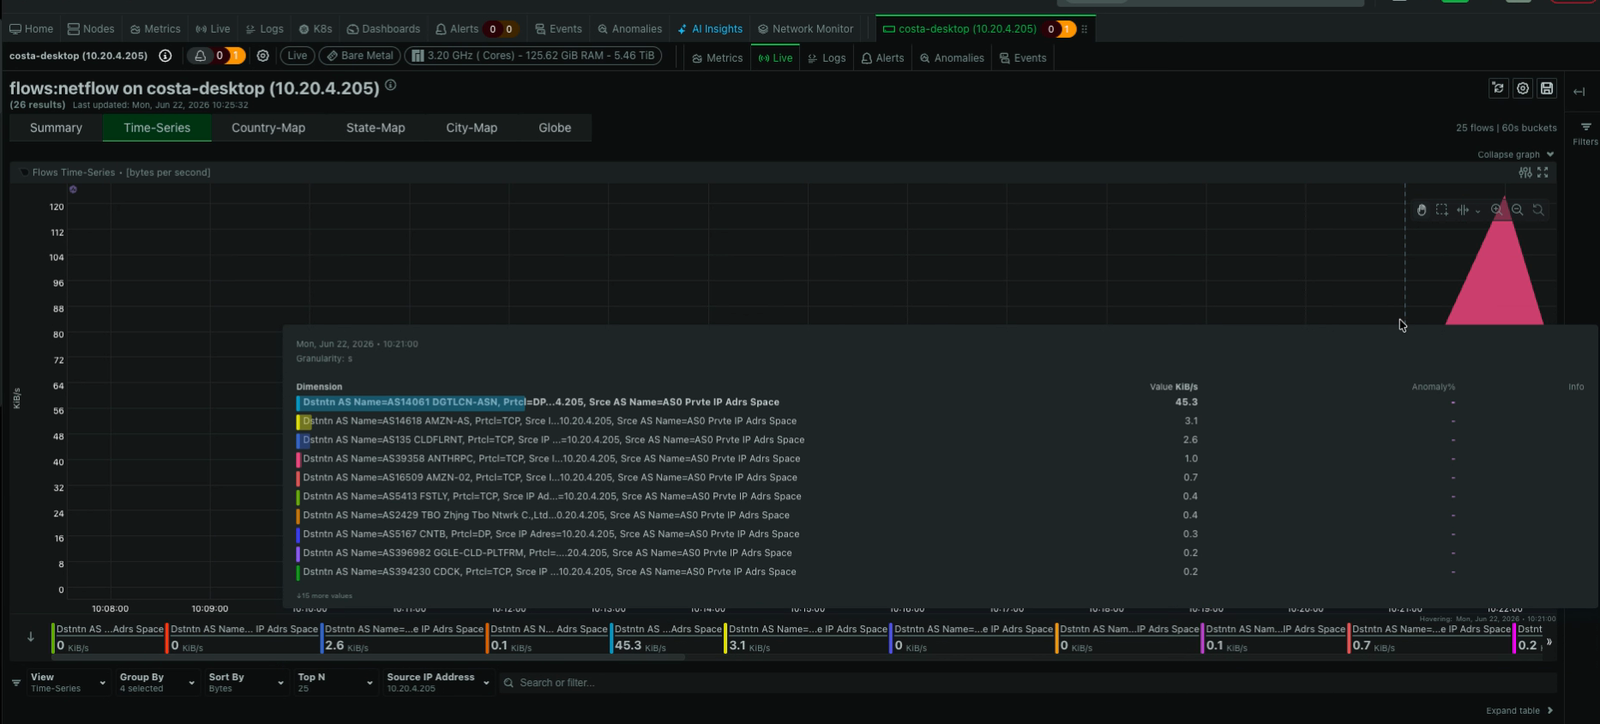
View Network MonitoringTrack top-N flows across selectable time windows with stacked area charts showing bytes per second or packets per second, revealing microbursts and trends.
Catch bandwidth spikes the moment they form
Explore Anomaly DetectionCountry, state, and city-level maps plus a global traffic map render flows enriched with GeoIP coordinates. Zoom the city map all the way down to street level to land on a specific data center or cloud region.
From worldwide down to the street
See Topology ViewerFacet selections with autocomplete, free-text regex search, and up to 10 group-by dimensions let you slice any flow dataset with point-and-click precision.
Find any conversation in seconds
Browse Flow IntegrationsGeoIP, ASN, NetBox, cloud IP ranges, BGP routing, and classifier rules automatically tag every flow with meaningful labels — no post-processing required.
Raw CIDRs become meaningful names automatically
Learn About AgentsWhat makes Netdata flow analysis fundamentally different
NetFlow v5/v7/v9, IPFIX, and sFlow v5 on one UDP port, auto-detected with zero per-protocol configuration.
Top-N flow conversations visualized as Sankey diagrams with sortable tables, selectable up to 500 entries.
Country, state, city maps and global traffic views with GeoIP enrichment included at no extra cost.
GeoIP, ASN, NetBox, BGP, cloud IP ranges, and classifiers transform raw IPs into meaningful labels at ingest.
No metered flow-volume billing — scale with agents, aggregate fleet-wide via Parents and Cloud.
Analyze flow records your devices already export — no SPAN, TAP, or pcap infrastructure required.
Netdata ingests NetFlow v5, v7, v9, IPFIX (NetFlow v10 / RFC 7011), and sFlow v5 flow records. All protocols are received on a single UDP listener (default port 2055) with automatic protocol detection from datagram headers — no per-protocol configuration required.
No. Netdata analyzes flow records that your network devices already export via NetFlow, IPFIX, or sFlow. There is no deep packet inspection or full packet capture — you get the who, what, and where of traffic without deploying any packet-capture infrastructure.
sFlow v5 uses statistical sampling, so byte and packet values in sFlow records are estimates rather than exact counts. Netdata processes sFlow flow samples (counter samples are not surfaced) and presents sampled data with appropriate context. sFlow VLAN information is available from ExtendedSwitch records.
Yes. You can group by up to 10 fields at once, including source/destination IP, port, protocol, ASN, AS name, country, state, city, VLAN, MAC address, BGP AS-path, MPLS labels, interface names, and more. The default grouping is Source AS Name, then Protocol, then Destination AS Name, which drives the Sankey diagram flow direction.
Flow records are stored in four disk-backed journal tiers: raw (full fidelity), 1-minute, 5-minute, and 1-hour rollups. Each tier has independent size and duration limits (defaults: 10 GB and 7 days per tier). Rollup tiers drop high-cardinality fields like raw IPs for compactness, while the raw tier preserves all detail.
Netdata’s ML anomaly detection runs on metrics across the entire platform — including network interface metrics and plugin health charts that the netflow-plugin emits. Flow records themselves are stored as journal entries. This means you get ML-powered anomaly detection on your network metrics alongside the flow analysis view, all within the same platform.
Each well-provisioned Netdata Agent handles approximately 50,000 to 100,000 sustained flow records per second. For larger deployments, distribute agents across your infrastructure and aggregate fleet-wide views through Netdata Parents and Netdata Cloud — this is the intended distributed architecture, not a workaround.
Packaged installs ship with a stock GeoIP and ASN database seed, providing country, state, city, and ASN enrichment with zero configuration. Additional enrichment modules include NetBox/IPAM integration, AWS/Azure/GCP cloud IP ranges, BGP routing via BMP or BioRIS, rule-based classifiers, static network metadata, and SRv6/VXLAN decapsulation — all applied at ingestion time.
June 24, 2026
Netdata has added NPM-class network monitoring: live topology maps, NetFlow and sFlow traffic analysis, SNMP device and trap monitoring, and a dedicated network dashboard, all unified with your full-stack observability and processed at the edge.
September 26, 2023
Ensuring Quality of Service with Advanced Network Insights
June 23, 2026
Discover the top SolarWinds alternatives for 2026. Compare modern monitoring platforms built for cloud-native infrastructure - now with NPM-class network monitoring - with transparent pricing and real-time insights.