 |
VOOZH | about |
|
VOOZH | about |
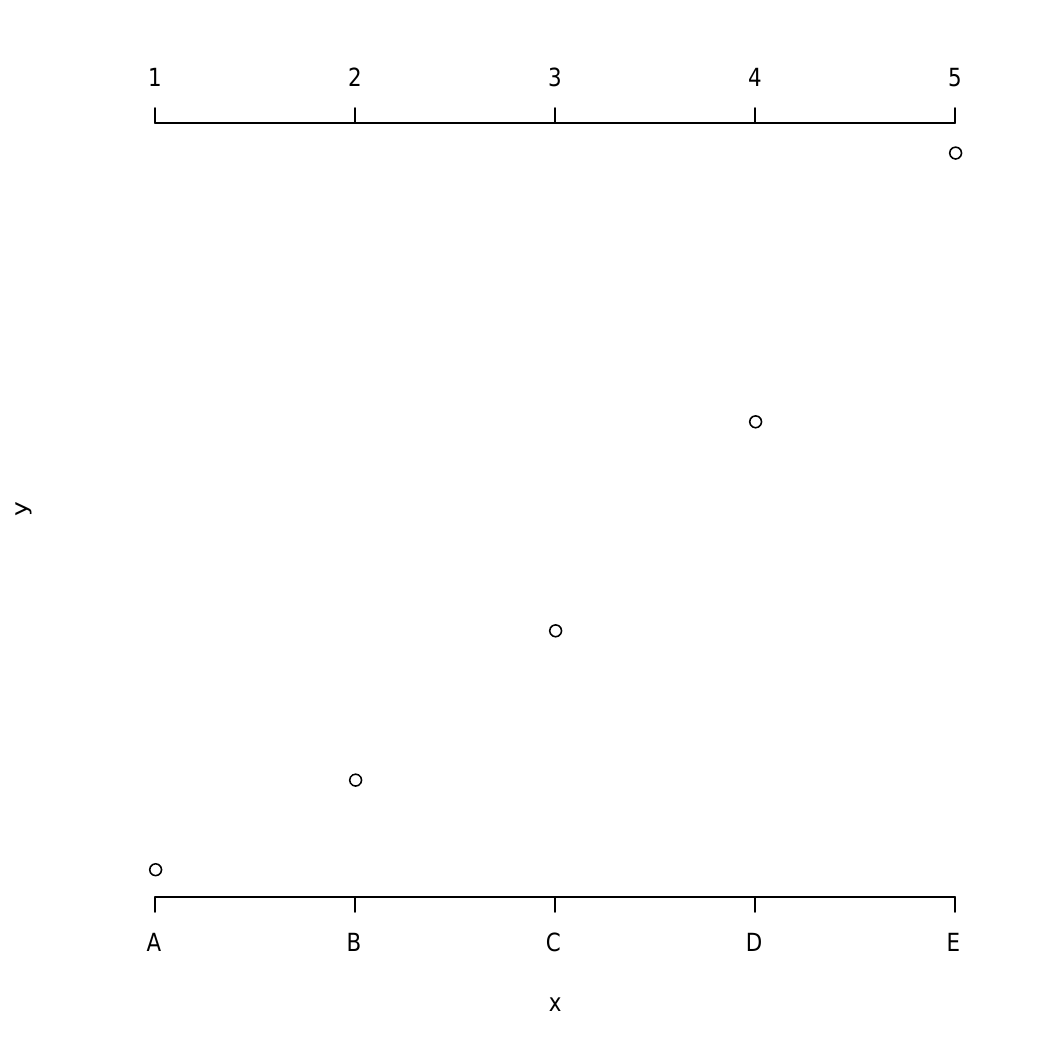
axis() function in R Language is to add axis to a plot. It takes side of the plot where axis is to be drawn as argument.
Syntax: axis(side, at=NULL, labels=TRUE) Parameters: side: It defines the side of the plot the axis is to be drawn on possible values such as below, left, above, and right. at: Point to draw tick marks labels: Specifies texts for tick-mark labels.Example 1: Output: 👁 Image
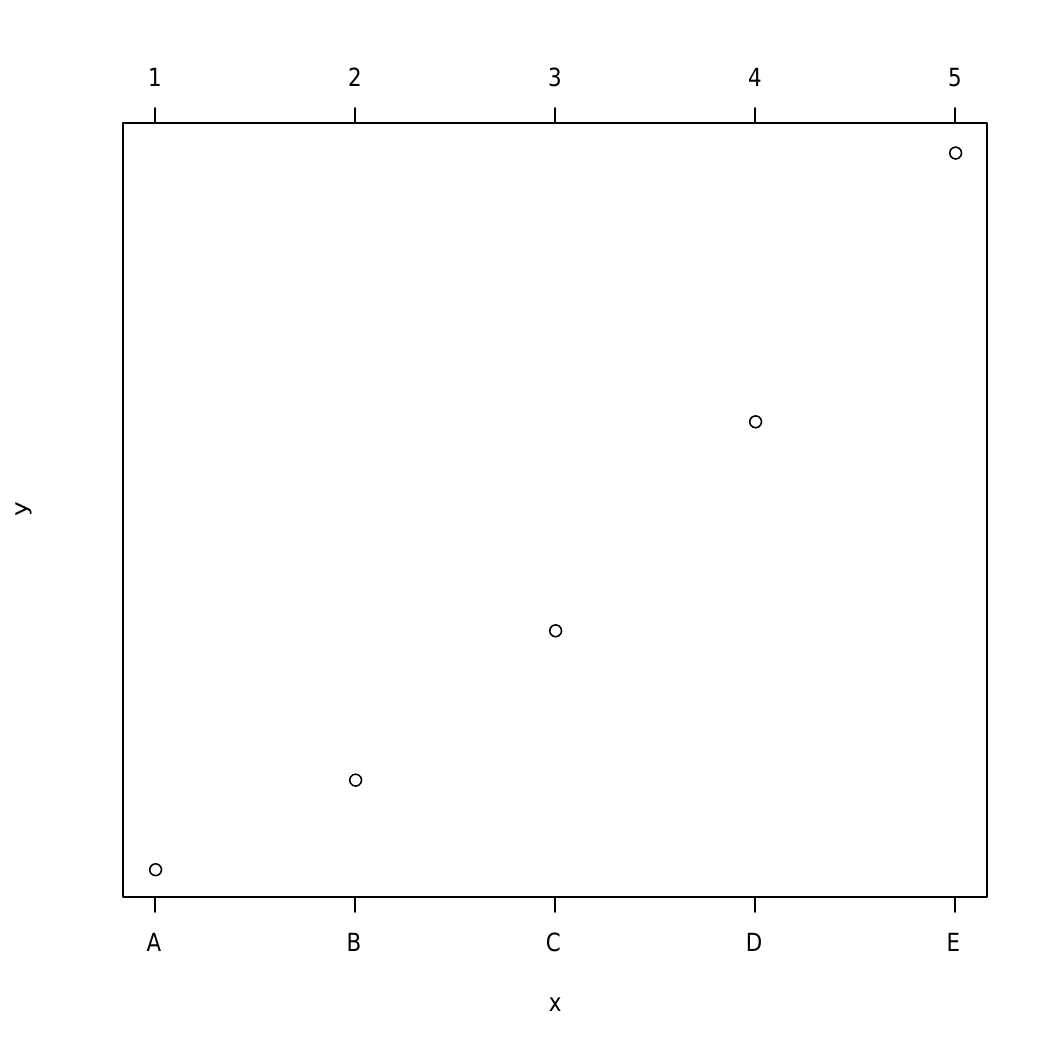
Output:
👁 ImageHere, a box is drawn to drawn using box() function around the axis so that it looks like a usual plot.
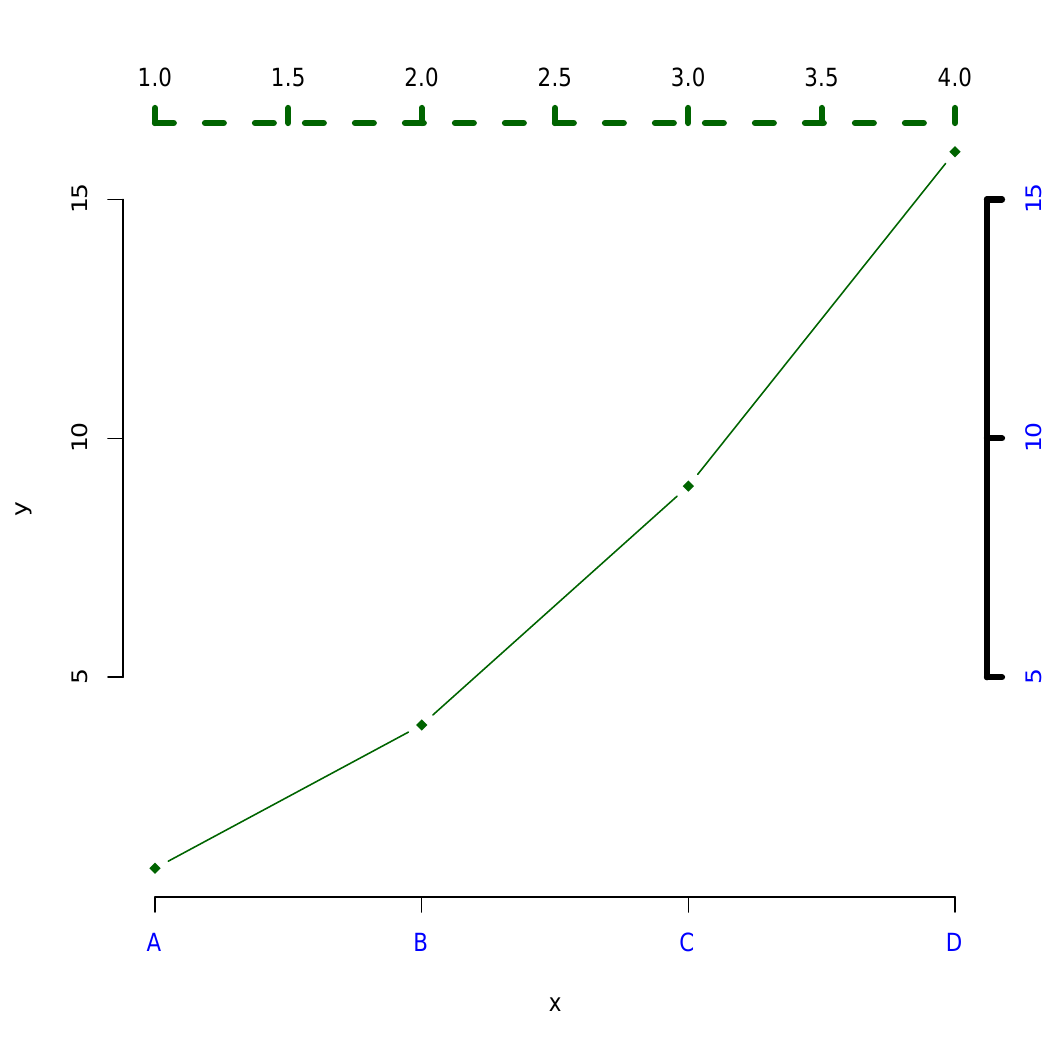
Example 3:Output:
👁 ImageHere, the different type of axis are drawn implementing modification in line width(lwd) and line type(lty).