 |
VOOZH | about |
|
VOOZH | about |
R Programming language is mostly used for statistics and data analytics purposes to represent the data graphically in the software. To represent those data graphically, charts and graphs are used in R.
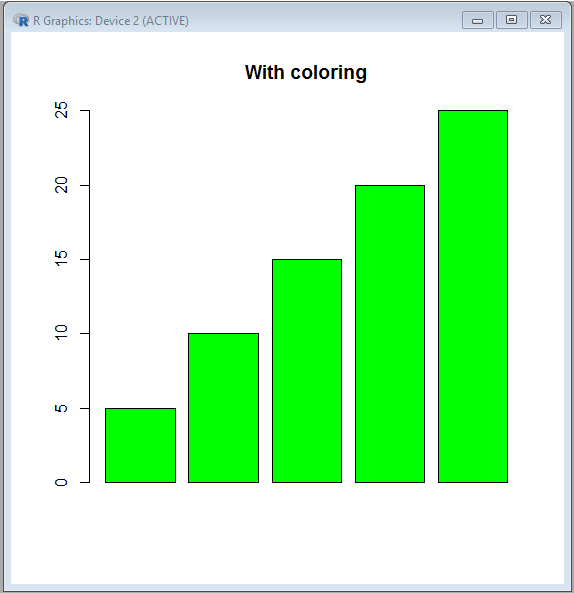
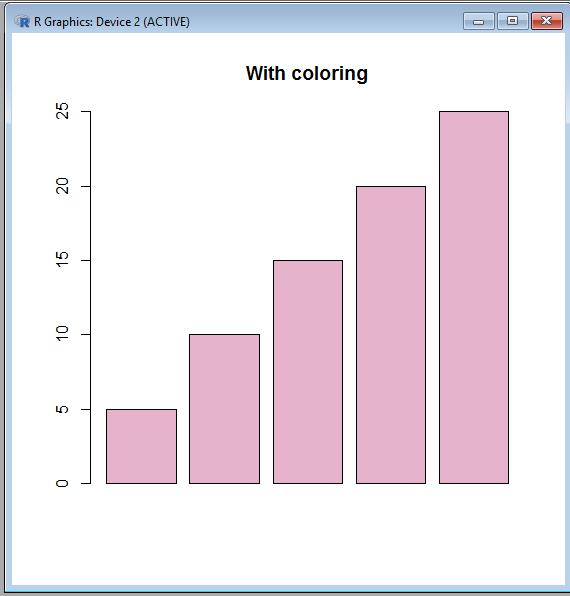
There are hundreds of charts and graphs present in R. For example, bar plot, box plot, mosaic plot, dot chart, coplot, histogram, pie chart, scatter graph, etc. We can visually enhance our plots and make them more attractive through colors. The col graphical parameter is brought into use for this purpose. The desired color's name can be expressed in the string.
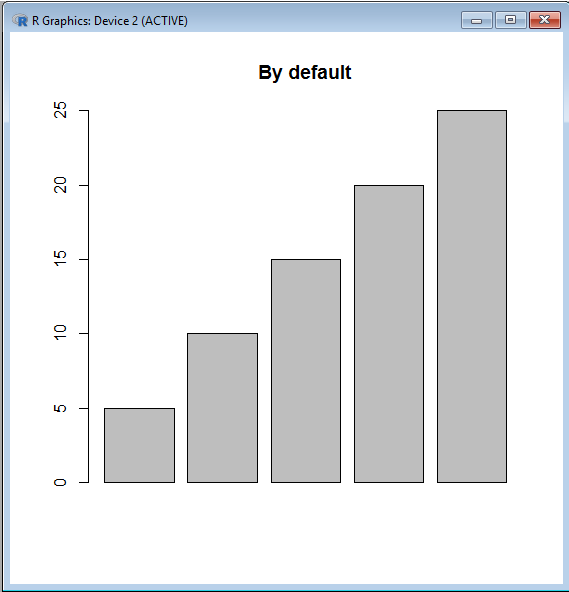
Syntax: barplot( A, col=color_name)
Example:
Output:
👁 ImageThere are a variety of 657 colors present in the R language for better data presentation. Through colors() function one can learn about all the vibrant colors present in R. The names of colors displayed are arranged alphabetically (except the color 'white' which is the first color displayed).
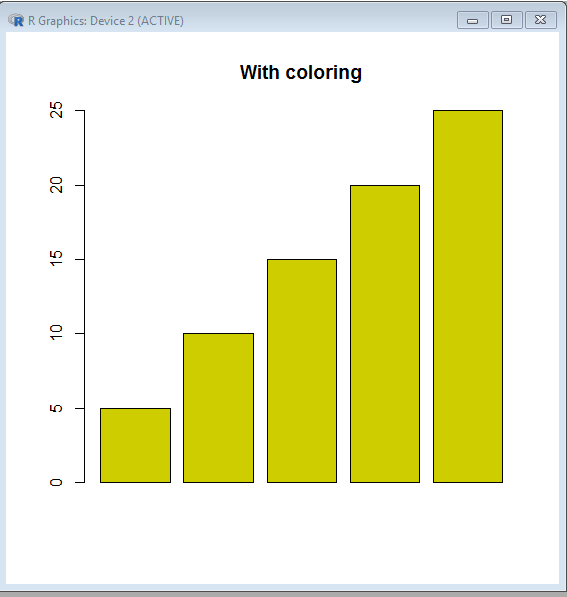
For using color in code, either its name is used or its order number is used.
Example:
Output:
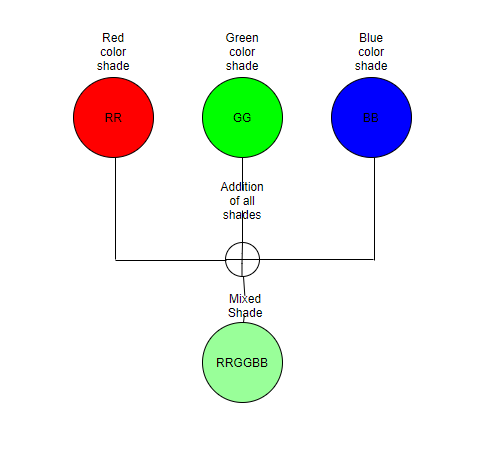
👁 ImageThough remembering color names is easier, at times colors are defined by the unique hexadecimal numbers which have been already predefined for each color in R. The six-digit length of the Hexadecimal number is in the format #RRGGBB.
The letters in this format signify:
And the color codes of Red, Green, and Blue ranges from 00 to FF. Then the color codes of Red, Green, and Blue will form a six-digit length of the Hexadecimal number which represents a color formed by mixing all the defined shades.
👁 ImageHence three basic pure shades can be written as:
Shade, when no color is present, is white(000000). Shade, when all the colors are present, is black(FFFFFF).
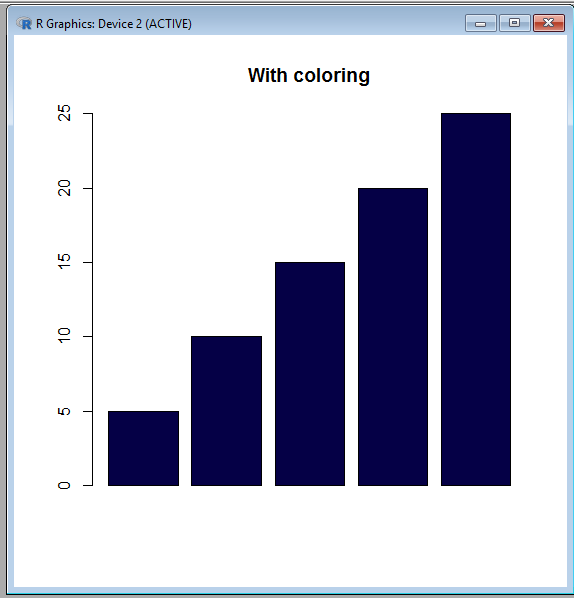
The function RGB specifies the shade of the color red, green, and blue between 0 and 1. Further the specified shades of these three basic components will be mixed to form a new shade. The shade of the color red, green, and blue can also be specified between 0 and 255. But there will be an added argument max=255 while using this range.
The function rgb() will return the corresponding hexadecimal code of the specified shade.
Output:
[1] "#E6B3CC"
[1] "#050046"
Output:
👁 ImageOutput:
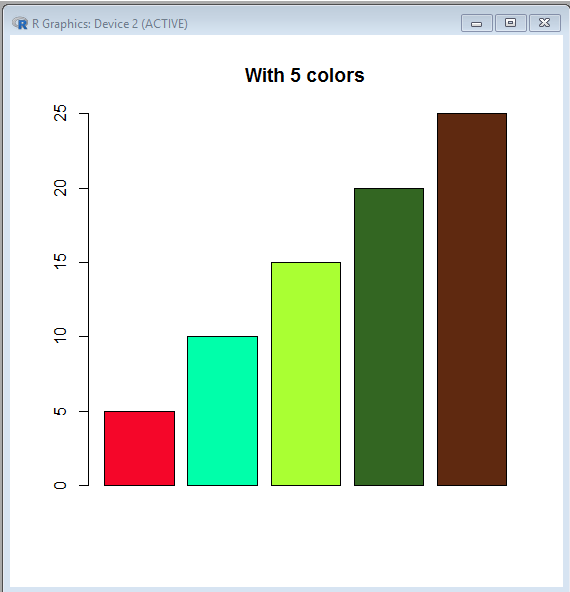
👁 ImageWhat if we require to represent every bar of the barplot with various colors? In that case, a vector of colors is created and this is also known as color cycling in R.
Output:
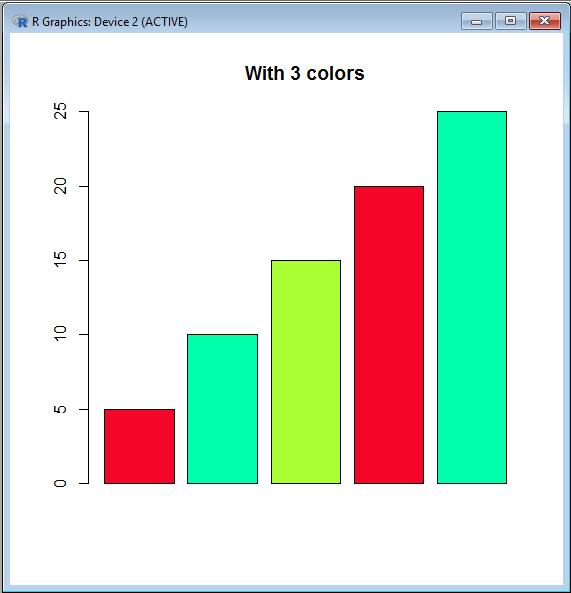
👁 ImageIf the provided vector's length is less than the number of bars present in the barplot then the color vector is reused.
Output:
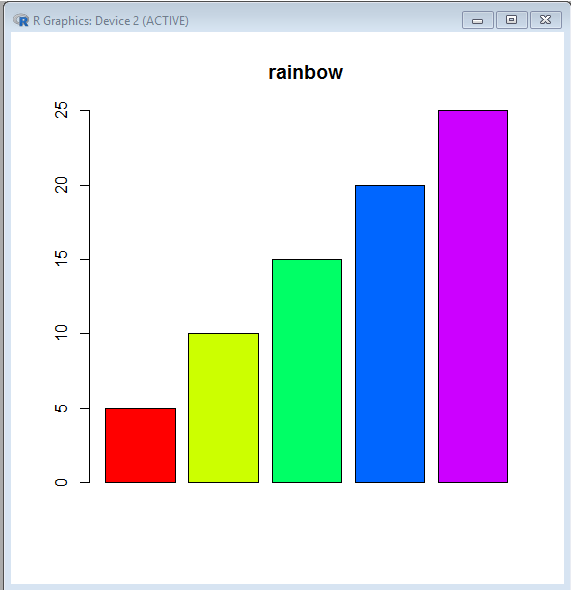
👁 ImageThe five inbuilt color palettes are provided in the R language for generating color vector easily and faster. They are:
All the stated functions take the color vector’s desired length as the parameter value. The function returns the hexadecimal code of the colors available. This hexadecimal code is of eight digits. This is because the last two digits specify the level of transparency (where FF is opaque and 00 is transparent)
Output:
[1] "#FF0000" "#CCFF00" "#00FF66" "#0066FF" "#CC00FF"

[1] "#FF0000" "#FF5500" "#FFAA00" "#FFFF00" "#FFFF80"

[1] "#00A600" "#E6E600" "#EAB64E" "#EEB99F" "#F2F2F2"

[1] "#4C00FF" "#004CFF" "#00E5FF" "#00FF4D" "#FFFF00"
Output:
👁 Image