 |
VOOZH | about |
|
VOOZH | about |
In data visualization with ggplot2, faceting allows us to split the data into subsets and create separate plots for each subset. stat_smooth is a function in ggplot2 that adds a smooth trend line to plots based on the underlying data. Combining these features allows for powerful visualizations where trends can be compared across different facets. This article explores how to selectively add stat_smooth to only one facet in a faceted ggplot2 plots in R Programming Language.
Faceting, also known as small multiples or trellis plots, involves creating multiple plots that share the same axes and scales, each representing a subset of the data. In ggplot2, faceting is achieved using facet_wrap() or facet_grid() functions.
Faceting is useful for visualizing relationships and trends across categorical variables. It allows for easy comparison of data subsets within the same plot framework, enhancing the ability to uncover patterns and variations.
stat_smooth is a statistical transformation in ggplot2 that adds a smoothed conditional mean to a plot, typically a line representing a trend (linear regression line, LOESS curve). It helps visualize trends and relationships in data.
To add stat_smooth to only one facet in a faceted ggplot2 plot, we need to conditionally apply stat_smooth to the desired facet while leaving others unaffected.
Let's use a sample dataset and demonstrate how to add stat_smooth to only one facet:
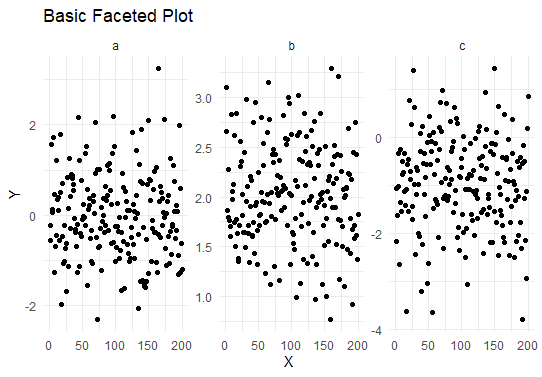
First, let's create a basic faceted plot without stat_smooth:
Output:
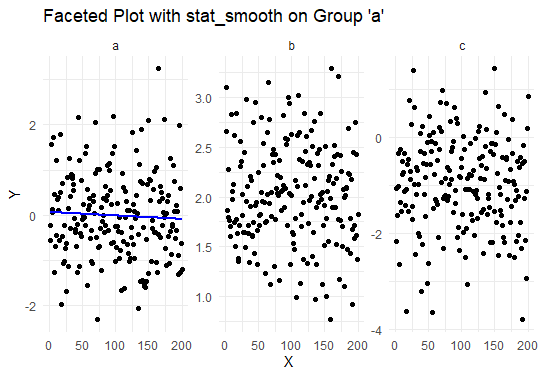
Now, let's add stat_smooth to only one facet (group == "a") using conditional logic:
Output:
Here we discuss some of the main Benefits and Considerations.
Adding stat_smooth to only one facet in a faceted ggplot2 plot enhances visualization capabilities by selectively highlighting trends within subsets of data. By leveraging conditional logic and geom_smooth, analysts can effectively communicate insights and comparisons across categorical variables. This article has provided both theoretical insights and practical examples to guide the implementation of this technique in data visualization tasks. Experiment with different datasets and customization options to harness the full potential of faceted plots with stat_smooth in ggplot2 for your analytical needs.