 |
VOOZH | about |
|
VOOZH | about |
abline() function in R Language is used to add one or more straight lines to a graph. The abline() function can be used to add vertical, horizontal or regression lines to plot.
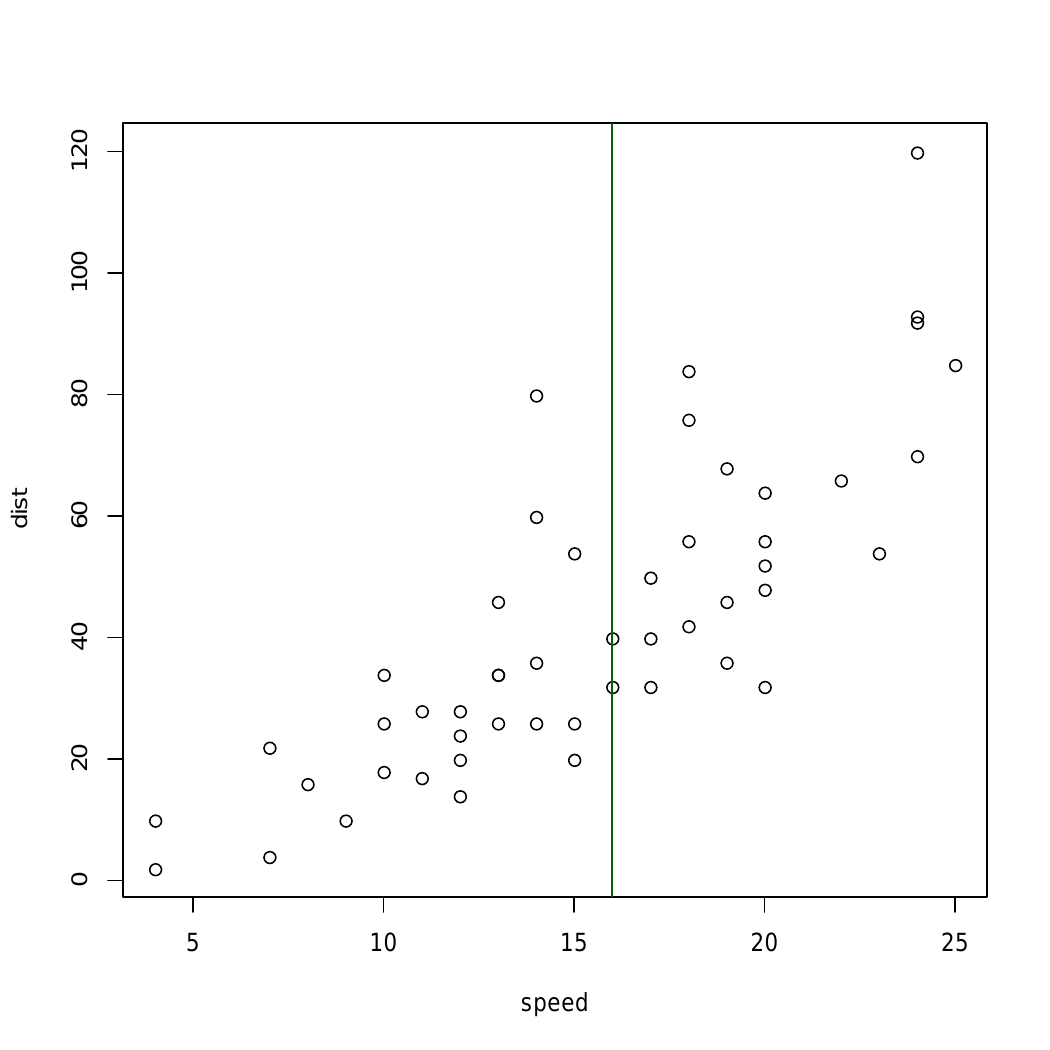
Syntax: abline(a=NULL, b=NULL, h=NULL, v=NULL, ...) Parameters: a, b: It specifies the intercept and the slope of the line h: specifies y-value for horizontal line(s) v: specifies x-value(s) for vertical line(s) Returns: a straight line in the plotExample 1: To add a vertical line to the plot
Output:
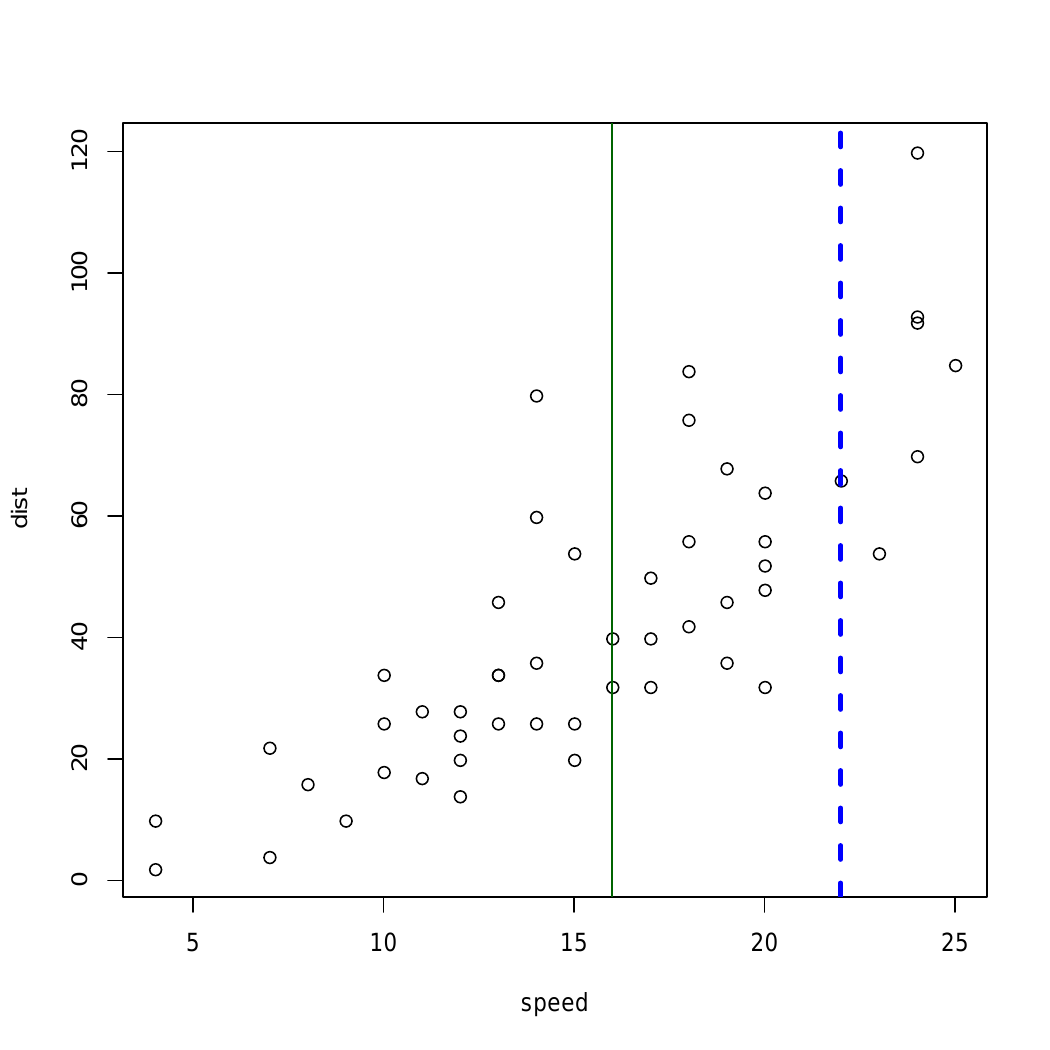
👁 ImageHere, in above example straight line is added using abline() to different graphical plots
Output:
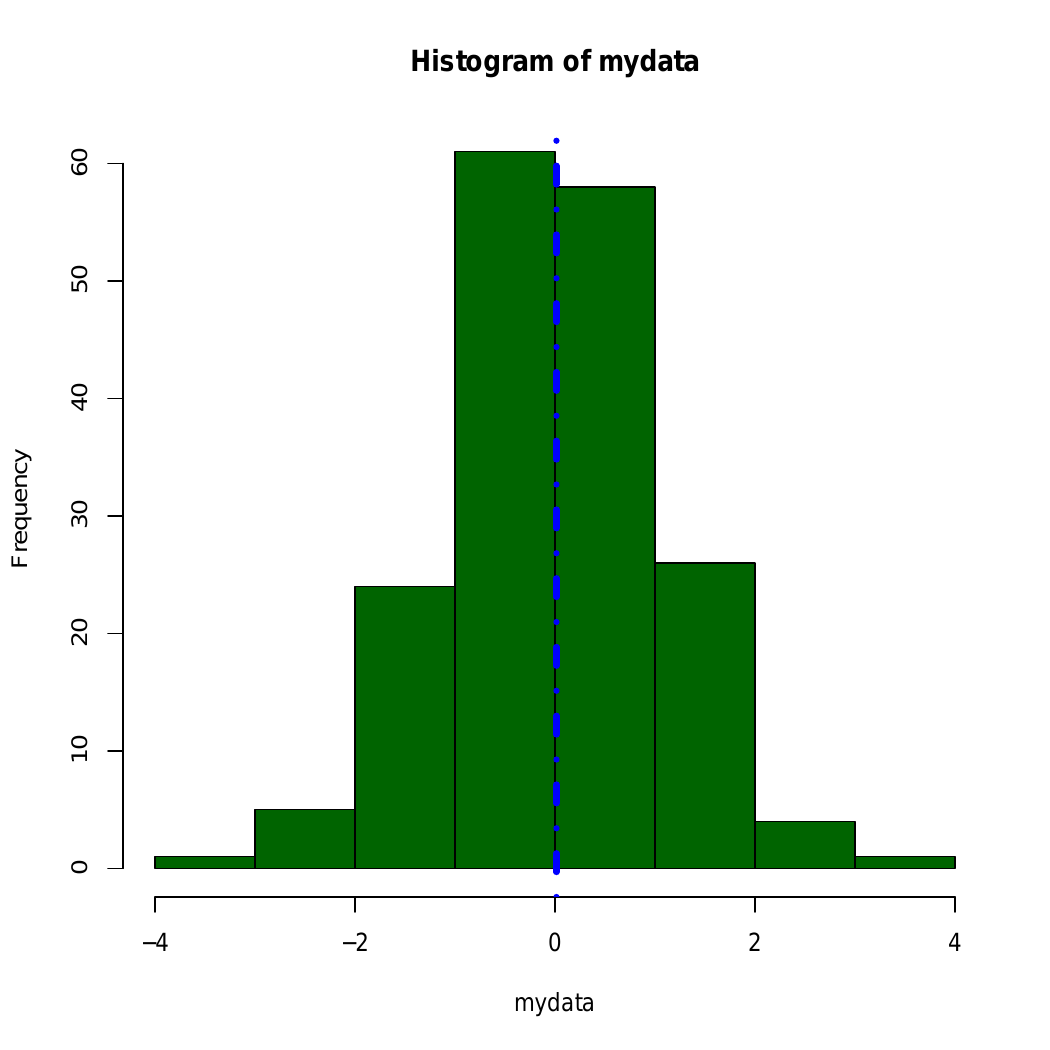
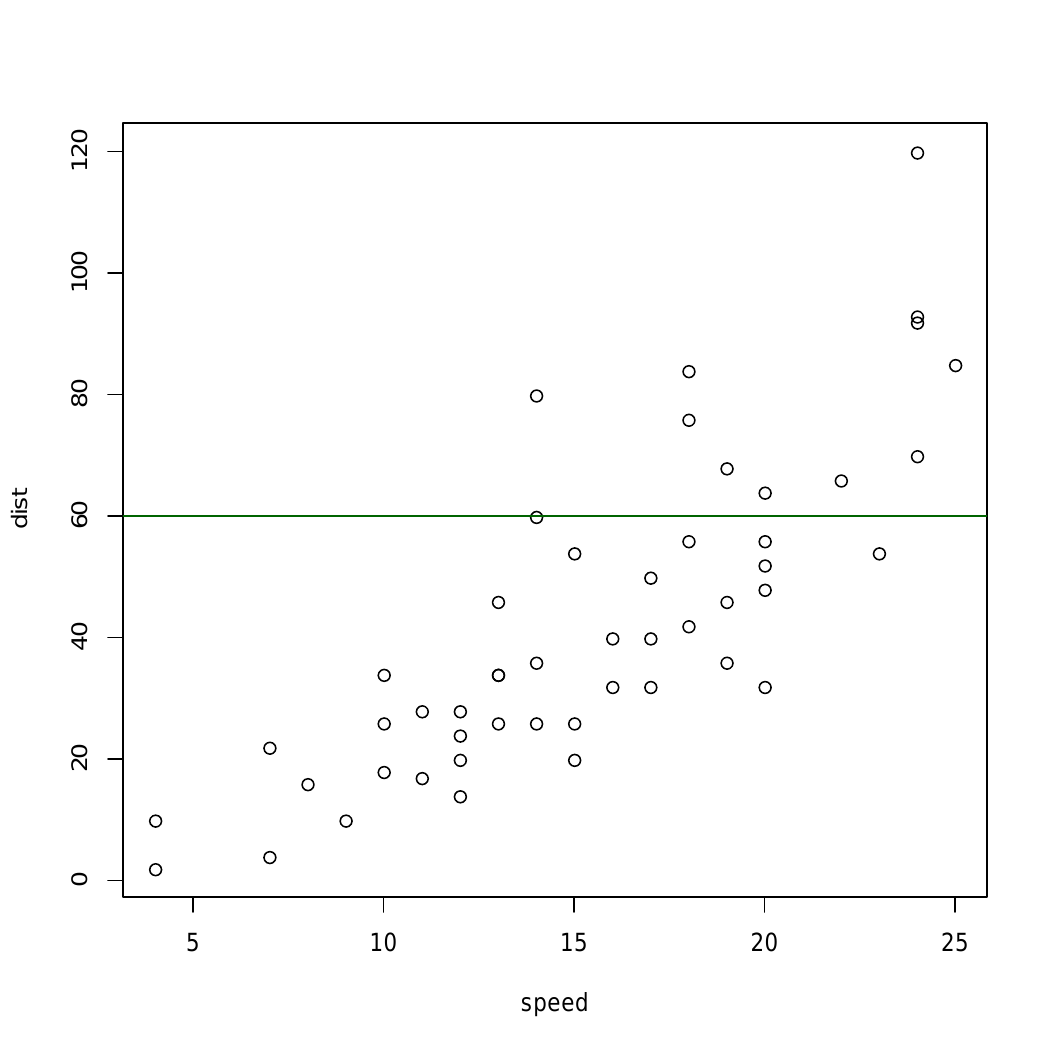
👁 ImageIn above example abline() Function draws an horizontal line on the current plot at the specified ‘x’ coordinates.
Output:
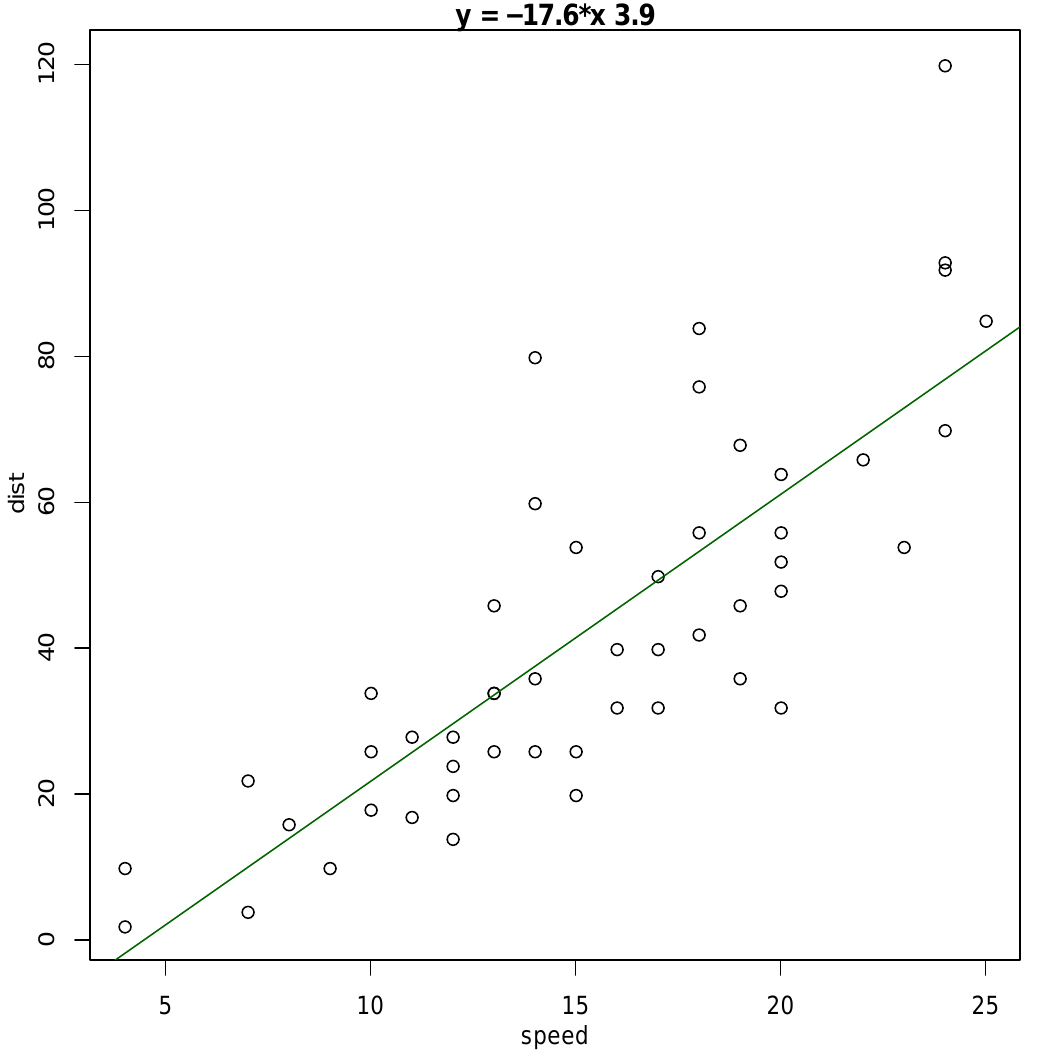
👁 Imageabline() function and plot relation between speed and distance.