 |
VOOZH | about |
|
VOOZH | about |
Text is defined as a way to describe data related to graphical representation. They work as labels to any pictorial or graphical representation.
text() Function in R Programming Language is used to draw text elements to plots in Base R.
Syntax: text(x, y, labels)
Parameters:
Returns: Added text to plot
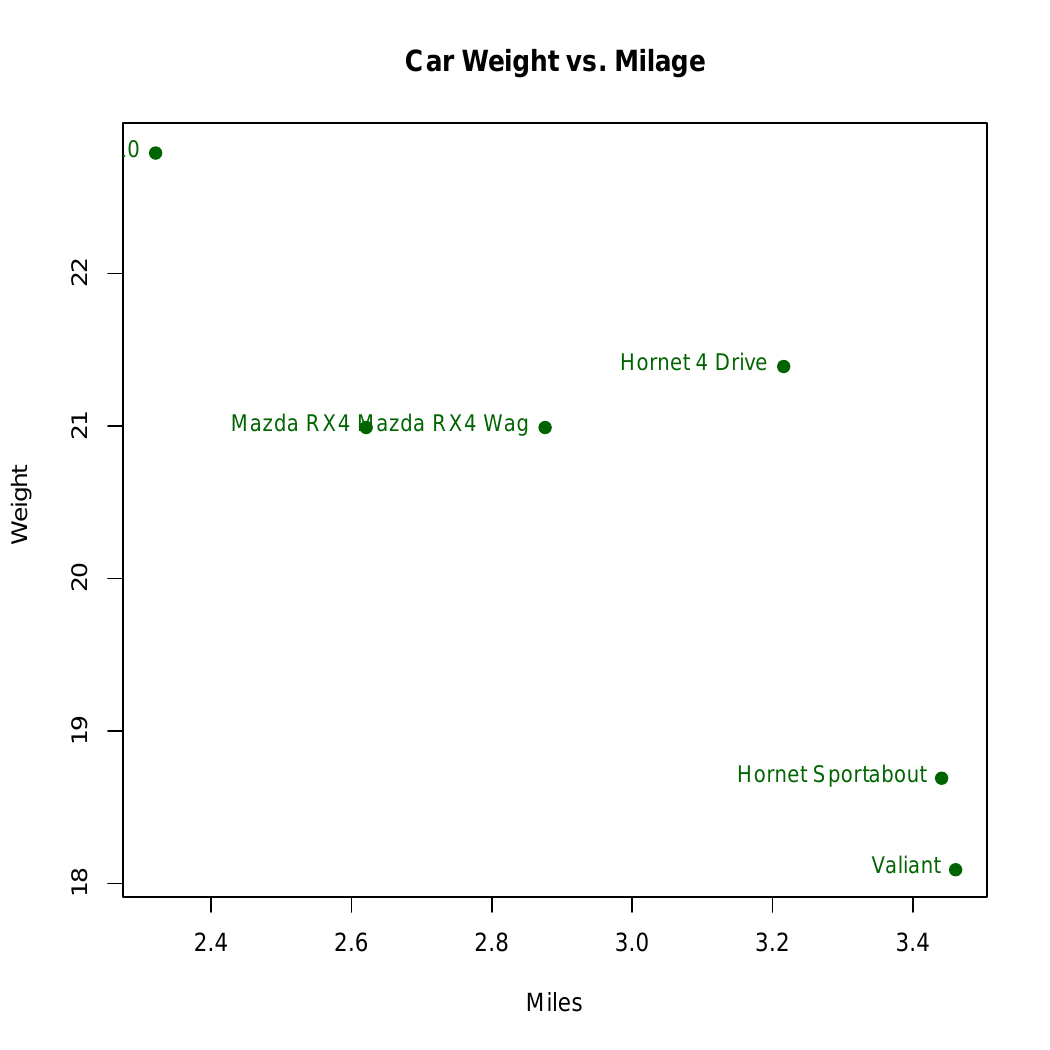
We are using the head(mtcars) function to load the first 6 rows of the dataset. The plot() function creates a scatter plot with car weight (wt) on the x-axis and miles per gallon (mpg) on the y-axis. We then use the text() function to label each data point with the corresponding car names from the row names.
Output:
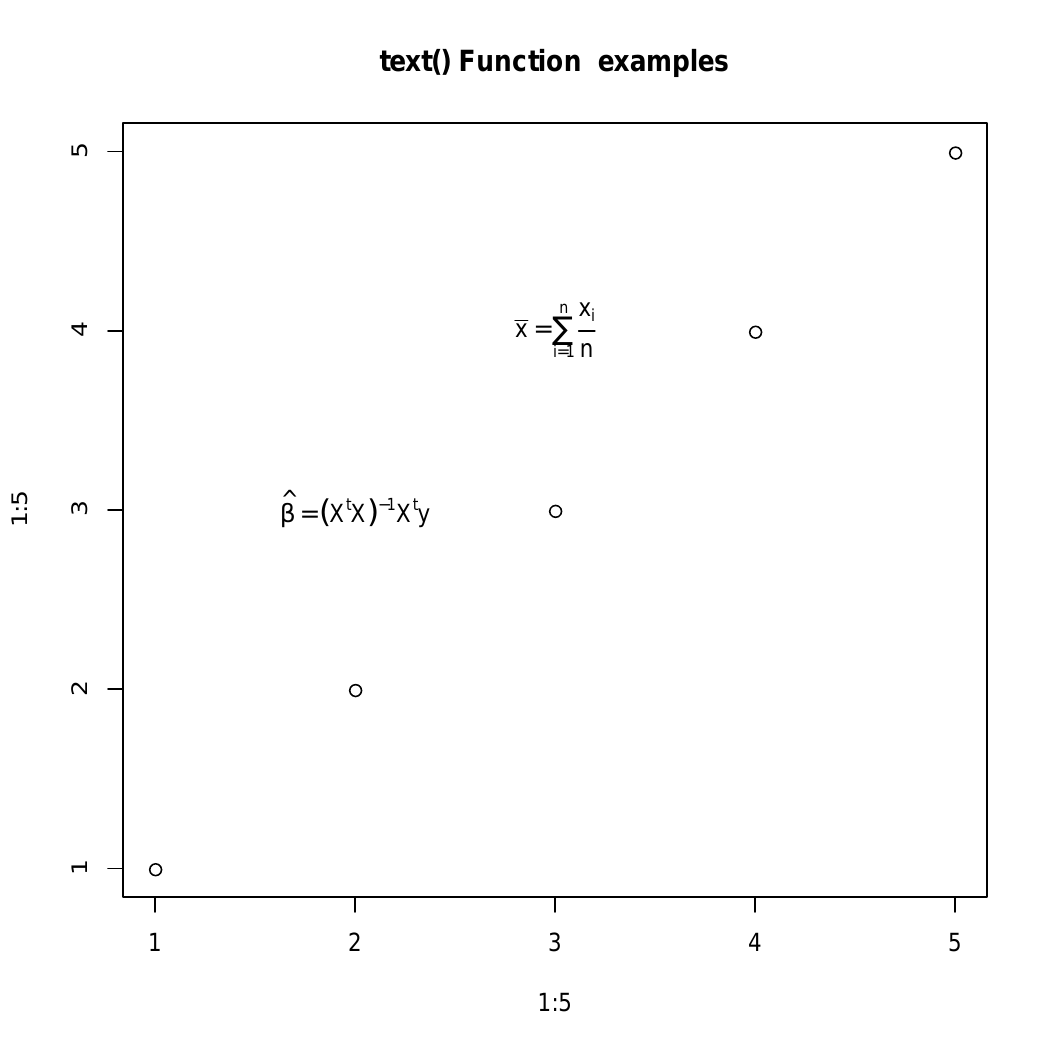
We are using the plot() function to create a basic graph with points ranging from 1 to 5. The text() function is then used to add mathematical expressions to the plot. The first text() call adds the formula for beta hat (a linear regression coefficient), and the second text() call adds the formula for the mean (bar(x)). The expressions are formatted using R's expression() function to display mathematical notation.
Output:
mtext() function in R Programming Language is used to add text to the margins of the plot.
Syntax: mtext(text, side)
Parameters:
Returns: Added text in the margins of the graph
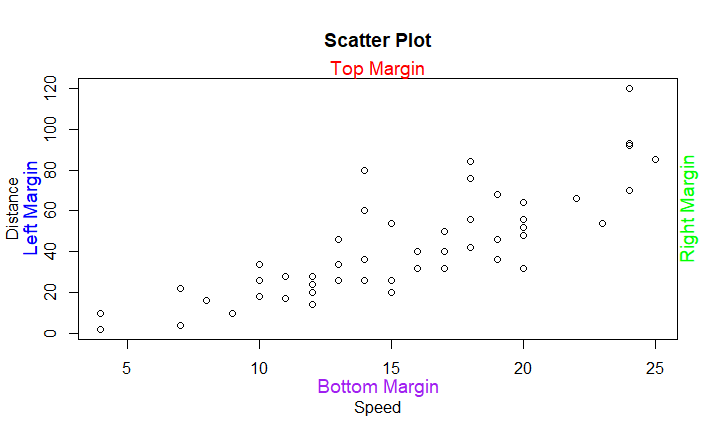
We create a scatter plot using the plot() function with the cars dataset. The mtext() function adds text annotations to the plot's margins: "Left Margin" in blue on the left, "Right Margin" in green on the right, "Top Margin" in red at the top, and "Bottom Margin" in purple at the bottom. The side parameter defines the margin, line adjusts the position, col sets the text color, and cex controls the text size.
Output:
In this article we explored the text() and mtext() functions , that can be used in our plots.